ISSN ONLINE(2319-8753)PRINT(2347-6710)
ISSN ONLINE(2319-8753)PRINT(2347-6710)
V. Lakshmana Rao1, P.Satish2, A.Sravani3
|
| Related article at Pubmed, Scholar Google |
Visit for more related articles at International Journal of Innovative Research in Science, Engineering and Technology
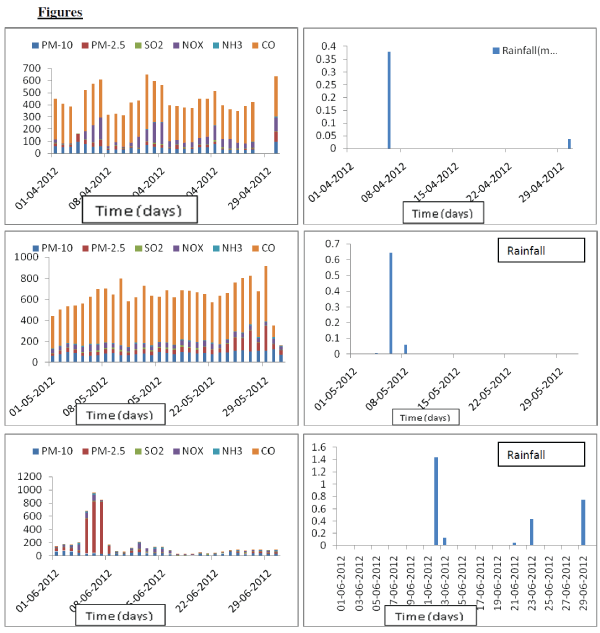
Air pollution is the most commonly observed weather phenomena on urban and coastal industrial area. It has been play an important role on rainfall and climate variability in synoptic scale system. In the present study we have simulated the concentration of air pollutants and the rainfall data over the coastal city of Visakhapatnam (17°.68’N, 83°.21’E) by using histograms for this study. The observing time period is selected from (01-04-2012 to 01-03-2013). The air pollution data is collected from the area of CMQY RAMKY in the coastal industrial city of Visakhapatnam with the parameters SO2, NO2, CO2, NH3, PM 10 and PM2.5. This study is could predict the concentration of air pollutants and monthly variation in rainfall. . In the month of April the carbon monoxide (CO) values are very high when compared with the other pollutants, the highest value of CO is 600μg/m3 simultaneously the rainfall values are very low and the days of rainfall are low. While in the month of May, same pattern continues, the concentration of CO levels are very high than other pollutants. In the month June due to the onset of monsoon the concentration of pollutants are very low, the CO levels are very low compared to all other pollutants. The precipitation will wash out the heavy metals and trace gaseous particles
Keywords |
| climate variability, synoptic scale, coastal city, onset |
INTRODUCTION |
| According to Seinfeld (1986), Air pollution may be defined as any atmospheric condition in which substances are present at concentrations high enough above their normal ambient levels to produce a measurable effect on man, animals, vegetation or materials. By ‘substances’ we mean any natural or manmade chemical elements or compounds capable of being airborne. These substances may exist in the atmosphere as gases, liquid drops or solid particles. Our definition includes any substance, whether noxious or benign; however, in using the term ‘measurable effect’ we will generally restrict our attention to these substances that cause undesirable effects. According to Altshuller, A.P and Bufalini, JJ (1965), Materials that are emitted in the atmosphere are subjected to a number of interesting and unusual reactions. These reactions lead too many products whose deleterious effects have now been recognized as one of the most pressing problems in urban areas throughout the world. These effects can be observed in reduced visibility eye irritation, plant damage, cracking of rubber and corrosion of metals. Many of the problems confronting chemists participating in the study of the photochemical aspects of air pollution have been thoroughly reviewed by Leighton (43). |
| Mainly the actions of the people are the primary cause of pollution increases, the attendant pollution problems also increase proportionately. The first significant change in man’s impacts on nature came with the discovery of fire. Prehistoric man built a fire in his cave for cooking, heating and to provide light. The problem of air pollution came into existence at that time. Since then man is making rapid strides of progress in science and technology in utilizing the natural resources for better comforts. His eagerness to increase comforts leads to rapid industrialization and urbanization. The adverse effects of increase in industrialization and urbanization are obsolescence of the infrastructure, the pollution of the city atmosphere, the lack and bad quality of drinking water, overcrowding and traffic difficulties, the decreases in areas of greenery etc. |
| Man uses the atmosphere not only as a resource but also a place for dumping wastes. He takes from it oxygen, a necessary ingredient for his own survival and return to it a mixture of gases and solids, the byproducts of combustion, respiration and other energy transferring activities thus tampering the ecosystem. Increased urbanization and industrialization leads to increase in the concentration of conventional pollutants are emitted as a result of burning of fossil fuels like coal, petrol, natural gas, diesel oil etc. The adverse effects of air pollutants are now well documented. The atmosphere is having tremendous capacity to dilute and disperse air pollutants. The winds carry them, the turbulence mixes well them, the heat energy transforms them, the precipitation washes them down but yet there is a limit to this dilution. In urban centers, when the emissions are more, the concentrations built up (in spite of dilution) and ask for concerted efforts to control air pollution. |
| While estimating the air pollutants in coastal stations, the local mesoscale circulation circulations like sea and land breezes are too estimated. The air pollutants are subjected to local wind circulations like sea breeze, which promote the flushing action of the pollutants. So while considering air pollution aspects of coastal stations, a scientific study. |
DATA AND METHODOLOGY |
| The sampling location is c hosen here is the CMQY RAMKY industries in the coastal industrial city Visakhapatnam (17°42'N; 82°18'E) highly industrialized coastal metropolitan city on the East coast of India. This Indian Coastal city is suppose to be one of the rapidly cities in the world. Here in this study we taken major air pollutants are TSPM (Total suspended particulate matter), RSPM (Respirable suspended particulate matter), So2 and No2 and PM2.5 and PM-10 and carbon monoxide. For the year of April 2012 to march 2013. In the sampling location we have collected the meteorological parameters also. Here in this case we are comparing the all pollutants and the rainfall over the sampling location because the rainfall is major factor for the wash out of the pollutants. |
RESULTS AND DISCUSSIONS |
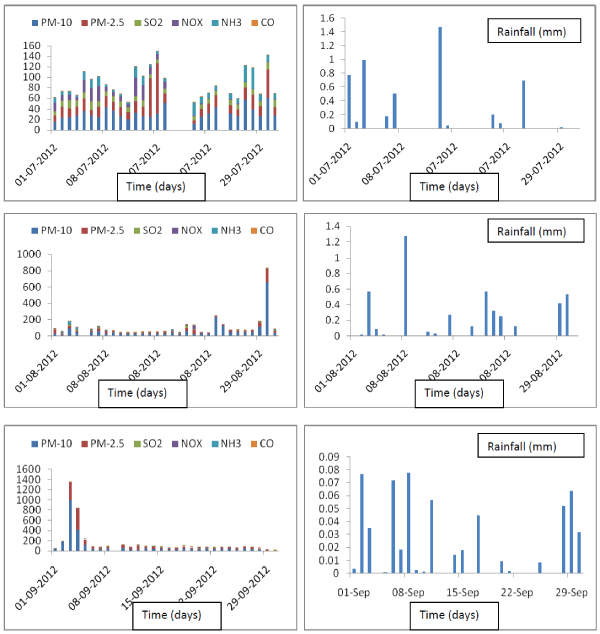
| The histograms are shows the concentration of pollutants in the left panel and the rainfall values in the right panel. In the month April the carbon monoxide (CO) values are very high compared with the other pollutants the highest value of CO is 600μg/m3 simentenously the rainfall values are very low and the days of rainfall are low. While in the month of May also same pattern continues the concentration of CO levels are very high other pollutants. In the month of April and May there is very less rainfall and less convective activities recorded. |
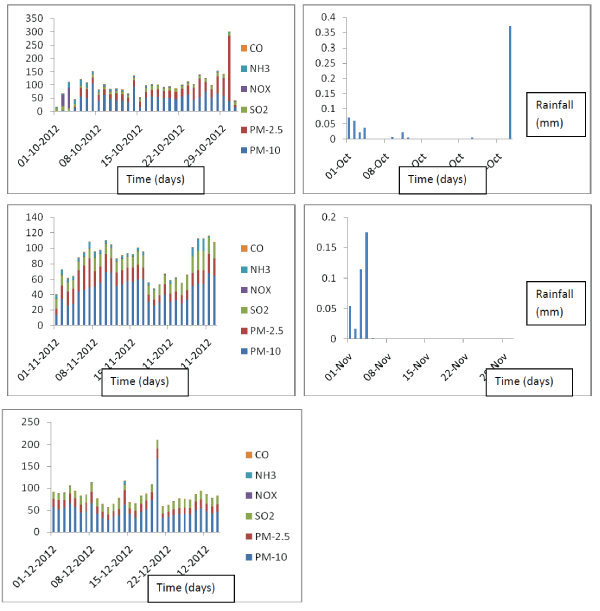
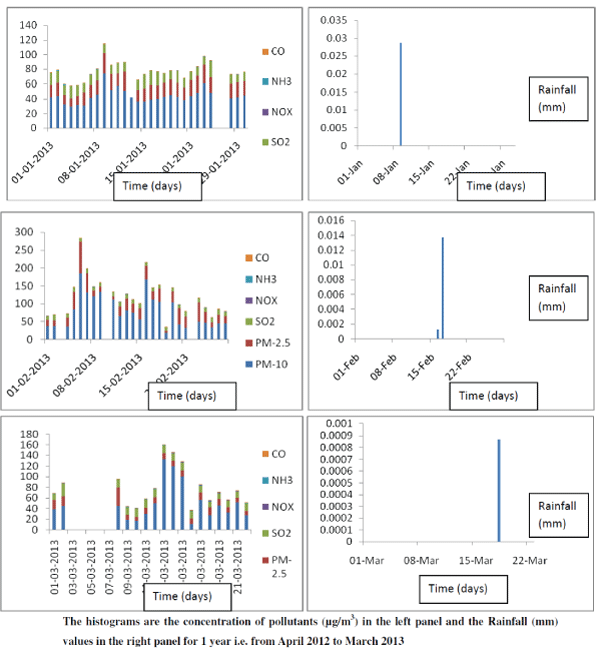
| In the month June due to the onset of monsoon the concentration of pollutants are very low the CO levels very low compared to the all other pollutants. The precipitation will wash out the heavy metals and trace gaseous particles. In the month of July the days of rainfall occurrence is very high so the pollutants are very less of all the pollutants the PM 10 concentration are high in this month. In the month of august the total 19 days recorded rainfall so the concentrations of pollutants are very less in the month august and as well as in the month of September also. After with drawl of monsoon the rainfall activity is very less over sampling location i.e. in the months of October and November so the pollutant concentrations are very high. While in the month November first week a huge thunder storm occurred over the sampling location in the first week of November the pollutant concentrations are low compared to the preceding days. In the month of December the concentrations of pollutants recorded very high values compared to the all months the range of pollutants is in between 150 to 350 μg/m3 in the month December while the other months in between 140 to 250 μg/m3 only. The months of January , February and March are all the winter months less rainfall records and high concentration of pollutants majorly the PM10 and PM 2.5 concentration are high because the temperatures low in the winter months due to the low temperatures the trace metals are like CO, NH3 are less recorded. The over results it can be seen that the in the coastal regions the sea surface warming and monsoon current creates unstable lapse rates and intermittent, moderate to heavy convective shower activity frequently occur. Under these conditions the well mixing is present. Under such mixing conditions. The trace particulate species would be expected to be well mixed in the boundary layer below the cloud base. So the concentrations of particulate matter are very high compared to the other pollutants concentration. |
SUMMARY AND CONCLUSIONS |
| In the present study we have taken the observations the CMQY RAMKY industry which is located in the Visakhapatnam which is a coastal city. The concentrations of So2, No2, CO, NH, PM10 and PM 2.5 are taken. The overall results in the April and may summer days the metal oxides of CO is very high compared to the other pollutants. In the monsoon months due to the frequent convective activity the concentrations of pollutants are very less. In the months of Nov to March 2013 the pollutants concentration levels are increased. Of all the other pollutants the PM10 is very high. So it can be concluded that the PM is place major role in coastal cities due to well mixing in the boundary layer. Due to the sea and land breezes local thermal circulation. |
 |
 |
 |
 |