Keywords
|
| Acute Lymphoblastic Leukemia, Thresholding, WBC segmentation, FAB (French-American-British) classification. |
INTRODUCTION
|
| Leukemia is the blood cancer related with white blood cells [1]. It is a bone marrow disorder that arises when abnormal white blood cell begins to continuously replicate itself. These cells do not function normally. These are basically fighting cells but cause infections when are affected and found as abnormal in blood. As they accumulate, they inhibit the production of other normal blood cells in the marrow, leading to anemia, bleeding, and recurrent infections. Over time, the leukemic cells spread through the bloodstream where they continue to divide, sometimes forming tumors and damaging organs such as the kidney and liver. Acute leukemia is classified according to the French-American- British (FAB) classification into two types: Acute Lymphoblastic Leukemia (ALL) and Acute Myelogenous Leukemia (AML) [2]. Acute leukemia is a rapidly progressing disease that affects mostly cells that are unformed (not yet fully developed or differentiated). ALL is most common in children while AML mainly affects adults but can occur in children and adolescents. |
| The early and fast identification of the leukemia type, greatly aids in providing the appropriate treatment for the particular type. Its detection starts with a complete blood count (CBC) [3]. If there are abnormalities in this count, patient should perform bone marrow biopsy. Therefore, a study of morphological bone marrow and peripheral blood slide analysis is done to confirm the presence of leukemic cells. In order to classify the abnormal cells in their particular types and subtype of leukemia, an expert operator will observed some cells under a light microscopy looking for the abnormalities presented in the nucleus or cytoplasm of the cells [4]. This classification is very important to determine which treatment should be given to the patient. However, this analysis suffers from slowness and it presents a not standardized accuracy since it depends on the operator’s capabilities and tiredness. Therefore, this paper presents a fast and effective segmentation procedure for blast images which is very helpful for improving the hematological procedure and accelerating diagnosis of leukemia diseases. |
LITERATURE SURVEY
|
| By observing the literature, it is found that several works have been conducted in the area of general segmentation. A fully automatic method for segmentation and border identification of all subjects that do not overlap the boundary in an image taken from a peripheral blood smear slide is presented in [5]. Segmentation by morphological preprocessing followed by the snake balloon algorithm is presented in [6]. A WBC segmentation scheme on color space images using feature space clustering techniques, scale-space filtering for nucleus extraction and watershed clustering for cytoplasm extraction is presented in [7]. Use of morphological operators and examining the scale-space properties of toggle operator to improve segmentation accuracy is done in [8]. The automatic morphological method that is based on the morphological analysis of WBCs is presented in [9]. The use of teager energy operator for segmentation, nucleus based on the edges, which are detected effectively by teager energy operator is done in [10]. A multi-step segmentation scheme is used in [11]. The automatic thresholding method is proposed in [12]. The following sections describe the whole process for the detection of leukemic cells in blood smear images. The dataset which is obtained for the detection of leukemia is available for download [13]. |
METHODOLOGY
|
a. OVERVIEW OF THE PROPOSED METHOD
|
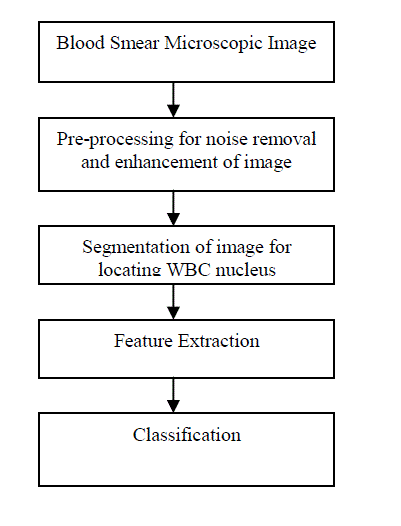
| The main goal of this work is the processing and analysis of microscopic images, in order to provide a fully automatic procedure to support the medical activity, able to count and classify the WBCs affected by ALL. Leukocytes are easily identifiable from microscopic images, as their nuclei appear darker than the background, but data extraction from WBCs can present some complications due to wide variations in cell shape, dimensions and edges. The generic term leukocytes refers to a set of cells that are very different between them, which includes neutrophils, basophils, eosinophils, lymphocytes and monocytes, also distinguishable by the presence of granules in the cytoplasm and by the number of lobes in the nucleus. The lobes are the most substantial part of the nucleus and are connected to each other by thin filaments. Furthermore lymphocytes suffering from ALL, called lymphoblast, have additional morphological changes that increase with increasing severity of the disease. In particular, lymphocytes present a regular shape, and a compact nucleus with regular and continuous edges. Instead, lymphoblast present shape irregularities, small cavity in the cytoplasm, calls vacuoles, and spherical particles within the nucleus, called nucleoli. Therefore, in this paper, we present a method to identify all types of WBCs present in the microscopic images, which need various steps to reach the goal, and then classify WBCs as suffering from ALL or not. The whole process can be schematized as showed in Figure 1. |
| The main objective of this work is to design and develop a robust segmentation method for detection of blast cells. Normally, the number of white blood cell in patients with positive cases of leukemia will increase. The increasing number of white blood cell will increase the ratio of white blood cell (WBC) to red blood cell (RBC). Thus, it is important to have a cost effective image processing system which will assist heamatologists to determine the ratio of white blood cells to red blood cells for leukemia detection. The methodology used to develop the image processing system is described in the following sections. |
b. LEUKOCYTE IDENTIFICATION SYSTEM
|
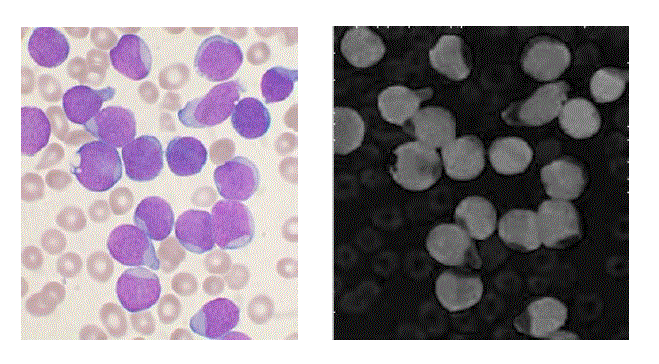
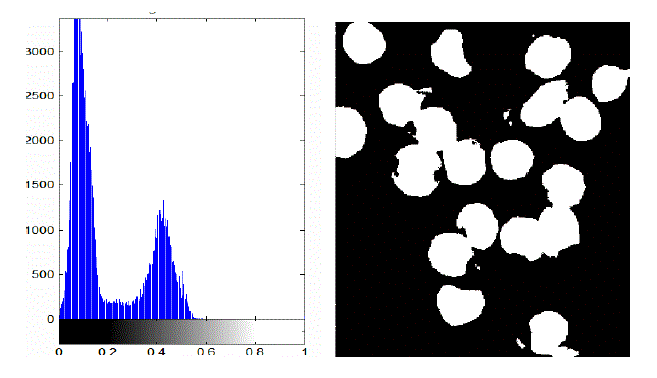
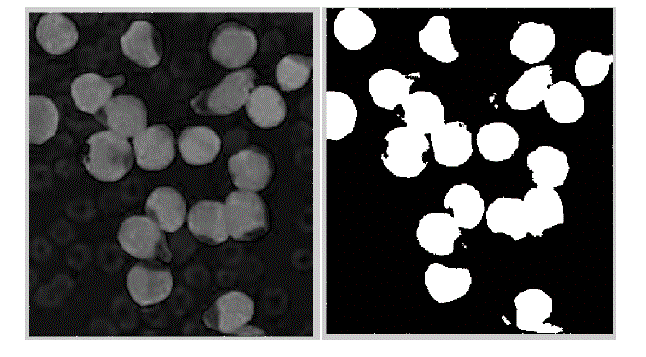
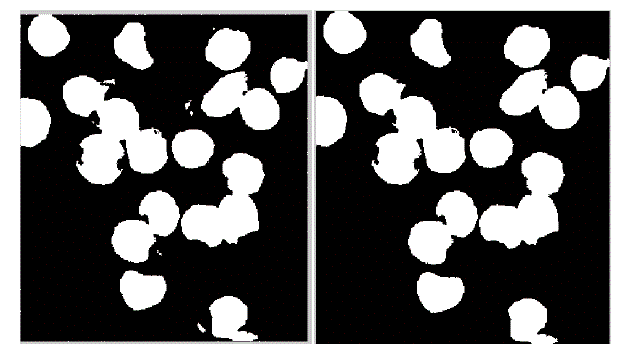
| In the proposed method instead, the membrane is detected firstly, in order to deal the subsequent separation of the adjacent cells more accurately. The WBCs identification was made possible using the conversion in the HSV color model. In fact, we have observed that leukocytes are more contrasted in the S component of HSV color model. Figure 2 shows an example of why S component has been selected. A redistribution of image gray levels is necessary in order to make easier the subsequent segmentation process. Then, the histogram equalization or a contrast stretching can be used at this stage. The segmentation is realized using the technique in which threshold value is automatically calculated. There are many threshold techniques available in literature [14]. Here, we use the threshold value based on Otsu’s method [15] (see Figure 3). To get a better result it is necessary to remove the image background. The proposed approach involves the use of an automatic threshold to the original gray level image or along the S component of the RGB color space. The threshold value is calculated again using the Otsu’s method (see Fig. 4) automatically. Background removal can be performed with simple arithmetical operations. In order to clean up the image we have used the operation called area opening, that allows to delete all the objects with a size smaller than the structuring element. |
c. LOCATING AND SEGREGATING NUCLEUS
|
| Once the results with white blood cells by removing other cells are obtained, it is now possible to verify the overlapping of leukocytes and their separation. There are various methods to separate and to determine the objects in the image [16]. In the present work, we have used labelling method which labels and finds in the image the output value. In short, it labels all isolated regions with separate numbers. The labelled objects are now individual cells which are segregated and ready to find out the features of individual cells. For extracting the features, we use regionprops function in MATLAB [17]. These region properties can compute a number of useful features of each object. |
d. NUCLEUS DETECTION
|
| Once the labelled cells are obtained using above method, the overlapped cells are removed and only the non overlapped cells considered for feature extraction. |
e. FEATURE EXTRACTION
|
| An image feature is a distinguishing primitive characteristic or attribute of an image [18]. Some features are natural in sense that such features are defined by the visual appearance of an image, while other, artificial features result from specific manipulations of an image.1) natural features include the luminance of a region of pixels and gray scale textural regions. 2) Image amplitude histograms and spatial frequency spectra are examples of artificial features. In the present work, following features of lymphocytes have been observed. These are area, perimeter, eccentricity, form factor. These are important mainly due to the shape of nucleus for differentiation of lymphoblast. These features are extracted from binary image. In this image, nonzero pixels represent the nucleus region. |
| Area: The area is the total number of nonzero pixels which is the object in the image. |
| Perimeter: Any pixel whose four neighbourhoods are white is surely not a boundary pixel as it lies interior of the cell. So we get number of those pixels whose four of the neighbourhoods are white. And if we subtract this value from the total area of the image then this will give area outside the cell along the perimeter of the cell. |
| Eccentricity: It is the roundness of the object, with the value 0.0 up to 1.0, a circle is perfectly round and has an eccentricity 0, while a line segment has eccentricity 1. |
| Form Factor: The form factor is a function of area and perimeter of the object under consideration. |
 |
RESULTS AND DISCUSSION
|
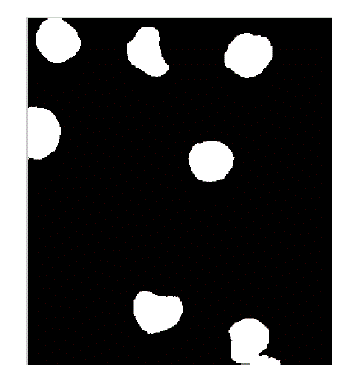
| The present technique is applied to 10 images of blood smear. A microscopic image of size 347 X 395 is used and processed for evaluation. The various results obtained are shown below. In the result, input image and saturation component image which is selected for processing is shown in figure 2. In figure 3, the histogram of S component is shown. By using Otsu’s thresholding algorithm the saturation threshold which is binary image and its final segmented output is shown in figure 4. In figure 5, the various artifacts and unwanted pixels are removed by areaopening. In figure 6, the final segmented nucleus is shown. These obtained nuclei are further used to extract various features and to identify lymphoblast. |
CONCLUSION
|
| The basic aim of the present work is the ALL slide image segmentation followed by feature extractions. We mainly considered shape features like area, perimeter, eccentricity, form factor etc. for the detection of lymphoblast i.e. leukemia. Results obtained encourage the future work to develop a robust segmentation system independent of stains used in blood smear images. |
| |
Figures at a glance
|
 |
 |
 |
| Figure 1 |
Figure 2 |
Figure 3 |
| |
 |
 |
 |
| Figure 4 |
Figure 5 |
Figure 6 |
|
| |
References
|
- C. Haworth, A. Hepplestone, P. Morris Jones, R. Campbell, D. Evans, M. Palmer, “Routine Bone Marrow Examination in the Management ofAcute Lymphoblastic Leukemia of childhood,” Journal of Clinical Pathology, 34: 483 – 485, 1981.
- H. T. Madhloom, S. A. Kareem, Department of Artificial Intelligence, “A Robust Feature Extraction and Selection Method for the recognitionof Lymphoblastic Leukemia,” International Conference on Advanced Computer Applications and Technologies, 2012.
- R. D. Labati, V. Puri, Fabio Scotti, “ALL-IDB: The Acute Lymphoblastic Leukemia Image Database For Image Processing,” IEEE, DOI:10.1109/ICIP 2011.6115881, 2011.
- B. J. Bain, “A Beginners Guide to Blood Cells,” Blackwell Publishing, 2nd edition, 2004.
- Ritter N, Cooper J, “Segmentation and border identification of cells in images of blood smear slides,” In proceedings of the Thirtieth Australasian Conference on Computer Science 62:161-169, 2007.
- Ongun G, Halisi U, Leblebicioglu K, Atalay V, Beksac M, Beksac S, “An automated differential blood count system,” Engineering in Medicine and Biology society, Proceedings of the 23rd Annual International Conference IEEE, 2001.
- Kan Jiang, Qing-Min Liao, Sheng-Yang Dai, “A novel white blood cell segmentation scheme using scale-space filtering and watershedclustering,” International Conference on Machine Learning and Cybernetics, 2003.
- Dorini LB, Minetto R and Leite NJ, “White blood cell segmentation using morphological operators and scale-space analysis, Proceedings ofthe XX Brazilian Symposium on Computer Graphics and Image Processing, 2007.
- Scotti F, “Automatic morphological analysis for acute lymphoblastic leukemia identification in peripheral blood microscope images,” IEEEInternational Conference on Computational Intelligence for Measurement Systems and Applications, 2005.
- Kumar BR, Joseph DK, Sreenivas, TV, “Teager energy based blood cell segmentation,” IEEE 14th International Conference, 2002.
- Cseke, “A fast segmentation scheme for white blood cell images,” In International conference of Image, Speech and Signal Analysis, 1992.
- Otsu, N, “A Threshold Selection Method from Gray – Level Histograms,” IEEE Transactions on Systems, Man, and Cybernetics, vol.9, No.1,pp. 62 – 66, 1979.
- C. Haworth, A. Hepplestone, P. Morris Jones, R. Campbell, D. Evans, M. Palmer, “ Routine Bone Marrow Examination in the Managementof Acute Lymphoblastic Leukemia of childhood”, Journal of Clinical Pathology, 34: 483 – 485, 1981.
- B. J. Bain, “A Beginners Guide to Blood Cells,” Blackwell Publishing, 2nd edition, 2004.
- http://en.wikipedia.org/wiki/Blood.
- A. K. Jain, “Fundamentals of Digital Image Processing, Pearson Education,” 1st Indian edition, 2003.
- Otsu, N, “A Threshold Selection Method from Gray – Level Histograms,” IEEE Transactions on Systems, Man, and Cybernetics, vol.9, No.1,pp. 62 – 66, 1979.
- William K. Pratt, “Digital Image Processing,” 4th edition, 2007.
- Gonzalez, R. C, Woods, R.E, “Digital Image Processing Using MATLAB,” Prantice Hall Publications, 2002.
- The Wikipedia the Free Encyclopedia Website, http://en.wikipedia.org.
|