Keywords
|
| Data Acquistion using LabVIEW, Control of Process Variables using Labview. |
INTRODUCTION
|
| LabVIEW [1],[10] is a graphical programming language that uses icons instead of lines of text to create applications. In contrast to text-based programming languages, where instructions determine program execution, LabVIEW uses dataflow programming, where the flow of data determines execution order. LabVIEW also includes several wizards to help you quickly configure your DAQ devices and computer-based instruments and build applications. In LabVIEW, you build a user interface by using a set of tools and objects. The user interface is known as the front panel. You then add code using graphical representations of functions to control the front panel objects. The block diagram contains this code. In some ways, the block diagram resembles a flowchart. Users interact with the Front Panel when the program is running. Users can control the program, change inputs, and see data updated in real time. Every front panel control or indicator has a corresponding terminal on the block diagram. When a VI is run, values from controls flow through the block diagram, where they are used in the functions on the diagram, and the results are passed into other functions or indicators through wires. |
MEASUREMENT OF PROCESS VARIABLES
|
| The process variables [3] such as Temperature, Pressure, Flow and Level are monitored using corresponding sensors and the corresponding values are controlled from LabVIEW. The various processes variables are discussed below. |
| TEMPERATURE: Temperature control is important for separation and reaction processes, and temperature must be maintained within limits to ensure safe and reliable operation of process equipment. Temperature can be measured by many methods; several of the more common are described in this subsection. The temperature sensor is protected from the process materials to prevent interference with proper sensing and to eliminate damage to the sensor. Thus, some physically strong, chemically resistant barrier exists between the process and sensor; often, this barrier is termed a sheath or thermowell, especially for thermocouple sensors. An additional advantage of such a barrier is the ability to remove, replace, and calibrate the sensor without disrupting the process operation. |
| THERMOCOUPLES: When the junctions of two dissimilar metals are at different temperatures, an electromotive force (emf) is developed. The cold junction, referred to as the reference, is maintained at a known temperature, and the measuring junction is located where the temperature is to be determined. The temperature difference can be determined from the measured emf. The relationship between temperature difference and emf has been determined. |
| RESISTANCE TEMPERATURE DETECTORS (RTD): The electrical resistance of many metals changes with temperature; metals for which resistance increases with temperature are used in RTDs [6]. Temperature can therefore be determined from the change in the electrical resistance of the metal wire according to Effect of Temperature on Resistance |
| RT = RT0 (1 + α T) |
| RT the resistance, |
| RT0 the resistance at base temperature of 0 °C, |
| T the temperature of the sensor (to be determined from RT) and α the temperature coefficient of the metal. |
| This linear relationship sometimes provides sufficient accuracy, but nonlinear correlations are available for higher accuracy (Omega, 1995). RTDs are commonly used for applications in which higher accuracy than provided by thermocouples is required. |
| LEVEL: In industry, liquids such as water, chemicals, and solvents are used in various processes. The amount of such liquid stored can be found by measuring level of the liquid in a container or vessel. The level affects not only the quantity delivered but also pressure and rate of flow in and out of the container. [4] Level sensors detect the level of substances like liquids, slurries, granular materials, and powders. The substance to be measured can be inside a container or can be in its natural form (e.g. a river or a lake). The level measurement can be either continuous or point values. |
| PRESSURE: A pressure sensor measures pressure typically of gases or liquids. Pressure is an expression of the force required to stop a fluid from expanding, and is usually stated in terms of force per unit area. A pressure sensor usually acts as a transducer; [2] it generates a signal as a function of the pressure imposed. For the purposes of this article, such a signal is electrical. |
| DIFFERENTIAL PRESSURE SENSORS: This sensor measures the difference between two pressures, one connected to each side of the sensor. Differential pressure sensors are used to measure many properties, such as pressure drops across oil filters or air filters, fluid levels (by comparing the pressure above and below the liquid) or flow rates (by measuring the change in pressure across a restriction). Technically speaking, most pressure sensors are really differential pressure sensors; for example a gauge pressure sensor is merely a differential pressure sensor in which one side is open to the ambient atmosphere. |
| FLOW: Flow rate is complex and it is difficult to measure the quantity. There is no principle to measure flow directly. The reduction of pressure in a fluid flow is measured by differential pressure transmitter. We will be able to find the flow rate by extracting the square root of the differential pressure [4]. Differential pressure flow meters have a primary and a secondary element. The primary element in the form of orifice plate, venturi, and flow nozzle will produce a change in the kinetic energy of the flow. This change in kinetic energy will create differential pressure. The secondary unit will measure this differential pressure and provide an electrical signal for transmission to a remote process control instrument. |
MONITORING PROCESS VARIABLES IN LABVIEW
|
| The various process variables discussed above are monitored from the plant and given as the input parameters to the LabVIEW VI through Data Acquisition System. The block diagram shown in Fig.1.gives the details of monitoring and controlling of Temperature process station using LabVIEW |
| The variables are compared with the set point and required controller algorithm is developed, the control or the error signal is sent back to the plant to control the process variables through COMPAQ DAQ. Here in this paper it is discussed how temperature in a process or plant is measured and controlled by ON-OFF Controller. |
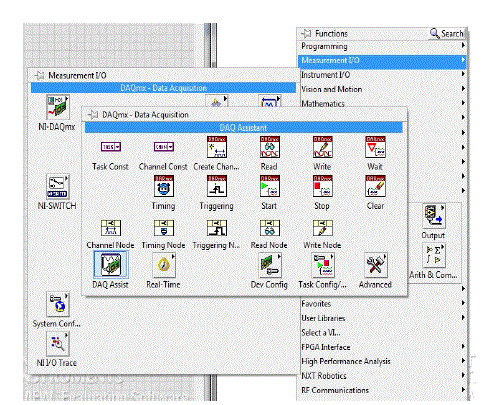
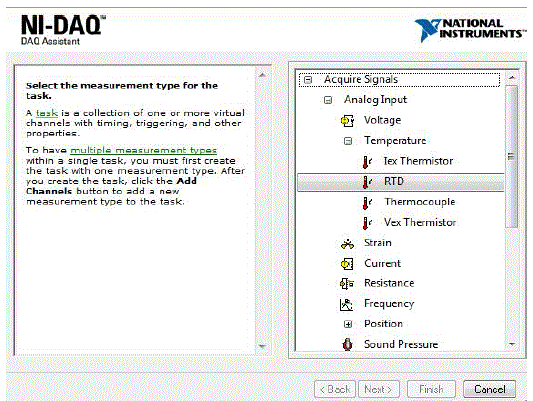
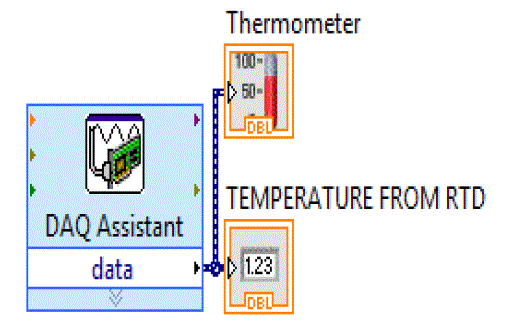
| LabVIEW VI is divided as two windows viz., Front Panel window which has all the input and Output variables. The inputs may be control and the output may be an indicator namely graphical indicator, numerical indicator or simply true or false case. The temperature sensor RTD (3-wire) is connected to the Analog Input Module of NI 9219, the module is configured in VI by using DAQ Assistant. The temperature measured is compared with the set point in the LabVIEW and necessary control action is taken. Fig.2.(a) & Fig.2(b). Shows the configuring the DAQ Assistant in Labview The front panel and block diagram for the process is shown in Fig.3. The NI cDAQ-9174 is a 4- slot NI Compaq DAQ USB chassis designed for small, portable, mixed-measurement test systems. Analog Input Module NI9219 is used to detect the analog signal (Temperature) from RTD |
MEASURING TEMPERATURE WITH RTDs
|
| All RTDs usually come in a red and black or red and white wire-color combination. The red wire is the excitation wire and the black or white wires are ground wires. If you are not sure which wires are connected to which side of the resistive element, you can use a digital multimeter (DMM) to measure the resistance between the leads. If there is close to 0 Ω resistances, then the leads are attached to the same node. If the resistance is close to the nominal gage resistance (100 Ω is a common RTD nominal gage resistance), then the wires you are measuring are on the opposite side of the resistive element. In addition, reference the RTD specification to find the excitation level for that particular device. Most instruments offer similar pin configurations for RTD measurements. The following example demonstrates an RTD measurement using an NI CompactDAQ chassis and the NI 9219 Analog Input Module. |
| An RTD [6],[8] is a passive measurement device; therefore, you must supply it with an excitation current and then read the voltage across its terminals. You can then easily transform this reading to temperature with a simple algorithm. To avoid self-heating, which is caused by current flowing through the RTD, minimize this excitation current as much as possible. There are essentially three different methods to measure temperature using RTDs. |
TWO-WIRE – RTD SIGNAL CONNECTION
|
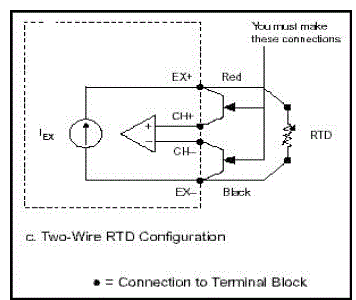
| Connect the red RTD lead to the excitation positive. Place a jumper from the excitation positive pin to the channel positive on the data acquisition device. Connect the black (or white) RTD lead to the excitation negative. Place a jumper from the excitation negative to the channel negative on the data acquisition device. |
| In the two-wire method, the two wires that provide the RTD with its excitation current and the two wires across which the RTD voltage is measured are the same. The easiest way to take a temperature reading with an RTD is using the two-wire method; however, the disadvantage of this method is that if the lead resistance in the wires is high, the voltage measured, VO, is significantly higher than the voltage that is present across the RTD itself. |
CONTROLLING IN LABVIEW
|
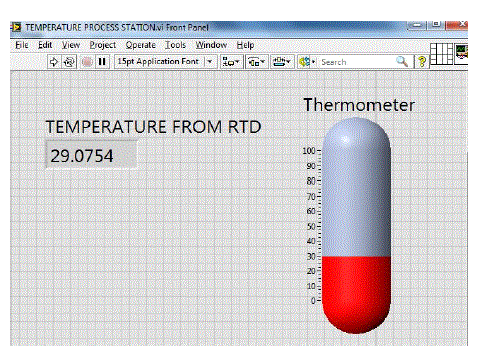
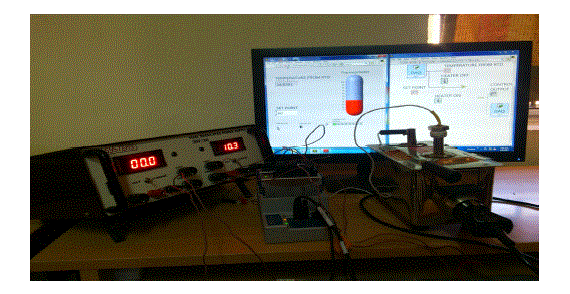
| Once the Physical set up is made the room temperature is measured from the RTD and the interface of RTD temperature sensor with DAQ is shown in Fig 7(a) and Fig.7(b), depending on the application, the suitable controller is designed [3][7][9]. Here we have shown how to design a simple ON- OFF Controller in LabVIEW. |
DESIGN OF ON-OFF CONTROLLER
|
TURNING OFF THE HEATER
|
| Here ON-OFF controller is designed, ie the temperature of the fluid is measured using RTD through DAQ and it is compared with the set point. If the fluid reaches the desired temperature the heater is turned off by a relay switch.(Electrical Relay). Fig. 8(a) shows the LabVIEW setup for turn OFF the relay. |
| The temperature of the fluid is low compared with the desired temperature then signal from the VI is generated to activate the relay switch to turn it ON, as well as to turn OFF. Fig. 8(b) shows the LabVIEW setup for turning ON the relay. |
CONCLUSION
|
| Here in this paper, the simple ON-OFF controller is designed in LabVIEW for Temperature Measurement. The sensor used is RTD[7]. This work can be extended to all other process variables (Level, Flow, Pressure, etc.) and also other types of controller like P, PI, PID can be designed using LabVIEW and its corresponding modules. This can also be used in higher process stations in various industries using LabVIEW by its corresponding modules. |
Figures at a glance
|
 |
 |
 |
 |
 |
| Figure 1 |
Figure 2a |
Figure 2b |
Figure 3 |
Figure 4a |
 |
 |
 |
 |
| Figure 4b |
Figure 5a |
Figure 5b |
Figure 6 |
|
References
|
- Jevoitha Jerome, “Virtual Instrumentation Using LabVIEW”.
- Terry Bartelt “Process Control System and Instrumentation” , ISBN – 13:978-81-315-0772-8
- George Stephanopoulos, “Chemical Process Control – An Introduction to Theory and Practice”, ISBN – 978-81-203-0665-3
- B. Wayne Bequette., “Process Control Modelling Design and Simulation”, ISBN – 978-81-203-2265-3.
- AsanGani and M.J.E. Salami “A LabVIEW based Data Acquistion System for Vibration Monitoring and Analysis”
- D. Patranabis, “Instrumentation and Control”, ISBN - 978-81-203-4246-0.
- Hasim, N.; Basar, M.F.; Aras, M.S., "Design and development of a water bath control system: A virtual laboratory environment," Research and Development (SCOReD), 2011 IEEE Student Conference on , vol., no., pp.403,408, 19-20 Dec. 2011.
- Wenlian Li; Yang Li; Fan Xiao, "The design and implementation of digital temperature measurement and automatic controlsystem," Computer Application and System Modeling (ICCASM), 2010 International Conference on , vol.10, no., pp.V10-407,V10-409, 22-24Oct. 2010
- Koprda, S.; Turcani, M.; Balogh, Z., "Modelling, simulation and monitoring the use of LabVIEW," Application of Information andCommunication Technologies (AICT), 2012 6th International Conference on , vol., no., pp.1,5, 17-19 Oct. 2012.
- Santori, M., "An instrument that isn't really (Laboratory Virtual Instrument Engineering Workbench)," Spectrum, IEEE , vol.27, no.8,pp.36,39, Aug. 1990
|