ISSN ONLINE(2319-8753)PRINT(2347-6710)
ISSN ONLINE(2319-8753)PRINT(2347-6710)
Ramesh Bhat1, Meenu S2, Nayanatara AK3, DeviprasadS4 and Ganaraja B5
|
| Related article at Pubmed, Scholar Google |
Visit for more related articles at International Journal of Innovative Research in Science, Engineering and Technology
Anthropometric parameters and nutrition have been well correlated in a number of studies. But Anthropometric data did not always give the accurate picture of health in communities. In the present study we evaluated the Mini Nutritional Assessment (MNA) score and correlated the outcome with the Waist to Hip ratio (W/H ratio), Body mass index (BMI) in Young subjects and elderly subjects. In the present study we evaluated 240 Young subjects (120 males and 120 females; aged 21±2 years) and 221 elderly subjects (105 males and 116 females; aged 55±5 years). Their BMI was calculated and Waist –to-Hip ratio was recorded. MNA was evaluated by giving them the standard questionnaire. A careful analysis of results suggested that the MNA scores were higher in younger groups compared to older group (p<0.01). In Females, W/H ratio was significantly higher in older group (p<0.01). In males, the W/H ratio was not showing any significant difference. Among males, BMI was higher in younger group in all categories (p<0.01). Therefore BMI was well correlated with the MNA scores in males. In females, the waist to hip ratio was significantly increased in elderly; their body mass index was lower among older group. MNA score followed a similar trend in both groups. Thus it appears that aging process in females differs from that in males.
Keywords |
| Waist – Hip ratio, MNA score, Body Mass Index, Elderly subjects, Young subjects. |
INTRODUCTION |
| American Medical Association declared Obesity as a disease rather than a condition. It has been identified as problem which has the potential to cripple the world as an estimated over 2 billion people in developed and developing world could be obese by 2020. [1] Obesity has the potential to lead to asymptomatic coronary arterial disease and metabolic syndrome. [2,3] Baalwa et al. reported increasing trend in obesity in Uganda. [4] Reports suggested that more than half of the population in Canada was overweight and One in four were obese and the rate is increasing even among children. [5] Canadian Medical Association journal suggested that one in ten deaths could be attributed to obesity related complications [6] Prevalence of obesity is 30% among Americans (NHANES) [7, 8] A recent study suggested that obesity related disorders reduced ‘life years’ and the loss is more in younger individuals [9] Adiposity could be better predictor of obesity than the BMI Body fat is associated with metabolic syndrome. Subjects who have normal BMI, but have more body fat, are at a higher risk of cardio-metabolic dysregulation and cardiovascular mortality. Normal weight obesity was defined as subjects with a normal BMI (18.5–24.9 kg/m2) and an excess in BF%, defined by the highest sexspecific tertiles of BF% (23.1% in men and 33.3% in women). [7] |
| De Lorenzo et al.[10] reported that 28 women with high Body Fat (BF) had a significantly lower resting metabolic rate and oxygen consumption, when compared with 20 women with normal BMI and no excess in Body Fat. Furthermore, in a similar group of women it was noted that plasma levels of several inflammatory biomarkers, including interleukins, and C-reactive protein were significantly higher in women with a normal BMI but high BF content, supporting the concept that subjects with Normal Weight Obesity may be predisposed to develop metabolic syndrome and cardio vascular diseases. [11]Obesity has been reported more commonly in females compared to males in south India too, and correlated with the MNA score [12]. Mini Nutrition Assessment score has been used in several studies for reliable estimation of nutritional status in communities, since it was introduced in 1994. [13] It scores the statements and grades the nutritional status of individual as well nourished, risk for under-nourishment and malnourished according to their responses to questionnaire [14] Though there is no gold standard in assessment of Nutritional status, MNA is useful in assessment of nutritional status and this could be correlated with anthropometric parameters such as Lean Body Mass, BMI, Waist – hip ratio to evaluate general well-being of the individual. In the present study, we evaluated the BMI, Waist Hip Ratio and correlated with the MNA scores in two groups of subjects namely, young and elderly, in South India. |
II. MATERIALS AND METHODS |
| A. Sample Size: This cross sectional study was conducted in Mangalore, South India, a total of 240 young medical students in the age group of 21±2 years (120 males & 120 females) were taken as young group. Another 221 Elderly subjects above the age of 50 years (105 males and 116 females) were randomly selected in Mangalore city named as Elderly group. B. Grouping: The total subjects were were divided (males & females separately) into 4 groups as per WHO classification according to BMI (Quetelets index) [15] 1. < 18.5 Underweight (UW) 2. 18.5 – 24.9 Normal weight. (N) 3. 25 – 29.9 Overweight. (OW) 4. > 30 Obese (OB) |
| C. Inclusion Criteria: Subjects of this study will be male and female young adults of age 18-22 years; Elderly Subjects over 55 ± 5years of age were included in elderly group in this study. D. Exclusion Criteria: History of congenital heart diseases, thyroid disorders. Pregnant women, Smokers, alcoholics and drug abusers, Diabetes mellitus, Subjects on antihypertensive, and those receiving artificial enteral or parenteral nutrition also were excluded. List of parameters studied: A) Anthropometric parameters: 1. Height 2.Weight 3. Body Mass Index 4. Waist- hip ratio (W/H) B) MNA Score E. Anthropometry: Height and weight of all the subjects were measured and their Body mass index (BMI) were calculated. Waist and hip circumferences were also measured and W/H ratio calculated. Waist-Hip ratio>9.5 in men and >0.85 in women have a greater risk of stroke, coronary artery disease and diabetes mellitus 15.Accordingly the W/H ratio of the subjects were divided into normal or at risk groups. F. Mini Nutritional Assessment- Using -Mna Score: The test involves (1) Anthropometric assessment (weight, height, weight loss)(2) General assessment (six questions related to lifestyle, medication and mobility) (3) Dietary assessment (eight questions related to number of meals, food and fluid in-take, and autonomy of feeding); and (4) Subjective assessment (self- perception of health and nutrition). The test did not require any modification to be applied in the study population. A score was given to each subject on the basis of MNA questionnaire. The scoring categorizes the subjects in the following manner: >23.5 - satisfactory nutritional status 17-23.5-at risk of malnutrition < 17 -malnutrition G. Statistical Analysis: The statistical analysis was done by using SPSS (Statistical Package for Social Sciences) version 11.5. ANOVA (Analysis of variance), Student’s Unpaired ‘t’ test was used to compare different BMI sub-groups between young group and Elderly group. (p value < 0.05 was considered to be statistically significant). Informed consent: Written informed consent from all the subjects was taken. Ethical clearance: Approval from Institutional Ethics Committee was obtained before conducting the study. |
III. RESULTS |
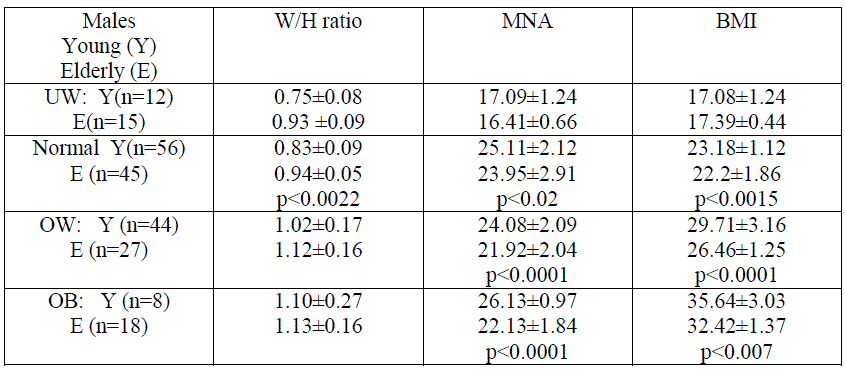
| Among the male subjects, average BMI in Younger Group was higher compared to Older group in Normal, OW & obese groups. (p<0.01) There was no significant difference in BMI in Normal and underweight subjects. Even though there was no statistically significant increase in W/H ratio in Older group compared to Younger group W/H ratio was higher in older group. MNA Score also was significantly higher inand younger group compared to elderly group of OW and OB subjects. TABLE I: Comparison of Anthropometric parameters and MNA score among Underweight (UW), Normal (N), Overweight OW) and Obese (OB) young male subjects (n=120) Vs elderly male subjects (n=105).UW = Underweight; OW = Overweight; OB = Obese; Y= Young; E = Elderly.Values Mean ±SD; p<0.05 significant(S), p < 0.01; highly significant, p<0.001 very highly significant. |
 |
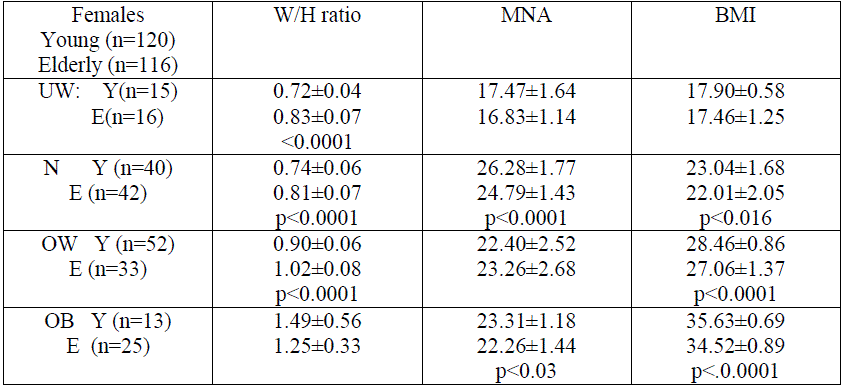
| TABLE II: W/H ratio, MNA score and BMI in Underweight (UW), Normal (N), Overweight OW) and Obese (OB) young female subjects (n=120) and elderly female subjects (n=116). UW = Underweight; OW = Overweight; OB = Obese; Y= Young; E = Elderly.Values Mean ±SD; p<0.05 significant, p < 0.01; highly significant, p <0.001 very highly significant. |
 |
| Average BMI in Younger female group was significantly higher compared to Older group except in Underweight group. The difference was more in OW and OB. Waist to hip ratio was seen to be higher in Older UW, Normal & OW group compared to Younger group. MNA score showed a significant increase in Normal & Obese groups compared to older group and did not show any significant difference in UW & OW groups. Both young & elderly OW & Obese groups & young UW belonged to Risk of Malnutrition whereas old UW group belonged to Malnutrition group. Both young & old normal subjects belonged to satisfactory nutrition group. |
IV. DISCUSSION |
| Many physiological changes take place in individuals over a period of time, which is the natural process of aging. Therefore the nutritional assessment with the help of MNA scores and measuring anthropometric parameters may provide very useful information of the health risks. It is evident that both under nourishment or over nourishment could lead to clinical problems. [16] In our study, we compared the nutritional assessment correlated with the BMI, Waist to hip ratio, in groups of young male and female subjects and old people in South India. MNA scores varied in Normal, underweight, overweight and obese groups in line with the known standards. (12) The values were significantly higher in overweight in obese subjects and it was lower in Underweight subjects (Table 1). However Waist Hip ratio did not show any significant difference among the male groups. We observed a decrease in Body Mass Index (BMI) among the elderly males compared to younger group. This was evident in Normal weight group also (p<0.01). This suggests that there is a shift in BMI as age advances which could be reason for increased metabolic and cardio vascular disorders as age advances. [17] Among the females, waist Hip ratio in young and Old groups, was significantly different (p<0.01) in all groups except Obese group. (Table 2) Unlike males, the W/H ratio was higher in older women compared to younger women in all groups. This suggested the older women are more susceptible for obesity related metabolic syndrome, so also the cardiovascular disorders. In males, possibly because the presence of androgens this type of difference is not observed (18). MNA score was significantly different among normal weight women of young and older age group. It has been established that in spite of having normal body weight and other parameters, MNA score could reflect the risk of malnutrition. (19) Therefore it appears that there are more factors involved in the physiological changes in elderly women as opposed to men. Malabsorption could cause malnutrition in elderly subjects. (20) Sedentary lifestyles and body fatness which contribute morbidity in elderly subjects could be ameliorated by increasing exercise and activity level (21) |
CONCLUSIONS |
| Waist to hip ratio in males and females showed different trends. Older age group females had a higher W/H ratio. MNA score and the BMI showed a clear correlation in the study groups. This evidence suggested that the aging process in males and females showed a divergent pattern in body fat distribution. |
References |
|