ISSN ONLINE(2319-8753)PRINT(2347-6710)
ISSN ONLINE(2319-8753)PRINT(2347-6710)
| Sandeep Rathod1, Nitin Gavankar2, Department of Computer Science and Engineering, Walchand College of Engineering, Sangli, Maharashtra, India |
| Related article at Pubmed, Scholar Google |
Visit for more related articles at International Journal of Innovative Research in Science, Engineering and Technology
The hyperspectral images have very huge number of pixels which stores the reflection of the light beam from the surface of materials or objects. Spectral reflectance variations in the reflectivity of earth surface materials across different wavelength spectral bands provide a fundamental mechanism for understanding features in remotely-sensed multispectral or hyperspectral images. Pixel in such images is mixed pixel because of its spatial resolution. A spectral unmixing is performed on mixed pixels, contain a linear mixture of pure reflectance ground surface materials or objects called as endmember weighted by a correspondent abundance fraction. Vertex Component Analysis (VCA) is a well-known endmember extraction method with a benefit of less computational complexity.
IndexTerms |
| Hyperspectral Image, Spectral Unmixing, Dimensionality Reduction, Endmember, Endmember Extraction, Vertex Component Analysis |
INTRODUCTION |
| The numbers of Satellites are launched for Remote Sensing and Earth Observation purpose. The Satellite mounted sensor captures data in the form of multispectral or hyperspectral images and measures electromagnetic reflection of the material within each pixel area. For any object, this data is based on the electromagnetic reflection from that particular object, absorbed by that particular object [1]. An Electromagnetic properties vary with wavelength range (visible range – 0.4 to 0.7μm, infrared – 0.7 to 2.5μm). The satellite includes unique capabilities to monitor specific earth surface at low cost and in less time while actual earth surface monitoring is costly and time consuming and also it includes the human error in reading ground truth. |
| Images are the most important source of data and information in the object detection. The use of image processing techniques has great significances for object analysis and information extraction. The Multispectral or Hyperspectral image contains a number of spectral bands. Each band measures an electromagnetic reflection of that particular object and displays a gray scale or color (RGB) image. |
| The remote Sensing term is related to the gathering object information about area, object characteristic and object dimension without making contact with object [4]. We know that, many remote sensing technique measures electromagnetic energy over several separate wavelength range of various spectral resolutions. [2] (Remote Sensing) stated as âÃâ¬Ãâ¢any process whereby information is gathered about an object, area or phenomenon without being in contact with itâÃâ¬Ãâ. Our eyes are an excellent example of a remote sensing device. We are able to gather information about our surroundings by gauging the amount and nature of the reflectance of visible light energy from any external source(such as the sun or a light bulb) as it reflects off objects in our field of view [2]. |
| Hyperspectral Image sensor measures the different signals reflected from object ground or earth surface cover. Therefore, single pixel contains the mixture of different signal or object and pixel weighted by their fractional |
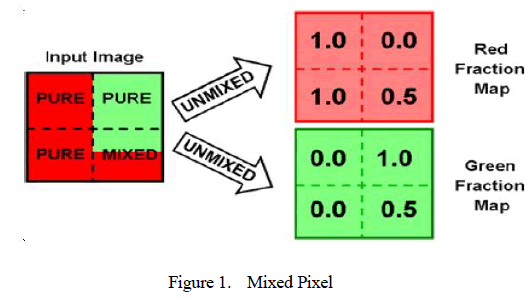 |
| abundance. Figure 1 shows a mixed pixel is formed because one of two reasons. First, if the spatial resolutionof an imaging sensor is low enough such that adjacent endmembers can jointly occupy a single pixel. Second, the resulting spectral measurement will be a composite of the individual endmembers [6]. Spatial resolution defined as an area of the earth's surface represented by a single pixel in an image. The meaning of high spatial resolution means each image pixel represents a small square of earth surface size [7]. Spectral Resolution is the width of the electromagnetic rangeof a sensor will detect. |
| An extraction of pure signal from the pixel is referred as an Endmember Extraction Process. A common problem with such satellite images is the wide existence of mixed pixels means within pixel more than one type object reflectance is present. Thus, the measured spectrum of a single pixel is a mixture of several ground cover object spectra known as endmembers, weighted by their fractional abundances. Endmember is a pure signal of a unique object or material. To utilize measured hyperspectral data, it has to decompose these mixed pixels into a set of endmembers signature and weighted their fraction, indicate the proportion of eachendmember present in the pixel. This process is called Spectral Unmixing or Mixed Pixel Decomposition, it involves two steps: first is endmember signature computation and the second is a fraction of endmember in pixel estimation [5] [6]. A low numbers of spectral bands in multispectral sensors (usually a dozen or fewer) have proved sufficient to provide classification maps for large scenes with numerous applications to agriculture, forestry, oceanography, and environmental management and protection. As electro-optical remote sensing has evolved, hyperspectral sensors have been developed with hundreds of spectral bands with a significantly improved spectral resolution. The ability of spectral unmixing to identify the constituent components of a pixel is a particularly important new application of these sensors [6]. |
| Endmember extraction processed designed under pure pixel assumption means the input hyperspectral image contain at least single pure for each distinct object present on earth ground surface. Numbers of techniques are developed for endmember extraction processes such as Independent Component Analysis (ICA) [13], Pixel Purity Index (PPI) [10], N-Finder [11], Vertex Component Analysis (VCA) [12], Minimun Volume Enclosing Simplex (MVES) [19], Nonnegative-Matrix-Factorization (NMF) [5], and Minimum-Volume Simplex Analysis (MVSA) [21]. The independent component analysis (ICA) of a random vector consists of searching for a linear transformation that minimizes the statistical dependence between its components. Independent component analysis (ICA) [13] is an unsupervised unmixing process and Independent Factor Analysis (IFA) [13] developed for recovering hidden source data from an observed input mixture. The goal of ICA is to extract independent sources, given only by sensor observations that are unknown linear mixtures of the unobserved independent sources. ICA assumed each pixel is a linear mixture of endmember signatures weighted by the correspondent abundance fractions and these abundances are independent. ICA uses two assumptions: 1) input data spectrum is a linear mixture of endmember matrix and weighted by correspondent abundance fractions of endmember. 2) Input data are statistically independent. The first assumption is valid when the multiple scattering take place among the distinct endmembers is considered as negligible and the surface area is partitioned according to the fractional abundances of endmember. The second assumption is not valid due to physical constraints on the data acquisition process [13]. |
| Minimum - Volume Enclosing Simplex (MVES) is based on cyclic minimization procedure and uses convex analysis approach. Author [19] proposed a convex analysis based algorithm, for hyperspectral unmixing without involving pure pixels using affine hull and convex hull. First, it performs dimension reduction of the observed pixels through an affine set fitting, and then employs Craig’s unmixing criterion to formulate the hyperspectral unmixing as an MVES optimization problem that finds a simplex by minimizing the simplex volume subject to the constraint that all the dimensions-reduced pixels are enclosed by the simplex. It is based on three assumptions: 1) Abundance is Non Negative, 2) proportional distribution of all endmembers in pixel is unity and 3) involves a large number of image pixels and spectral bands but only a small number of endmembers [19]. |
| Nonnegative-Matrix-Factorization (NMF) finds a set of nonnegative endmebmer (basis vectors) that approximates the original data through linear combinations [5]. For finding endmember location NMF uses two cost functions: 1) measures the approximation error between the observed data and the reconstructions from the estimated endmembers and abundances, 2) minimum volume constraint two forces: the external force (minimizing the approximation error) drives the estimation to move outward of the data cloud; and the internalforce (minimizing the simplex volume) acts in the opposite direction by forcing the endmembers to be as close to each other as possible. But NMF has a drawback that is the existence of local minima due to the no convexity of the objective function and the solution highly depends on the initialization of specific used learning strategies [5]. |
| Pixel Purity Index (PPI) itself does not provide identified endmembers. It generates the maximum more than one dimension most pure pixels which were similar to endmembers. PPI algorithm proceeds by generating a large number of skewers through the number of wavelength band – dimensional data. For each skewer, every data point is projected onto the skewer, and the position along the skewer is noted. The data points which correspond to extreme (or near extreme) in the direction of skewer are identified, and placed on the list. The list grows as more skewers are generated; the number of times a given pixel is placed on this list is also tallied. The pixels with highest tallies are considered the purest and pixel count provides Pixel Purity Index [12] [20]. PPI Produces an approximate endmember set and the non approximated endmember was used for further algorithm processing. |
| N-Finder [11] [22] is an Endmember Extraction Algorithm based on the vertex simplex that yields largest volume whose vertices are specified by purest pixels, procedure finds a simplex of the maximum volume with a given number of simplex vertices act as an endmember. NFinder have several disadvantages of implementation: 1) No specific criterion was provided to calculate endmember, 2) for initialization, it uses randomly generated endmebers, 3) the computational time complexity is large and major disadvantage is 4) due to random initialization, for every separate run it produces a different set of final output endmember [11]. [11] Authors developed Iterative N-FINDR (IN-FINDR) and SuCcessive N-FINDR (SC N-FINDR) where the extended version of the N-Finder Algorithm. |
| The survey paper is structured as follows. Section II briefly describes the problem statement for green surface detection present on the earth's surface (ground). Sections III described the methodology overview and IV gave the survey summary of the suitable algorithm. Section V ends the paper by listing some used references. |
PROBLEM STATEMENT |
| Problem Statement – Objects detection strategies have been changed dramatically over the past years. Any of the improvements have been carried to reduce inputs and maximize benefits in a real world environment. |
| An intensive manual ground survey cannot keep pace (reading speed) with the land use or land coverage over large areas. Due to this reason the land survey procedure become time consuming and more expensive. The calculation of crop field (green surface) helps to detect the how many hector or acre is covered by green surface (crop field). The calculation of crop field (green surface) during different season is required for understanding the intraand inter-annual changes made on the earth's surface. Remotely Sensed Data is mostly used of object Detection, Estimation and Monitoring various parameters and regions. The Remotely Sensed Data provides us systematic spatial and spectral information about ground surface or earth observation. The collected information data is used for estimation and monitoring various objects. |
METHODOLOGY |
| A. Spectral Unmixing |
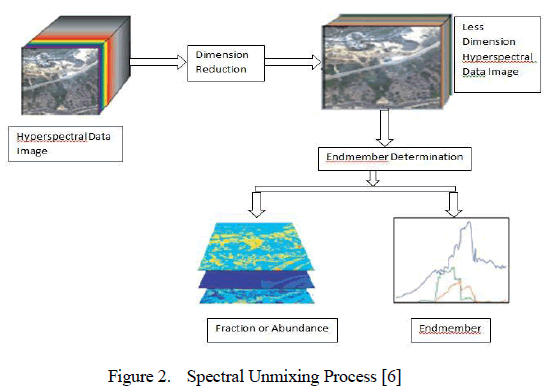
| Hyperspectral spectral unmixing (Figure 2) is to decompose each pixel spectrum to identify and quantify the relative abundance of each endmember present in pixel [18]. Spectral Unmixing problem defined as a sequence of three stages: (1) Dimension Reduction, (2) Endmember Determination, and (3) Inversion. Some spectral unmixing algorithms first reduce the dimension of the data to minimize the corresponding computation. The goal of dimension reduction is to minimize representation of input the signal in a lower-dimensional space. An endmemberdetermination stage estimates the set of distinct spectra (endmembers) that constitute the mixed pixels in the scene. In inversion stage generate abundance map that allows us to estimate the fractional abundances for each mixed pixel from its spectrum and the endmember spectra [6]. The traditional unmixing method considered as all the pixels are mixed with a linear combination of purematerial spectral vectors; from this need to find the fraction ofmaterialpresent in each pixel. A simple fourpixel two-material example can be seen in Figure 1. |
| In hyperspectral Images, the maximum number of materials that can be unmixed is equal to the number of wavelength bands available in the input image, this will not produce good results because linear unmixing process estimates some fraction for each endmember. Due to spatial resolution, physically fitting a hundred objects or materials in a single pixel are not promising technique; in unmixing procedure expect to accurately separate-out the contributions of a hundred materials is even less realistic [8]. |
 |
| B. Linear Spectral Unmixing of Hyperspectral Images |
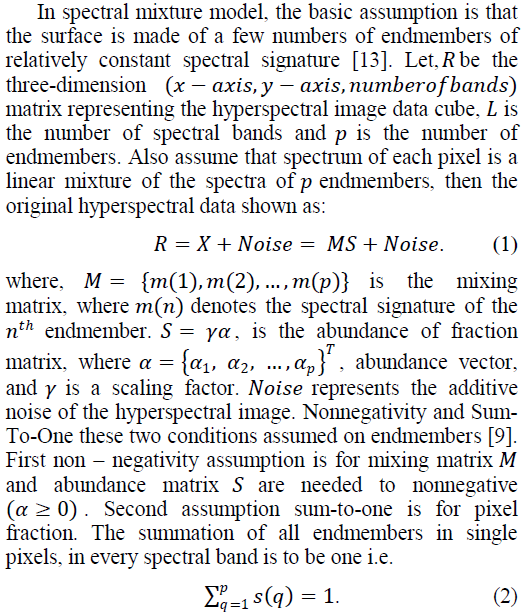 |
| These two assumptions are required for putting limitations on simplex formed by endmembers [9]. For geometrical simplex formation many algorithms are developed like PPI [10], n-Finder [11], VCA [12]. |
| C. Dimensionality Reduction |
| Dimension-reduction algorithms do not reduce the dimension of data; it only reduces the computational complexity of the algorithm [6]. Principal Component Analysis (PCA) [14], Maximum – Noise Fraction (MNF) [15], Singular Value Decomposition (SVD) [16] and Orthogonal Subspace Projection (OSP) [17] are wellknown projection techniques used in remote sensing.PCA, also known as Karhunen–Loéve transform, seeks the projection that best represents data in a least squares sense; MNF seeks the projection that optimizes SNR; and SVD provides the projection that best represents the data in the maximum-power sense [12]. |
| Orthogonal Subspace Projection (OSP) [24] starts by selecting the pixel vector with a maximum length in the scene as the first endmember. Then, it looks for the pixel vector with the maximum absolute projection in the space orthogonal to the space linearly spanned by the initial projected pixel, and labels that pixel as the second endmember. A third endmember is searched by applying an orthogonal subspace projectiontechnique to the original data, where the third endmemberis with the maximum orthogonal projection in the space orthogonal to the space linearly spanned by the first two endmembers. This procedure is repeated for the required number of endmembers[17]. |
| Principal component analysis (PCA) [5] [6] is a technique to reduce the dimensionality of a data set (sample) by finding a new set of variables, smaller than the original set of variables that stores most of the sample's information. PCA is the variable reduction procedure; it uses orthogonal transformation to reduce a set of observed possible correlated variables into a set of linearly uncorrelated variables. The number of principalcomponents is less than or equal to the number of original variables. [23] PCA covers standard deviation, covariance, eigenvectors and eigenvalues. Eigenvector shows how data sets are related along an axis that characterizes data set and eigenvector with the highest eigenvalue is the principle component of the data set. |
| D. Vertex Component Analysis |
 |
 |
 |
SURVEY SUMMERY |
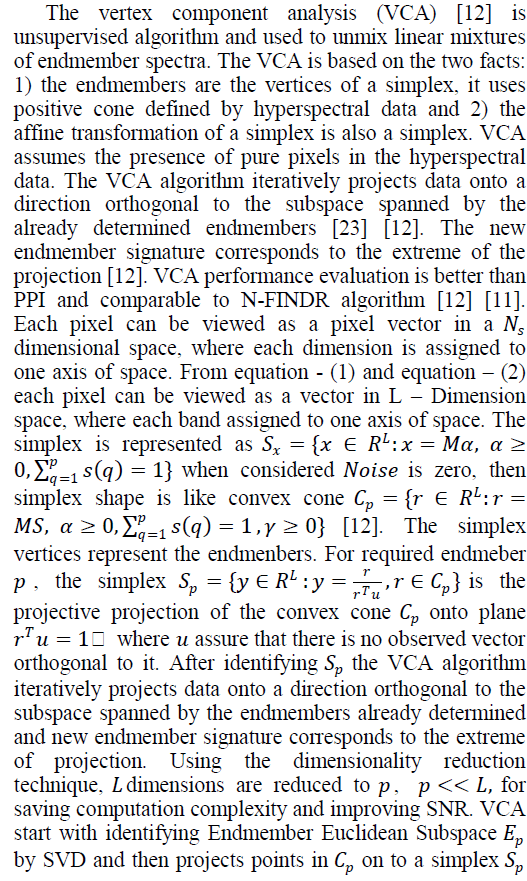
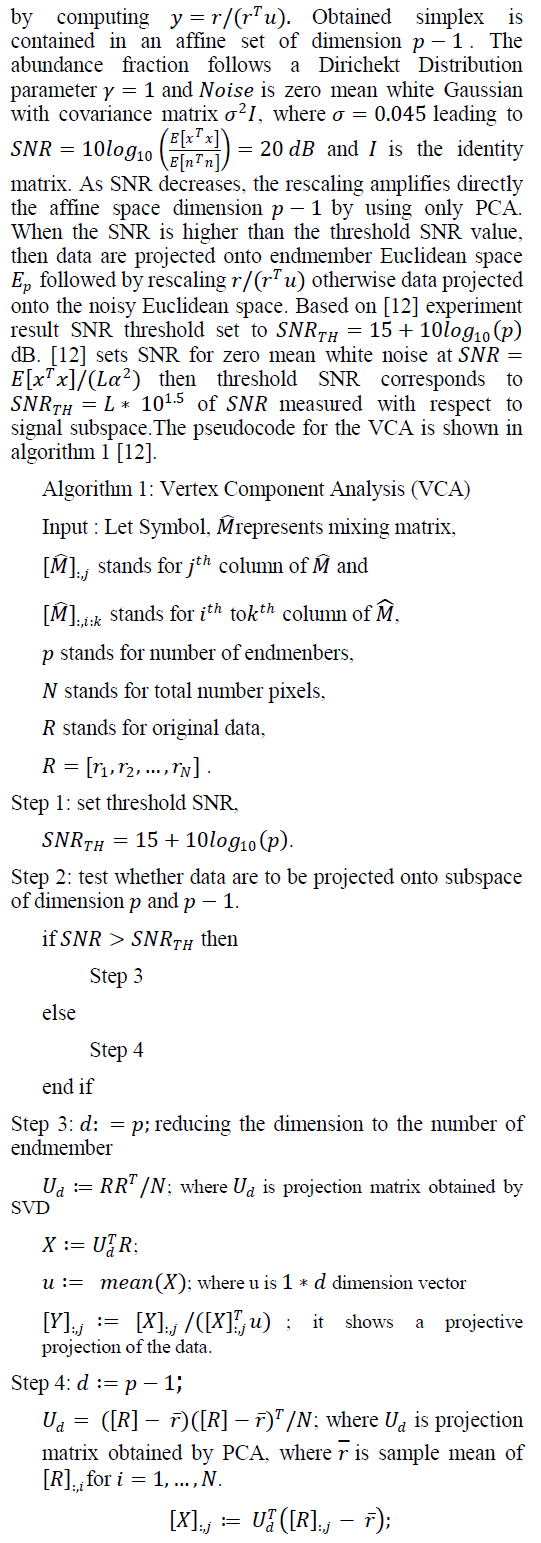
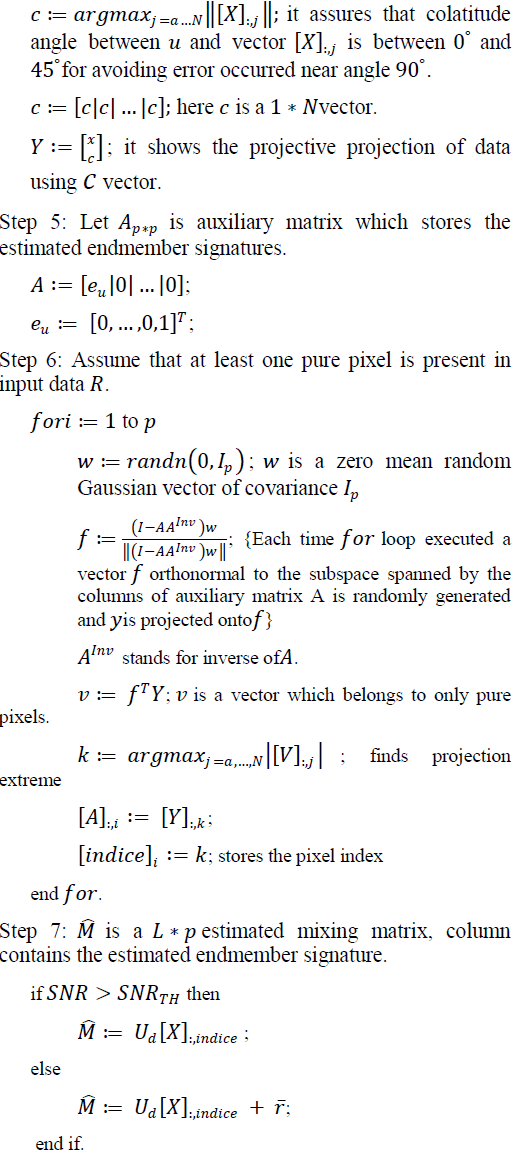
| A linear unsupervised unmixing VCA is based on the fact that endmebers are the vertices of simplex and affine transformation of simplex is also simplex. VCA assumes the presence of pure pixel in hyperspectral data and iteratively projects the data on hyper plane and form a simplex whose vertices act as endmembers. After projecting data on to the selected hyper - plane, VCA algorithm projects all image pixels to a random direction and a pixel with the largest projection considered as first endmenber. This procedure is repeated for identifying other endmebers, which are orthogonal to the subspace spanned by already estimated endmembers. According to [12] performance of VCA is better than or similar to the Pixel Purity Index and N – Finder algorithm. Also, the computational complexity magnitude is lesser than the other two methods. |
References |
|