Keywords
|
| Extraction, sensitivity, specificity, arrhythmia |
INTRODUCTION
|
| The study of ECG signal is extensively used for analysis of heart diseases.ECG is used to measure the rate and regularity of heart beats, the presence of any damage to the heart, and the effects of drugs or devices used to regulate the heart can be identified with the help of study of ECG signal[14]. |
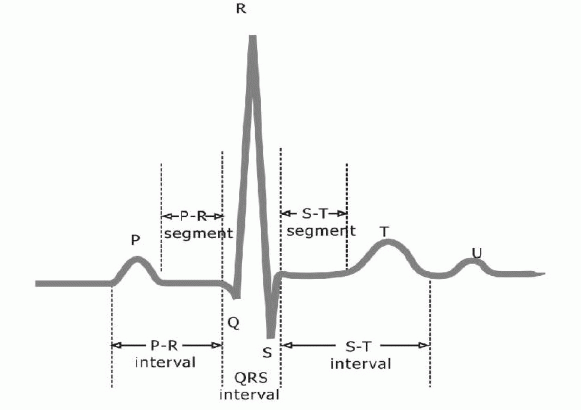
| ECG signals are oscillatory and periodic in nature. A complete ECG beat is shown in Fig.1. It can be seen that the ECG beat has a distinct, characteristic shape. |
| One cycle of ECG signal consists of P-QRS-T wave. The important parameters are peaks amplitude, time duration. So the feature extraction is the main criteria for further processing. Till now various research and methods had been proposed for feature extraction of ECG signal.[15] |
| The various method which have been proposed includes digital signal analysis, MD-TFD[13], InS network, RCE network, ANN [5-8], MLP network [9-12] each method has its own method of extraction.ECG is used for patient monitoring and diagnosis. The extracted feature from the ECG signal plays an important role in diagnosing the cardiac disease. Therefore the significance of feature extraction is very important for the diagnosis of any diseases. |
| There are different techniques which include Fuzzy Logic methods [11], Artificial Neural Network, Hidden Markov Model [16-17], Genetic Algorithm, Support Vector Machines, Self-Organizing Map [18], Bayesian and other methods with each approach exhibiting its own advantages and disadvantages. This paper gives an overview of various techniques and transformations used for extraction of the features from ECG signal. [1]. |
PROBLEM IDENTIFICATION
|
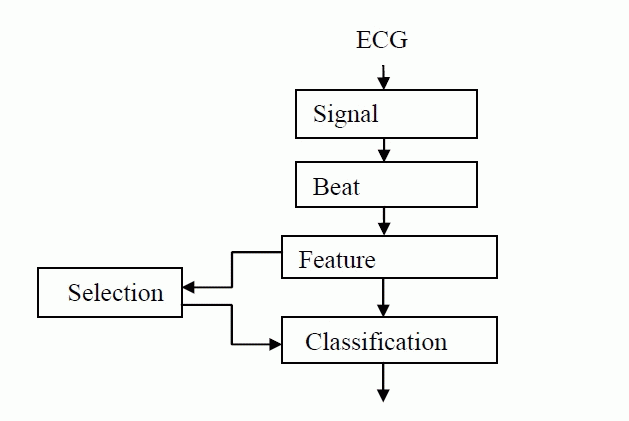
| This is the basic steps used for the classification of any diseases using any of the method as described in Fig .2 [15] |
| ECG is contaminated by various kind of noises like Power line Interference, Electrode contact noise, Motion artifact, Muscle contractions, Baseline Wander etc. Thus it requires some process through which the noises can be removed Depending on the application, the ECG processing have to be done in real time and carried out by a low-voltage lowpower mobile device [19].So filtering techniques has to be implemented for further processing. |
| The feature extraction of the ECG signal, consisting of many characteristics points, can detect the cardiac abnormalities. Therefore, the ECG signal was decomposed into time frequency representations using DWT technique. By applying the signal analysis technique, the most important parameters of the ECG signal can be taken as the analysis data.[20].Then the data will be used as an input to the classifier to identify the heart disease. A number of techniques have been devised by the researchers to detect QRS complex. |
LITERATURE SURVEY
|
Support Vector Machine
|
| S. S. Mehta, and N. S. Lingayat [2] had studied the QRS complex for the detection of disease and they proposed two new methods which is responsible for it success namely, to find a hyperplane which divides samples in to two classes with the widest margin between them, and the extension of this concept to a higher dimensional setting using kernel function to represent a similarity measure on that setting. |
| In this paper they had considered a set |
| (x1,y1).....(x1,y1) |
| Then the decision function is find out with the property- |
 |
| They used the same concept for the detection of ECG signal analysis and arrhythmia classification. They applied SVM only for the detection of QRS complex for single lead ECG by using LIBSVM software. LIBSVM is an integrated software package for support vector classification, regression and distribution estimation. |
| Farid Melgani and Yakoub Bazi [3], proposed a novel classification system based on particle swarm optimization (PSO) which help to improve the efficiency of the SVM classifier. To achieve good performance that had used SVM classifier with kernal filter, they had optimized the SVM classifier design by finding the best value of the parameters that will adjust its discriminant function, and checking for the best subset of features that is used to feed the classifier. They had also used the same technique for multiclass classification. This is not applicable to morphology and temporal features, sensitivity and specificity. |
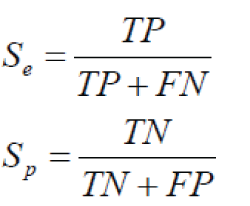
| R. BESROUR, Z. LACHIRI and N. ELLOUZE, in their paper [4] they work on a new method for classification of beats based on the support vector machine classifier using morphological descriptors and High Order Statistic using MIT/BIH Arrhythmia database. In this paper the actually evaluate the performance of the classifier used the two indices are sensitivity and specificity, &e p S S respectively. |
 |
| In this method each QRS beat is separated into two different element vectors. The first element contains 10- morphological descriptor which gives the information of the amplitude, area and specific interval durations. The second element contains 15-subelements.They had applied the SVM classifier to compare the heartbeat classification abilities of the two ECG feature sets. Thus in this way it performed the classification method using SVM. |
Artificial Neural Network
|
| In [5] they discussed about artificial neural network model using morphological classification of heartbeats. The classification of the QRS complex is the main step in their work to detect arrhythmia. They had actually designed a neural network model base on ART. They had explained the structure and general characteristics, different learning capacities that it possesses. They called this new neural network MART (Multichannel-ART). For each channel, the samples of ECG signal they are given as input in the MART in certain time duration and which is thus used for the detection of position of each QRS complex then with the help of algorithm, it dynamically respond to the characteristics to the input ECG signal. |
| In this paper they also find the specificity and sensitivity and thus we classify the accuracy of ovearall system by finding the average detection rate (ADR) by the following formula- |
 |
| Another advantage is MART’S efficiency in the multiplication of morphological classes. |
| In [6] they use classification of QRS complexes in ECG signals using continuous wavelets and neural networks. They uses feedforward neural network for the classification stage with standard back propagation algorithm. The three layer feedforward networks employing the backpropagation (BP) learning algorithm had been implemented. In this paper they firstly computed CWT coefficient then noise level has been is estimated depending upon the threshold value QRS complex is located then after the classification of QRS complex the method is trained by using ANN It can also be trained for normal and abnormal values of QRS. |
| In [7], the classification of seven different parameters of ECG signal is first computed. After that they had examined the patients with certain diseases using their ECG and an Artificial Neural Networks (ANN) classification system. The signal is then classified into normal, abnormal and life threatening signals. Then different features which are extracted from the ECG signal are fed as input to the ANN for classification. The stages used by N Kannathal, U Rajendra Acharya, Choo Min Lim, PK Sadasivan, and SM Krishnan, comprises of 1) preprocessing of the ECG signal,2)extraction of characteristic features and 3) classification using ANN techniques. In preprocessing the noise in ECG signals is removed using band pass filter and applying the algorithm of Van Alste and Schilder (8).in second stages different parameters value are extracted In final stage the network is trained using the values as neural networks derive their power from massively parallel structure and it has the ability to learn from experience This approach gives a superior performance in terms of accuracy. It is easier and simpler to implement and use, as it only requires the ECG signal to determine the patients’ states and find out the disease. |
Multilayer Perceptron
|
| In [9], they had trained network using multilayer perceptron (MLP) and (SOM) network. They design the network for diagnosis up to six different ECG waveforms. It is a three stage model. In first two stages MLP for training and in third stage it has been added for further classification and detection. A preliminary multi-layer perceptron (MLP) classifier was designed to separate three most common ECG waveforms. The third stage is designed to perform a supervised classification on the remaining waveforms, by using an unsupervised classifier such as SOM. |
| The study present in [10] uses MLP with back propagation training algorithm, and new adaptive neural fuzzy filter architecture (ANFF) for the detection of ECG arrhythmia. In the first step of process they used the Daubechies wavelet coefficients as ECG features. In the second step of process they used Daubechies wavelet mid 4th order AR model coefficient as ECG features. In third step of process they used only the fuzzy combination of three wavelets as ECG features. And finally they used fuzzy combination of wavelets mid 4th order AR model coefficient as ECG features. The structure of ANFF uses 5 layers named as Layer 1(Input linguistic nodes); Layer 2(Input term nodes); Layer 3(Rule nodes); Layer 4(Output term nodes); Layer 5(Output linguistic nodes).data has been taken from MIT BIH Database. This new technique ANFF help them to get better results than ordinary MLP architecture. |
| To make the neural network give best result uses fuzzy c-means (FCM) clustering algorithm [11].The fuzzy selforganizing layer are used as preclassification task and multilayer perceptron acts as a final classifier. The fuzzy stage is used to analysis the distribution of data and again making clusters with different membership values. One advantage of this is it reduces the number of segments in training patterns when we use FCM clustering in fuzzy self-organizing layer. |
| [12] In this paper they had studied using an ECG to determine bundle branch block (BBB) which causes the blockage or failure in the heart’s bundle branch. They uses R-waves for their study using highest signal-to-noise ratio information available using R -R interval pattern. The proposed modular neural network has two sub-networks having two hidden layers with differing transfer functions. This study uses a sigmoid activation function as transfer function. |
Morphological Descriptor-Time Frequency Distribution
|
| In [13], they proposed a technique in which they are going to detect the spikes. To detect spikes, they work to attenuate the noise. Two frequency slices of the enhanced time-frequency distribution are then extracted and subjected to the smoothed nonlinear energy operator (SNEO). Finally, the output of the SNEO is threshold to localize the position of the spikes in the signal. The SNEO is employed to accentuate the spike signature in the extracted frequency slices. A spike is considered to exist in the time domain signal if the spike signature is detected at the same POS. |
FUTURE ENHANCEMENT
|
| An ECG is a recording of electrical activity on the body of surface generated by heart. The ECG detection which shows the information of heart and cardiovascular condition to enhance the patient living quality and proper treatment . The future enhancement is to design a evaluation method which helps us to know the accuracy in the value of parameters extracted from any of the methodology. |
CONCLUSION
|
| The above methods are used to extract features of ECG signal. The diagnosis of arrhythmia diseases is been done. All methods find the parameters of ECG signals. MLP method is best among the rest because it determines the hearts bundle branch which is widely used in the diagnosis. |
Figures at a glance
|
 |
 |
| Figure 1 |
Figure 2 |
|
| |
References
|
- Prof .M. N. Zade, Prof. P.M. Palkar, Prof. P. N. Aerkewar, Prof. A. S. Pathan, “Detection of ECG Signal: A Survey,” in International Journal of Artificial Intelligence and Mechatronics Volume 1, Issue 5, ISSN 2320 – 5121.
- S. S. Mehta, and N. S. Lingayat, Member, “Support Vector Machine for Cardiac Beat Detection in Single Lead Electrocardiogram,” IAENG inIAENG International Journal of Applied Mathematics, 36:2, IJAM_36_2_4.
- 3.FaridMelgani, Senior Member, IEEE, and YakoubBazi, Member, IEEE, “Classification of electrocardiogram signals with support vector machines and particle swarm optimization,” IEEE transactions on information technology in biomedicine, vol. 12, no. 5, September 2008.
- R. BESROUR, Z. LACHIRI and N. ELLOUZE, “ECG Beat Classi1fier Using Support Vector Machine Signal,” Image and Pattern Recognition,Research Unit, Electrical department, ENIT BP 37, 1002 Le Belvedere, Tunisia.
- S. Barro , “Classifying Multichannel ECG Patterns with an Adaptive Neural Network,” in IEEE engineering in medicine and biology, January/February 1998.
- BerdakhAbibullaev&Hee Don Seo, “A New QRS Detection Method Using Wavelets and Artificial Neural Networks” in J Med Syst DOI10.1007/s10916-009-9405-3.
- N Kannathal, MSc PhD,1 U Rajendra Acharya, PhD,1 Choo Min Lim, PhD,1 PK Sadasivan, PhD,2 and SM Krishnan, PhD , “Classification ofcardiac patient states using artificial neural networks,” ExpClinCardiol. Winter; 8(4): 206–211,2003. Van Alste JA, Schilder TS, “ Removal of base-line wander and power-line interference from the ECG by an efficient FIR filter with a reducednumber of taps,” IEEE Trans Biomed Eng., 32:1052–60.PubMed.,1985
- H. GholamHosseini , K. J. Reynolds, D. Powers , “A MULTI-STAGE NEURAL NETWORK CLASSIFIER FOR ECG EVENTS.”
- GlayolNazariGolpayegani, Amir HomayounJafari, “A novel approach in ECG beat recognition using adaptive neural fuzzy filter,” J. Biomedical Science and Engineering, 2, 80-85, 2009.
- YükselÖzbaya, RahimeCeylana, BekirKarlikba, “Fuzzy clustering neural network architecture for classification of ECG arrhythmias”ELSEVIER, Computers in Biology and Medicine 36, 376 – 388,2006.
- VSR Kumari& p. Rajesh kumar, “Cardiac arrhythmia prediction using improved multilayer perceptron neural network,” International Journalof Electronics,Communication& Instrumentation Engineering Research and Development (IJECIERD),ISSN 2249-684X,Vol. 3, Issue 4, 73-80, Oct 2013.
- Hamid Hassanpour and BoualemBoashash , “A Time-Frequency Approach For EEG Spike Detection” in Iranica Journal of Energy & Environment 2 (4): 390-395, 2011 ISSN 2079-2115.
- S.Karpagachelvi, Dr.M.Arthanari, Prof.& Head, M.Sivakumar, “ECG Feature Extraction Techniques - A Survey Approach,” (IJCSIS) International Journal of Computer Science and Information Security,Vol. 8, No. 1, April 2010.
- SmitaKasar ,Dr.Madhuri Joshi, “ECG Signal Processing: A Survey”.
- Krimi Samar, OuniKaïs and EllouzeNoureddine, “Using Hidden Markov Models for ECG Characterisation,” ISBN: 978-953-307-208-1,InTech.
- Nicholas P. Hughes, Lionel T arassenko and Stephen J. Roberts, “Markov Models for Automated ECG Interval Analysis”`
- YakupKutlu and DamlaKuntalp, “Feature Reduction Method Using Self Organizing Maps”.
- Romero, L. Serrano, “ECG frequency domain features extraction: A new characteristics for arrhythmias classification.”
- S. Sumathi and M.Y. Sanavullah, “A New Technique of ECG Feature Extraction and Classification by Wavelet Transform and ANFIS”, International Journal of Computational Intelligence Research,ISSN 0973-1873 Volume 6, Number 1 (2010).
|