ISSN ONLINE(2319-8753)PRINT(2347-6710)
ISSN ONLINE(2319-8753)PRINT(2347-6710)
| Annie Thomas1 , Remya James2 |
| Related article at Pubmed, Scholar Google |
Visit for more related articles at International Journal of Innovative Research in Science, Engineering and Technology
Fluoride naturally occurring in ground water and surface water is known to be potent to cause serious dental and skeletal fluorosis in areas where water contains much more than the required amount of fluoride. Aim of this study was to relate the presence of fluoride in water with fresh water fishes of the corresponding aquatic body from which water samples were collected. Three species of fishes Etroplus suratensis (Pearl spot), Oreochromis mossambicus (Tilapia), and Anabas testudineus (Climbing perch) were analyzed for fluoride. The samples of fishes and the water samples from where fish was caught were collected from July 2012, October 2012 and January 2013 from the surface fresh water sources of Alappuzha Town. A mean fluoride (n=9) concentration of 0.051±0.01 (mean±SD), 0.042±0.02 and 0.035±0.02 were shown by the water samples collected in July, October and January respectively. Though fluoride is present in the water samples at a very low concentration, there is considerable fluoride content in the fish samples collected from the same water source. The accumulation of fluoride by fishes was found to be highly variable with respect to species and month. E. suratensis had accumulated 4.071±0.71 ppm fluoride in July, 274.29±2.54 ppm in October and 2.35±0.42 ppm in January. O. mossambicus was estimated to contain 18.14±0.95, 23.33±1.05 and 12.195±1.22 ppm fluoride in July, Oct and Jan respectively. No fluoride was detected in A. testudineus samples collected in October, whereas it accumulated 6.695±0.43 and 28.18±2.01 ppm fluoride in July and January respectively
Keywords |
| Fluoride, Alappuzha, Etroplus, Tilapia, Anabas, Fluoride ion-selective electrode, Ion exchange chromatography |
INTRODUCTION |
| Fluorine and fluorides occur ubiquitously in the environment, and because of their wide and growing use in industrial processes, their environmental importance is increasing. The use of fluorides in dental health care products is also growing. Usually, the fluoride content of the water in deep wells is fairly constant, while water from shallow wells can present fluctuating values. The values may be high during dry periods or periods when the ground is frozen compared with those obtained during rainy periods. The fluoride levels in relatively shallow wells, therefore, should be assessed by repeated determinations [1]. Interest in the importance of fluoride in nutrition was created by the discovery of high incidence of chronic endemic fluorosis in man and farm animals in certain parts of India, China, Argentina and North Africa [2]. An association between fluorine deficiency and dental caries in rats was reported in 1925 by McCollum and co-workers [3]. Fluorine is physiologically very active and is widespread in nature. Fluoride salts are in abundance in the Earth‟s crust. The fluoride salts leach out and contaminates ground water. The major fluoride containing minerals are fluorapatite, fluorspar, cryolite and topaz. Fluorine is rarely encountered in nature as elemental fluorine. It is found combined chemically in the form of fluorides. Principal sources of fluoride include water, some species of vegetation, certain edible marine animals and industrial processes [4]. The chief known function of fluoride is to prevent dental caries. Its relation to dental caries was discovered through observations of the effects on the teeth and excessive fluoride in the drinking water in certain regions of United States. It was noted that although great excess of fluorine caused a mottled unsightly condition in teeth, particularly in children who used the water regularly, these teeth did not decay readily. When the water naturally contained a definite but small amount of fluorine, the teeth were not mottled and they still resisted decays. Considerable amount of fluoride may be taken in with foods grown on fluoride rich soil and with tea and other drinks made from such water. Unrefined common salt is also a rich source of fluorides [5]. Fluoride enters the human body mainly through the intake of water and to a lesser extents by food. The foods which are rich in fluoride include fish and tea [6]. Excessive fluoride can cause white spots, and in severe cases brown stains, pitting and mottling of the enamel. It has been found that the IQ of the children living in the high fluoride areas (drinking water fluoride > 3.15 mg/ml) was significantly lower [7]. There is a strong association between fluorosis in the maxillary central incisors and early dentifrice use and use of dentrifice with a high (1500ppm) fluoride concentration. It was found in a study in England that a higher proportion of children without fluorosis had used a commercially available low fluoride dentifrice [8]. Addition of fluoride to the water supply is advocated by public health authorities as a safe inexpensive and efficient way to reduce dental caries. Maximum allowable limits of fluoride in drinking water have been set at 2.4ppm for cool climates and 1.4ppm for warm climates where the water intake would be greater. One ppm of sodium fluoride is the amount approved for addition to water supply. Its positive results were shown by various investigations. These results were obtained before 1960s. Now other sources of fluoride worsen the condition even though fluoride content of water is kept at 1.4ppm. Now many studies suggest the limit as 1ppm or less [9]. Mottling of teeth had long been observed in some Texas and Colorado communities and was associated with high concentrations of fluorine in drinking water [10]. Excess fluoride content in diet also affects animals and plants. Domestic animals such as cattle, buffaloes, camels, sheep and goats are affected. Study by Choubisa [11] reports a difference in expression, prevalence and severity of fluorotoxicosis among ruminants in Rajasthan, India. Aquatic organisms would be expected to contain fluoride concentrations proportional to those in their environment. Neuhold and Sigler [12] reported mean concentration up to 1600 ppm in the bones of brown trout taken from the Madison River system. Lee and Nilson [13] recorded high concentrations of fluorides in the bones of canned salmon and mackerel. Similarly, Fisher [14] noted high concentrations of fluorides in fish meals used in the manufacture of prepared feeds. Studies by Ellis et al. [15] shows that fish egg subjected to 1.5ppm fluoride had delayed hatching time and the sensitivity to fluoride is dependent on several factors such as size of the fish, temperature of the medium, calcium concentration in the medium and chloride concentrations in the medium. The effects of fluorides in the environment, as reported by literature, all lead to the conclusion that fluorides above certain levels have a profound toxic effect on the physiology of animals. Higher than normal concentrations of calcium in the medium or the food, tend to enhance the resistance of fish to fluorides [16]. Pretreating fish in high chloride solutions confers protection against subsequent high fluoride levels [12]. The sizes (ages) of fish also affect the fluoride toxicity level and accumulation rates and levels. Larger fish are more tolerant of higher fluoride levels and accumulate less fluoride on a per weight basis [17].Endemic fluorosis is a serious public health problem in several part of the world where drinking water contains more than 1ppm of naturally occurring fluoride. Prominent among them are India, China, Japan, SriLanka, USA, Germany, Canada and Saudi Arabia [18]. According to the 2005 report of Centers for Disease Control, 32% of American children now have some form of dental fluorosis, with 2-4% of children having moderate to severe stages. Some authors regard 0.1 mg F/kg body weight per day as the exposure level above which dental fluorosis occurs. Studies in Kenya have found fluorosis with a daily fluoride intake of less than 0.03mg F/kg body weight per day from water. In North America, the prevalence of dental flurosis ranges between 7.7%-69% in fluoridated communities and from 2.9%-42% in non-fluoridated communities [19]. In India the occurrence of fluoride is reported from different parts of the states Haryana, Delhi, Rajasthan, Karnataka, Utter Pradesh, Maharashtra, Gujarat, Madhya Pradesh, Andhra Pradesh, Tamil Nadu, Kerala, Jammu Kashmir, Punjab, Orissa, Himachal Pradesh and Bihar and dental fluorosis was first reported in Prakasam district of Anthra Pradesh in 1937. Ground water having a fluoride concentration of 1.50mg/l – 18.0mg/l, was the chief source of drinking water for the fluorosis affected population of different districts of Karnataka [20]. Rajasthan is the only state in India where almost in all the districts the distribution of fluoride beyond permissible limit in ground water has been reported and in all the 23 districts the incidence of fluorosis can be seen at various intensity levels. People in several districts of Rajasthan have no other alternative but to consume water with fluoride concentrations of upto 44mg/l, resulting in permanent deformities, joint pain, general debility and misery. About 60% of fluoride intake is through water [21]. In Kerala, fluorosis has become endemic to Alappuzha and Palakkad districts [21]. The prevalence is 40% in Alappuzha and 45% in Palakkad. When internationally accepted limit of fluoride in drinking water is 1ppm, the level in Alappuzha has reached 2.5ppm which is a toxic dose [22]. |
II. MATERIALS AND METHOD |
| A. Study site |
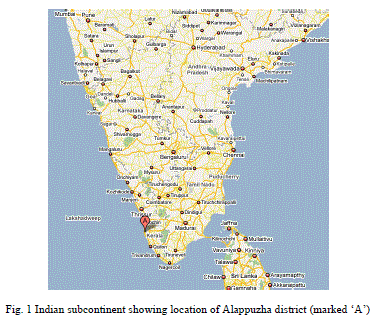
| The study was conducted in a small area of Alappuzha district situated in Indian subcontinent, popularly known as the Alappuzha town (Fig.1). Site selected is a comparatively developed area of Alappuzha district which includes Convent square, Kallupalam, Thathampally, Beach ward, Kommady and Thumpoly. |
| B. Sampling |
| Samples (n=10) were collected from randomly selected fresh water bodies and immediately transferred to the laboratory for estimation. Water as well as fish samples were collected from the selected fresh water bodies of the study site. |
| C. Determination of fluoride |
| Fluoride content in water samples were estimated using a fluoride ion selective electrode. A combination fluoride electrode was used to determine the fluoride concentrations in water samples. The samples and fluoride standard solutions were diluted 1:1 with the TISAB. The solutions, which contained 25 mL of the sample and 25 mL of TISAB solutions, were mixed with a magnetic stirrer for 3 min. The electrode potentials of the sample solutions were directly compared with those of fluoride standard solutions. Ion exchange chromatography was used for the fluoride estimations in fish samples and it was carried out in Central Institute of Fisheries Technology, Kochi, India. |
 |
III. RESULTS AND OBSERVATIONS |
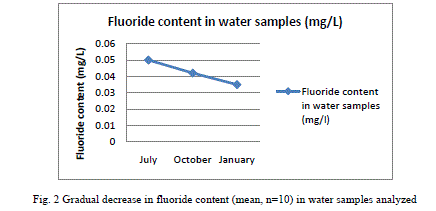
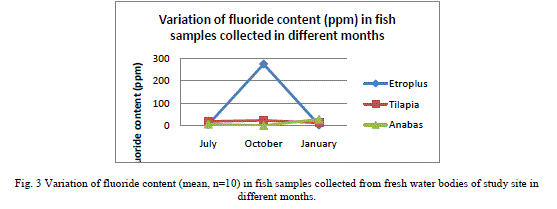
| Results shown in Table 1 shows the fluoride content in the water samples collected from the fresh water bodies of the study site. A mean fluoride (n=9) concentration of 0.051±0.01 (mean±SD), 0.042±0.02 and 0.035±0.02 were shown by the water samples collected in July, October and January respectively. It shows a gradual decrease in the content of fluoride from July to January. Fluoride concentration in the fish samples analyzed, which were caught from the water bodies from which water samples were collected are shown in Table 2. E. suratensis had accumulated 4.071±0.71 ppm fluoride in July, 274.29±2.54 ppm in October and 2.35±0.42ppm in January. O. mossambicus was estimated to contain 18.14±0.95, 23.33±1.05 and 12.195±1.22 ppm fluoride in July, Oct and Jan respectively. No fluoride was detected in A. testudineus samples collected in Oct, whereas it accumulated 6.695±0.43 and 28.18±2.01 ppm fluoride in July and January respectively. The variations of fluoride content in different samples are graphically represented in Figure 2 and 3. |
 |
 |
 |
 |
IV. DISCUSSION |
| Very low concentration of fluoride is present in the water samples (collected from the natural fresh water sources of the study site) analysed, when compared to the permissible level of 1.0mg/L in drinking water declared by Ministry of Health, Government of India [24]. This is in contrast with the various reported fluoride level in the water sources of Alappuzha. According to Davidson[18], endemic fluorosis becomes a serious problem when drinking water contains more than 1 ppm of fluoride. None of the water samples subjected to fluoride analysis showed a serious concentration of fluoride. In the present study all samples contained below 0.1 ppm fluoride and still a significant percentage of the population is affected with fluorosis stated by Gopalakrishnan [22]. The population of the study site mainly depends on wells, borewell and municipal drinking water supply for drinking water. The water samples analysed in the study were collected from ponds and wells of the study site. There may be other sources of fluoride to which human as well as other animals are subjected to which leads to the prevalence of fluorosis in the population. Water is not the only source through which fluoride enters the body ([25], [9]). Tea and fish forms a major source of fluoride for humans ([26], [27]). There are studies which reported fluoride content of less than 0.1 ppm causing fluorosis. Studies in Kenya have found fluorosis with a daily fluoride intake of less than 0.03mg F/kg body weight per day from water [19]. The study shows that very little concentration of fluoride of 0.04 mg/L is enough for the higher uptake and accumulation of fluoride in fresh water fishes. There is considerable fluoride content in the fish samples collected from the water source showing little fluoride concentration. The least amount (BDL) of F was reported in the samples of Anabas collected in October and a highest of 274.29±2.54 in Etroplus collected in October. There may be other sources of fluoride to which the fishes are exposed to in the natural environment, the major one being the food they consume. Shi et al. [28] has showed that in laboratory conditions, a concentration of 4mg/L leads to accumulation of fluoride in juvenile Siberian sturgeon at a level of 3204.4 mg/kg in bone, 1401.2 mg/kg in cartilage and 100.1 mg/kg in skin and 10mg/L in water being harmful to the growth of said fish and here water alone contained fluoride, other sources being absent. Therefore the entry of fluoride into the human body through water will be augmented by the consumption of fish. While a fluoride level of 0.4 - 1.0 mg/litre inhibited DNA repair after irradiation of mouse spleen cells in vitro [29]. None of the water samples analyzed in the study shows fluoride content above 0.5 mg/L. Since this low amount of fluoride in water resulted in appreciable accumulation in fishes, it is recommended that the permissible level of fluoride should be reconsidered. |
| As seen in Table 1, there is no appreciable difference between the mean concentrations of fluoride in the water samples collected in different months. But, the accumulation of fluoride by fishes was found to be highly variable with respect to species and month. While Etroplus and Tipalia accumulated the highest level of fluoride (274.29±2.54 and 23.33±1.05 ppm respectively) in the month of October, Anabas accumulated (28.18±2.10 ppm) the highest in January. In the month of July, Tilapia accumulated (18.14 ± 0.95) fluoride the most whereas in October, it was Etroplus (274.29 ± 2.54) and in January Anabas accumulated (28.18 ± 2.01) highest. The least amount of fluoride (2.35 ± 0.42) was reported in the Etroplus samples collected in January. According to Neuhold and Sigler [12], the uptake of fluoride by fish varies with size, temperature and species. Hemens and Warwick [17] also related the uptake of fluoride by fish with size. Bioaccumulation studies conducted along the Kerala coast have indicated similar trend in bivalves like oyster and clams [30]. The principal route of fluoride excretion is via the urine and Excretion rates may increase slightly with age [31]. |
V. CONCLUSION |
| Fishes can uptake fluoride at harmful levels from water containing little fluoride. Consuming such fish can lead to increasing fluoride levels in humans, even after using defluoridized water. Uptake of fluoride by fish varies with species and climatic conditions. |
ACKNOWLEDGEMENT |
| We are indebted to University Grants Commission for availing the grant required for the project. Also we thank Principal of our college for providing us the laboratory facilities. |
References |
|