Research & Reviews: Journal of Chemistry
e-ISSN: 2319-9849
e-ISSN: 2319-9849
El-Aryan Y*, El-Afifi EM and Khalil M
Atomic Energy Authority, Hot Labs Centre, P No 13759, Egypt
Received date: 08/12/2016; Accepted date: 03/01/2017; Published date: 05/01/2017
Visit for more related articles at Research & Reviews: Journal of Chemistry
In this research, hydrothermal synthesis techniques are used to prepare three different samples. These samples are tested to determine if they have properties that are suitable to be used as ion exchangers. The behavior of prepared materials was studied for the removal of Cs+ and Ni2+ ions from solution. The distribution coefficient of Cs+ and Ni2+ on different samples was studied at different pH values. Thermodynamic parameters such as energy of activation (Ea), entropy of activation (ΔS*) and enthalpy of activation (ΔH*) have been calculated from Van’t Hoff equation by using adsorption mechanism. Thermal degradation operation and kinetics of different prepared samples have been studied by (TGA and DTA). The degradation temperature linearly increase with the increasing heating rate. To calculate the actual reaction mechanism of the decomposition process, it is important to ascertain the magnitude of activation energy. This was determined by using the Ozawa method.
Hydrothermal synthesis, Degradation process, Kinetics, Adsorption, Thermodynamics
The procedure of nuclear reactors to the production of electricity and the usage of radionuclides in agriculture, medicine, industry, and research pose a major problem to the radioactive effluents produced [1]. Cs-137 is considered as an important radionuclide from the environmental viewpoint because of its relatively long half-life time, high activity, and the high solubility of most cesium compounds in water [2]. The raising levels of toxic heavy metals or radionuclides, which have been disposed in environment as industrial wastes, form a serious threat to human health, living resources and ecological systems. In between potentially pollutants, nickel is one of the most widespread pollutants in the environment. It is generally considered to be the wastewater including nickel is derived mainly from industrial production actions including mining, electrolysis, electroplating, batteries dyes metallurgy, pesticides, etc. [3]. Ni-63 an important product of the neutron activation of the reactor materials, is present in liquid wastes released from pressurized water from the nuclear power reactors and as generally used in research and medical usage. The presence of nickel in drinking water more than the detection limit of 0.02 mg/L lead to adverse health impacts like anemia, diarrhea, encephalopathy, hepatitis, and the dysfunction of central nervous system. For ecosystem stability and public health sake, it is of large importance to remove nickel and cesium from wastewaters. Sorption technique has been widely used for the treatment of wastewater and retention of nuclear waste due to its simplicity of design, high sorption efficiency and low cost. The treatment of such aqueous radioactive waste solutions requires the concentration of dissolved metal ions after that recovery [4]. Different techniques were used for the ions removal from solutions, among these methods is the use of ion exchangers. Ion exchangers important method to removal of radionuclide like Ni-63 and Cs-137 from nuclear waste effluent it has a high efficiency and low-cost of operations. The main advantages of ion exchange material are selectivity, recovery of metal ions [5,6]. Thermal analysis plays an important role in the environmental studies, and sediment mineral analysis is fundamental and usually requires the use of two or more supplementary analytical techniques to establish the kind of minerals present. If the kinetic mechanism has been found, calculation can be made to explain quantitatively the effect of procedure variables, such as sample weight and heating rate on the appearance of an experimental thermal analysis curve. The study of the decomposition of materials is the much important operation, in many cases; determine the upper temperature limit of use for a material [7]. Also, great care has been directed towards the exploitation of information thermogravimetric to estimate the kinetic parameters. For this purpose, thermal gravimetric analysis (TGA) is a technique used widely because of its simplicity and the information can be obtained in a simple thermal. Many ways of kinetic analysis were assumption that the trace thermogravimetric sample can be obtained activation energy and the coefficient of the collision frequency.
Hydrothermal technique was used in this paper to prepare different samples. There are many processes to calculate the thermodynamic parameters like energy of activation Ea, entropy of activation ΔS* and enthalpy of activation ΔH* by using adsorption mechanism and Ozawa methods using thermal decomposition behavior. Distribution coefficients of metal ions on the prepared ion exchangers were determined. These reported values it depends not only experimental conditions but also on mathematical treatment of data.
Chemical Reagents and Instruments
The main reagents for the synthesis of the zirconium titanate samples and used in this paper were obtained from BDH (England) and Loba Chemie (India). All other reagents and chemicals were of analytical grade purity. A double beam atomic absorption spectrophotometer, AA-6701F, Shimadzu, Japan was used for Cs+ and Ni2+ ions analysis. The thermal stability of zirconium titanate samples and its organic hybrid were ascertained by thermogravimetric analysis (TGA) and differential thermal analysis (DTA), DTA-60, Shimadzu, Japan. A pH values were measured by using pH a glass electrode, AD/030, Romania. A thermo stated shaker, Clifton, England was used for ion exchange experiments.
Synthesis of Zirconium Titanate Materials
Different samples of zirconium titanate and its composite materials with polyacrylonitrile ion exchangers were synthesized in this study to compare the ability of these new materials towards the adsorption of Cs+ and Ni2+ ions from waters. The inorganic ion exchanger zirconium titanate was first synthesized through hydrothermal process by dissolved mixture of 0.5 M ZrOCl2, 0.5 M TiCl4 and desired amount of urea in 300 ml H2O solution under vigorous agitation for 30 min to form a homogeneous solution. Then, the resulting solution was transferred into a teflon-lined stainless steel autoclave 400 ml to carry out hydrothermal reactions at 100 and 150°C for 24 hours to form ZrTi-100 (S1) and ZtTi-150 (S2) respectively.
The polyacrylonitrile zirconium titanate (S3) was synthesized by adding 10 ml of acrylonitrile to 100 ml of 0.1 M K2S2O8 prepared in 1 M HCl at about 70 ± 5°C with continuous stirring to obtain a viscous solution of polyacrylonitrile. 4 g of ZrTi-100 (S1) was mixed with the solvent of 50 mL of DMF (N, N-dimethylformamide) and a few drops of Tween-80 surfactant and stirred at 50°C for 2 h to form homogeneous solution. Then, the polyacrylonitrile viscous solution was added to the mixture solution of ZrTi- 100 (S1) with stirring at 50°C for 2 h to obtain homogeneous solution of the polyacrylonitrile zirconium titanate (S3). The gelled composite beads were left 24 h for aging and washed using ultra-pure water. Further operations included washing and drying in oven at 60°C for two days. All the samples S1, S2 and S3 were converted in H+ form by treating with 0.1 M HNO3 for 24 h. The excess acid was removed after several washings with bi-distilled water and then dried at 60°C. Several particles size of material was obtained by sieving and kept for further usage in the batch experiments.
From the distribution studies, it's found that ZrTi-100 (S1) has good sorption behaviors towards Cs+ and Ni2+ ions. So, S1 was loaded with 0.1 M of Cs+ and Ni2+ solutions for several times till reached at completely saturation of each of Cs+ and Ni2+ ions. The S1 that saturation with Cs+ and Ni2+ ions was labeling with S1CsL and S1NiL respectively for further in DTA and DTG studies.
Distribution Studies
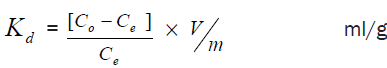
The distribution coefficient (Kd) for sorption of Cs+ and Ni2+ ions on zirconium titanate samples at different pH values was calculated by batch experiments. 0.1 g of zirconium titanate samples in the H+ form were shaken with 10 ml mixture of Cs+ and Ni2+ chloride solution at different pH values with V/m ratio 100 ml/g. After the equilibrium time 5 hours in a thermostatic shaker water bath at 30 ± 1°C, the mixtures were centrifuged then the concentration of metal ion in the solution is determined by using atomic absorption spectrophotometer (AA- 6701F). The distribution coefficients were calculated from using the following Equation 1-
 (1)
(1)
Where, Co: is the initial concentration.
Ce: is the concentration in the equilibrated solution after phase separation.
V: is the volume of solution, ml.
m: is the weight of exchanger, g.
Analytical Methods
The concentrations of Cs+ and Ni2+ ions were detected by using an atomic absorption spectrophotometer model, AA-6701 F- Shimadzu, Japan with an air–acetylene flame. Deuterium lamp correction was used and the spectral slit width was 1.3 nm.
Thermal Analysis
Thermogravimetric analysis (TGA) and deferential thermal analysis (DTA) were takes place with zirconium titanate samples of about 8 mg in N2 atmosphere using a Shimadzu DTG-60/60H with a flow rate of 20 ml/min in a temperature range from 20°C to 1000°C at different scanning rates of 5, 10 and 15°C/min. Experimental error was about ± 5°C and ± 1 wt.% for thermooxidative degradation temperature. The heating rate was preserved at about 20°C /min. (α-Al2O3) powder was used as reference material for DTA analysis.
Methods
From the curves of TGA and DTA recorded of the successive steps in the degradation operation of zirconium titanate samples it was possible to calculate the different thermal parameters for each reaction step. Weight loss at the decomposition step (Δm) it is the amount of mass that extends from the point Ti up to the point Tf on the TG curve. The material released at each step of the degradation was finding out by attributing the weight loss (Δm) at a given step to the component of similar weight calculated from the molecular formula of the investigated complexes, comparing that with literature values for relevant compounds considering their temperature.
Theoretical approach
The application of dynamic TG operation holds great promise as an agent for unraveling the mechanisms of physical and chemical procedure that carried out during solids decomposition. In this work, one operation has been used to analyze the nonisothermal kinetics of zirconium titanate samples. The pyrolysis operation may be cleared by the following reaction scheme:
A (solid) →B (Solid)+C (Volatile)
The rate of conversion,  for TGA experiment at constant rate of temperature
Change, β=dT/dt may be expressed by
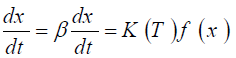 (2)
(2)
Where x is the degree of advance, f (x) and K (T) are functions of conversion and temperature, respectively.
K (T), the temperature dependence on the rate of weight loss, is often modeled successfully by the Arrhenius equation
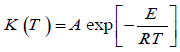
Where E is the apparent energy of activation, A is the pre-exponential factor and R: - is the gas constant.
The Ozawa method
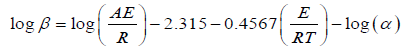
The Ozawa procedure is the much important operation for kinetic data analysis [8-10]. This method used to compare heating rates with temperatures under the identical conversion rates. The kinetic parameters of dehydration operation of various material prepared were determined by Ozawa equation
 (4)
(4)
Where β is the heating rate (K·min–1), A is the pre-exponential factor (min−1), R is the gas constant (8.314 Jmol-1·K-1), E is the energy of activation, and
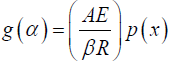 (5)
(5)
 (6)
(6)
where α is the fraction of degradation material, which is given by
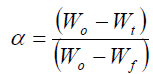 (7)
(7)
where Wo and Wf are the initial and the final mass of the sample respectively and Wt is the mass of the sample at temperature t.
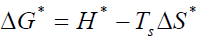
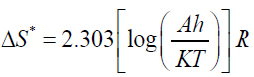
By plotting graphs between log β versus 1/T a different straight line at different conversion rates, the activation energy Ea and frequency factor log A could be obtained from the slope and the intercept respectively. Ea was then calculated from the slope and the constant (A) was obtained from the intercept. The enthalpy ΔH*, free energy ΔG* of activation and entropy ΔS* were determined by using the following equations:
 (8)
(8)
 (9)
(9)
 (10)
(10)
Where k and h: - are the Boltzmann and Planck's constants, respectively.
Distribution Studies
The distribution coefficient, Kd, of Cs+ and Ni2+ ions at different pH values and different reaction temperatures for different zirconium titanate ion exchangers are observed in Figures 1 and 2. The studies show that the equilibrium time which required for the exchange of Cs+ and Ni2+ ions of different samples was found that at about 5 h.

Figure 1: Log Kd as a function of pH values of Cs+ ions onto different zirconium titanate samples (a) S1, (b) S2 and (c) S3 at different reaction temperatures.

Figure 2: Log Kd as a function of pH values of Ni2+ ions onto different zirconium titanate samples (a) S1, (b) S2 and (c) S3 at different reaction temperatures.
It is observed from figures that the pH solution played a major role in the adsorption of Cs+ and Ni2+ ions onto ion zirconium titanate exchange materials. The adsorption of Cs+ and Ni2+ ions is increasing by increasing pH. These results can be due to, at very low pH values; hydrogen ions concentration is high enough to compete with metal ions and hinders the access of these metal ions for occupation of active binding sites. However, the metal ion removal and Kd values increased with increasing pH values, this can be explained on the basis of decrease in competition between proton ions and positively charged metal ions at the adsorbent surface sites. Effect of temperature on the distribution coefficient of Cs+ and Ni2+ onto different zirconium titanate samples was studied by carrying out the sorption experiments at varying temperatures in the range of 30-65°C. According to Figures 1 and 2, the amount of the distribution coefficient increases with the increase of temperature for Cs+ and Ni2+ onto zirconium titanate samples, which showed the interactions to be endothermic.
Thermodynamic Parameters
The magnitude of thermodynamic parameters is related to the practical applications of adsorption operation. Isotherm data relevant to adsorption of Cs+ and Ni2+ ions onto the various zirconium titanate materials at different temperatures, it was analyzed to knew the magnitude of thermodynamic parameters from Van’t Hoff plots of the adsorption of Cs+ and Ni2+ ions as shown in Figure 3 and Table 1.

Figure 3: Van’t Hoff plot of the adsorption of (a) Cs+ (b) Ni2+ ions on different zirconium titanate samples at different reaction temperatures.
| Zirconium samples | Temp. (K) | ΔG*, (kJ mol-1) | ΔH*, (kJ mol-1) | ΔS*, (J mol-1 k-1) | |||
|---|---|---|---|---|---|---|---|
| Cs+ | Ni2+ | Cs+ | Ni2+ | Cs+ | Ni2+ | ||
| S1 | 303 318 338 |
-9.37 -10.52 -11.54 |
-11.58 -12.95 -14.25 |
8.36 | 10.20 | 58.51 59.37 58.87 |
71.80 72.71 72.30 |
| S2 | 303 318 338 |
-9.22 -10.41 -11.57 |
-11.38 -12.79 -14.07 |
9.84 | 10.50 | 62.90 63.67 63.34 |
72.22 73.24 72.70 |
| S3 | 303 318 338 |
-9.32 -10.17 -11.04 |
-11.18 -12.27 -13.37 |
4.93 | 6.87 | 47.03 47.48 47.25 |
59.33 59.96 59.67 |
Table 1: Thermodynamic parameters of the adsorption of Cs+ and Ni2+ ions onto different zirconium titanate samples at various reaction temperatures.
The magnitude of thermodynamic parameters ΔS* and ΔH* were calculated by using Van’t Hoff’s equation shown in Table 1, It is given for:
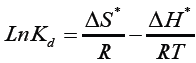 (11)
(11)
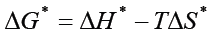 (12)
(12)
where ΔG* is the change in Gibbs free energy (J mol-1), R universal gas constant (8.314 JK-1 mol-1), T temperature (Kelvin), ΔH* change in enthalpy (Jmol-1), ΔS* change in entropy (Jmol-1 K-1).
The thermodynamic parameters for adsorption of Cs+ and Ni2+ ions are shown in Table 1. The free energy with physisorption is generally between 0 and -20 kJ mol–1, the physisorption with chemisorption within the range of -20 to -80 kJ mol–1 and chemisorption within the range of -80 to -400 kJ mol–1 [11]. As shown in Table 1 the adsorption of Cs+ and Ni2+ ions onto various prepared materials are physisorption, the free energy changes ΔG* through the adsorption operations was negative value identical for a spontaneous reaction and the boundary of physisorption operation of Cs+ and Ni2+ ions adsorption onto ion exchange materials [12]. Lowering in the amount of ΔG* together with the rise of temperature, was evident that reactions were more spontaneous at elevated temperature which shown that the sorption processes are preferable when temperature rise [13]. The positive value of enthalpy change ΔH* shown that the adsorption operations were endothermic and such value also shown that the adsorption is go ahead to physisorption mechanism this indicate that weak attraction forces between the adsorbed of Cs+ and Ni2+ ions, thereby evidence that the adsorption operations was stable energetically [14]. The positive value entropy change ΔS* values is agreed with rise the randomness at the solid/solution interface through the adsorption of Cs+ and Ni2+ ions onto a various prepared materials. Thermal decomposition is a very significant operation which helps us to detected the effect of the hydrothermal synthesis and adsorption of Cs+ and Ni2+ onto the thermal stability, the suitable temperature of operation and the activation energies related to with degradation operations [15,16]. Thermogravimetric analysis (TGA) has been proved to be relatively fast and accurate method for the calculation of the kinetic parameters of degradation processes. The TGA and DTA curves for the zirconium titanate prepared at 100°C which was loaded by Cs+ labeled with S1LCs, zirconium titanate prepared at 100°C which was loaded by Ni2+ labeled with S1LNi, S1, S2 and S3 are given in Figures 4 and 5. These curves characterized and comparison the manner of thermal decomposition of various materials under study with the various heating rate of 5, 10 and 15°C min–1 under nitrogen, the experimental temperature 1000°C. Therefore, the peaks TGA are observed only for some steps in the DTA curves. In general, it is observed that the sequence of decomposition that takes place in these materials starts with dehydration of adsorbed water followed by the release of coordination water. The TGA and DTA curves, Figures 4 and 5, reveals the first step decomposition process for S1LCs at the 14-155°C with weight loss -21.77%, decomposition process for S1LNi first step at the 30-128°C with weight loss -15.18%, decomposition process for S1 two steps the first step at 24-110°C with weight loss -7.25% and second step at 214-304°C with weight loss -19.07%, decomposition process for S2 first step at 31-143°C with weight loss -10.13% and decomposition process for S3 three steps the first step endothermic peak at 29-114°C with weight loss -9.1%, second step exothermic peak at 229- 380°C and third step exothermic peak at 519-667°C with weight loss -12.47%.

Figure 4: TGA of different zirconium titanate samples (a) S1LCs, (b) S2LNi, (c) S1, (d) S2 and (e) S3 at different rates.

Figure 5: DTA of different zirconium titanate samples (a) S1LCs, (b) S2LNi, (c) S1, (d) S2 and (e) S3 at different rates.
Such change is due to truth that when overlapping steps are different, weight losses occurred in three or six consecutive and/or overlapping steps. The difference in the thermal decomposition behavior of these materials can be seen more obviously in their TGA and DTA curves, Figures 4 and 5. Table 2 compares the characteristic thermal and kinetic parameters calculated from the TGA and DTA curves, of materials in the decomposition series from the materials. It can be seen obviously in Table 2 that the weight losses get it from the TGA curves and that evaluated for the corresponding molecule or molecules are in good compact as is the case for these materials. As the composition of the final degradation products (i.e., final residue) of these three materials are not cleared, thermal decomposition with ill-defined final states are considered of these materials. The activation energies (Ea) are determined from the slopes of the good fit straight lines [17]. The first-steps of degradation in the TGA curves through the 14- 155°C, 30-128°C, 24-110°C, 31-143°C and 29-114°C limit of materials (S1LCs, S1LNi, S1, S2 and S3) respectively, and the related endothermic peaks in the DTA curves, Figure 5 show the loss of adsorbed water from various materials [18-21]. The activation energies calculated from these reactions in the various material are 47.7 kJ mol–1, 39.2 kJ mol–1, 54 kJ mol–1, 45.4 kJ mol–1 and 60.14 kJ mol–1 respectively. Such materials display close values of activation energy, temperature-range and order of reaction from the dehydration reactions as shown in Table 2.
| Zirconium Titanate samples | Heating rate (°C min-1) | Tp °C | Ea (kJ/mol) | Correlation coefficient | Wt Loss % at 175°C |
|---|---|---|---|---|---|
| S1 | 5 10 15 |
333.03 347.64 351.86 |
54.00 | 0.985 | -14.13 |
| S2 | 5 10 15 |
341.27 352.37 364.40 |
45.40 | 0.991 | -16.29 |
| S3 | 5 10 15 |
331.74 338.50 369.90 |
60.14 | 0.970 | -13.90 |
| S1LCs | 5 10 15 |
336.39 346.46 357.21 |
47.70 | 0.987 | -23.62 |
| S1LNi | 5 10 15 |
333.42 343.63 359.52 |
39.20 | 0.956 | -17.79 |
Table 2: Characteristic parameters of thermal decomposition at different heating rates for S1LCs, S1LNi, S1, S2 and S3.
In this dehydration operation, the easiness absorbed water onto the material lead to weak interaction of water, i.e., the lattice forces don't depends only absorbed of water and occupies the crystal voids [22]. The second steps decomposition process for S1 at the 214-304°C with weight loss -19.07% by endothermic peak due to coordination water and decomposition process for S3 at the 229-380°C with weight loss -8.13% and third step at 519-667°C with weight loss -12.47 with exothermic peak due to coordination water and degradation of organic part. Table 2 indicate the adsorption behavior of Cs+ and Ni2+ are hydration this clear from the calculated the weight loss before and after loaded by ions.
The Ozawa procedure has been greatly used of kinetic data analysis [8,9]. such integral operation compared heating rates 5, 10 and 15 with temperatures. The kinetic parameters of dehydration operation of various materials prepared were calculated by using Ozawa equation. By plotting graphs between log β versus 1/T a different straight line was obtained at various conversion rates as displayed in Figures 6 and 7, the activation energy Ea and frequency factor A could thus be obtained from the slope and the intercept respectively. Ea was then determined of the slope and the frequency factor (A) was obtained from the intercept. The entropy ΔS*, enthalpy ΔH*, and free energy ΔG* of activation were determined.

Figure 6: Variation of log B as a function of 1/T of (a) S1LCs and (b) S1LNi.

Figure 7: Variation of log β as a function of 1/T of (a) S1, (b) S2 and (c) S3.
The activation energy can be calculated by the procedure of Ozawa method, from a linear fitting of log β against 1/T at various conversions Figures 6 and 7. Possess to the truth such equation was derived by the Doyle approximation, only conversion values in the low range can be used. For such study, we have used the conversion values: 0.95, 0.90, 0.85, 0.80 and 0.75 of S1LCs, 0.97, 0.94, 0.90, 0.88 and 0.84 of S1LNi, 0.84, 0.79, 0.75, 0.72 and 0.70 of S1, 0.97, 0.93, 0.85, 0.81 and 0.77 of S2 and 0.95, 0.91, 0.90, 0.88 and 0.86 of S3 as shown in Figures 6 and 7 (Table 3). Figures 6 and 7 indicate that the fitting straight lines are nearly parallel, thus indicating the applicability of this procedure to our system in the conversion range studied. Such truth suggests that a single reaction mechanism [23]. Activation energies identical to the various conversions are shown in Table 3.
| α Conversions | Frequency factor(A) | R-value Correlation Coefficient | Ea(kJ/mole) | ΔH* (kJ/mole) | ΔG* (kJ/mole) | ΔS* (J/mole K) |
|---|---|---|---|---|---|---|
| Sample S1LCs | ||||||
| 0.95 | 0.0174 × 10³ | 0.988 | 21.80 | 19.12 | 90.46 | -221.83 |
| 0.90 | 0.1123 × 10³ | 0.999 | 28.80 | 25.97 | 96.19 | -206.77 |
| 0.85 | 8.54 × 10³ | 0.998 | 43.50 | 40.57 | 100.87 | -171.07 |
| 0.80 | 0.0032 × 10³ | 0.991 | 20.91 | 17.70 | 109.04 | -237.32 |
| 0.75 | 0.00024 × 10³ | 0.999 | 14.42 | 10.52 | 131.87 | -260.53 |
| Sample S1LNi | ||||||
| 0.97 | 1.31 | 0.999 | 14.23 | 11.54 | 90.27 | -243.38 |
| 0.94 | 9.28 | 0.987 | 21.48 | 18.66 | 95.59 | -227.47 |
| 0.90 | 1.51 | 0.962 | 16.64 | 13.65 | 101.02 | -243.10 |
| 0.88 | 5.34 | 0.987 | 21.48 | 18.34 | 106.24 | -232.98 |
| 0.84 | 0.177 | 0.916 | 10.73 | 7.23 | 117.67 | -262.22 |
| Sample S1 | ||||||
| 0.84 | 2.92 × 10³ | 0.962 | 55.47 | 51.50 | 138.58 | -182.51 |
| 0.80 | 2.27 × 10⁷ | 0.995 | 96.06 | 91.87 | 146.49 | -108.46 |
| 0.75 | 5.71 × 10⁶ | 0.979 | 94.09 | 89.73 | 152.71 | -120.27 |
| 0.72 | 3.31 × 10⁵ | 0.962 | 83.21 | 78.77 | 155.60 | -144.09 |
| 0.70 | 1.84 × 10⁵ | 0.891 | 82.08 | 77.58 | 158.21 | -149.09 |
| Sample S2 | ||||||
| 0.97 | 80.00 | 0.895 | 28.62 | 25.70 | 99.25 | -209.85 |
| 0.93 | 7.57 | 0.935 | 23.46 | 20.28 | 97.95 | -203.18 |
| 0.85 | 2.50 | 0.922 | 25.16 | 21.22 | 135.49 | -241.18 |
| 0.81 | 0.63 | 0.912 | 22.89 | 18.47 | 152.99 | -253.58 |
| 0.77 | 0.71 | 0.926 | 26.17 | 21.17 | 173.65 | -253.63 |
| Sample S3 | ||||||
| 0.95 | 222 | 0.876 | 27.65 | 25.08 | 86.97 | -200.32 |
| 0.91 | 17.28 | 0.889 | 23.02 | 20.25 | 95.67 | -222.33 |
| 0.90 | 11.48 | 0.874 | 22.37 | 19.49 | 97.88 | -225.92 |
| 0.88 | 3.82 | 0.918 | 19.87 | 16.84 | 102.64 | -235.47 |
| 0.86 | 0.62 | 0.988 | 15.09 | 11.78 | 111.84 | -251.33 |
Table 3: Kinetics and thermodynamic parameters for different zirconium titanate dehydration materials, S1LCs, S1LNi, S1, S2 and S3.
Table 3 displayed activation energies, the pre-exponential factors and correlations of various conversions at steady heating rate value 5, 10, 15ºC/min, respectively. Analyses of that table indicate that, the activation energies increase with the increasing of the heating rate. The positive value of ΔH* show that the dissociation operation are endothermic in nature and enhanced with the increasing of temperature. ΔG* magnitude are positive lead to such dissociation operation are non-spontaneous [24]. The negative magnitudes for ΔS* show that the thermal degradation of different zirconium materials has more ordered structure through the degradation process and moreover the greater values of A show a fast nature of reaction [25].
From that values the average values of materials S1LCs, S2LNi, S1, S2 and S3 are 25.88, 16.91, 82.18, 25.26 and 21.6 kJ/mol respectively as in Table 3, the activation energy of materials S1 is higher than the values of activation energy of materials S1LCs, S2LNi, S2 and S3, so S1 most stable than the others materials, the stability of materials take the order: S1>S1LCs>S2>S3>S2LNi.
The various zirconium titanate ion exchangers considered as an important materials to the removals of Cs+ and Ni2+ ions from aqueous waste. The distribution coefficient was increased with increased the pH values. The order of selectivity of the zirconium titanate samples towards the sorption of Cs+ was S2>S3>S1, where the order of the sorption of Ni2+ was S1>S2>S3. These orders depended on the ionic radii and hydrated ionic radii of the sorption ions. The results show that the zirconium titanate exchangers have more sorption for Cs+ than Ni2+ ions. The thermal analysis and thermodynamic parameters were calculated and studied using Van’t Hoff and Ozawa equations. The experimental data cleared that the sorption operation has endothermic process. The high activation energy explained the high degree of thermal steadiness and opposition to heat. The negative value of ΔG* shows the spontaneous reaction of the sorption process. The positive value of enthalpy change ΔH* shown that the adsorption operations were endothermic. The positive value entropy change ΔS* values is agreed with rise the randomness at the solid/ solution interface through the adsorption of Cs+ and Ni2+ ions onto a various zirconium titanate materials. In the decomposition reaction, the major reason of weight loss corresponding to liberation of free water and coordinate water. From the Ozawa calculated, the ΔG* magnitude was positive and ΔS* was negative indicated the dissociation operation was non-spontaneous and the thermal degradation of different zirconium materials has more ordered structure through the degradation process. The raise in activation energies for thermal decomposition and other related kinetic parameters such as the frequency factor, entropy of activation and rate coefficient with the raise in heating temperature clearly show the enhancement in thermal steadiness of various materials prepared.