ISSN ONLINE(2319-8753)PRINT(2347-6710)
ISSN ONLINE(2319-8753)PRINT(2347-6710)
M.Santhi1, P.E.Kumar2*
|
| Related article at Pubmed, Scholar Google |
Visit for more related articles at International Journal of Innovative Research in Science, Engineering and Technology
Activated carbon was developed from TyphaAngustata L, characterized and used for the removal of Rhodamine B from waste water successfully. Rhodamine B is one of the water soluble, basic red cationic Xanthene class dyes, a common water tracer fluorescent. Batch adsorption experiments were carried out as a function of PH,contact time, initial concentration of the adsorbate, adsorbent dosage and temperature. The experimental data were analyzed using the pseudo second order kinetic model. The equilibrium data satisfied by Langmuir Isotherm models. The changes in standard free energy (ΔGº), Standard Entropy(ΔSº) Standard enthalphy (ΔHº) were calculated. The thermodynamic study has showed that the dye adsorption phenomenon onto AC-MnO2-NC was favorable, endothermic and spontaneous.
Keywords |
| AC-MnO2-NC, Rhodamine-B, Adsorption isotherm, Kinetics, Equilibrium. |
INTRODUCTION |
| Among the different pollutants of aquatic ecosystem, dyes are a large and important group of industrial chemicals for which world production in 1978 was estimated at 640,000 tons[1]. Dyes arc widely used in industries such as textiles, rubber, paper, plastic, cosmetics, etc to color their products.The dyes are invariably left as the major waste in these industries. |
| Synthetic dyes are used extensively in many industries including dye houses, paper prints and textile dyers. A significant proportion of synthetic dyes are lost annually to waste streams during textile processing, which eventually enters the environment [2]. Some of dyes are toxic and carcinogenic and require separation and advanced treatment of textile effluents before discharge into conventional systems [3]. Due to biodegradability of dyes, a conventional biological waste water treatment process is not very efficient in treating dye waste water. |
| The removal of color from waste water can be accomplished by flotation, chemical coagulation,chemical oxidation and adsorption [4]. Hence investigations have been conducted on physicochemical methods of removing color from textile effluents [5]. |
| These studies include chemical oxidation [6],membrane filtration[7] and adsorption techniques[8].In these techniques adsorption has been found to be an efficient process to remove dye. Activated carbon [9] and natural adsorbents such as banana and orange peel [10], apple pomace and wheatstraw [11], waste mud [12], wood materials [13],Jambonut[14] and BorassusflabelliferL[15] have been extensively used as adsorbents. Activated carbon adsorption has been found to be an effective means of waste water treatment. |
| Adsorption hold promise in the treatment of waste water as it is inexpensive simply designed, easy to handle. The aim of this study was to use the dried AC-MnO2-NC to remove one important reactive dye, RhodamineB (RhB) from aqueous solution. RhodamineB(RhB)is one of the water soluble xanthene class dyes, a basic red cationic dye which is a common water tracer fluorescent. It is often used textile and food industries. |
II. MATERIALS AND METHODS |
Adsorbate |
| Basic dye used in this study is Rhodamine B purchased from S.d. fine chemicals, Mumbai, India. RhB has molecular formula-C28H31ClN2O3.The dye concentration in supernatant solution was determined at characteristic wavelength [λmax =543nm] by double beam UV-visible spectrophotometer [Systronics 2202]. |
2.2. Preparation of Activated Carbon |
| The TyphaAngustata L plant materials were collected from local area situated at Thindal, Erode District, Tamilnadu. They were cut into small pieces and dried for 20 days. Finally it was taken in a steel vessel and heated in muffle furnace. The temperature was raised gradually upto 5000c and kept it for half an hour. The carbonised material was ground well and sieved to different particle size. It was stored in a plastic container for further studies. In this study particle size of 0.15 to 0.25mm was used. |
2.3. Preparation of AC-MnO2-NC |
| Activated Carbon [3gm] was allowed to swell in 15mL of water-free Alcohol and stirred for 2 hours at 250C to get uniform suspension. At the same time, the Maganese dioxide [3gm] was dispersed into water-free Alcohol [15mL]. Then the diluted Maganese dioxide was slowly added into the suspension of activated Carbon and stirred for a further 5 hours at 250C.To this, 5mL alcohol and 0.2mL of deionised water was slowly added. The stirring was continued for another 5 hours at 250C and the resulting suspension was kept overnight in a vacuum oven for 6 hours at 800C. Characteristics of the AC-MnO2-NC were determined and the results are summarized in Table.1. |
 |
2.3 Characteristion of Adsorbent |
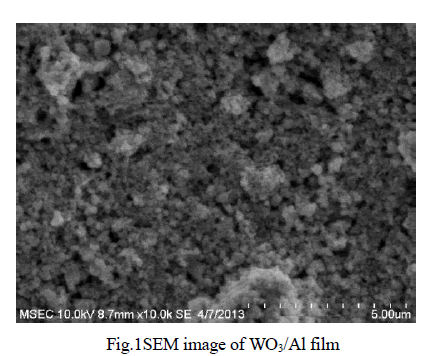
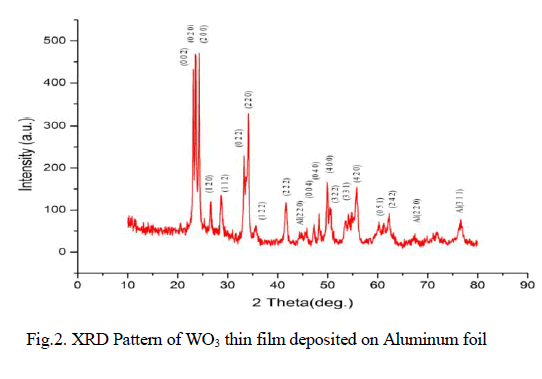
| Physico-Chemical characteristics of the adsorbents were studied as per the standard testing methods [16]. Figure 1, 2 shows the XRD pattern of pure AC and AC-MnO2-NC respectively. The peaks at 28° [Figure 1] and at 30° [Figure 2] confirm the presence of AC-MnO2 phase in the nanocomposite. The surface morphology of the adsorbent was visualized via scanning electron microscopy [SEM] are shown in Figure 3 and 4. The diameter of the composite range was 10μm. FTIR spectra indicate the presence of Mn02 peak at 430cm-1. |
 |
 |
2.4 Batch adsorption method |
| A stock solution [1000mg/L] of RhB was prepared by dissolving an appropriate amount of each dye in double distilled water, which was diluted to desired concentrations of 10, 20, 30 and 40mg/L. Batch adsorption [17] experiments were carried out to investigate the effect of PH, temperature, adsorbent dose, initial dye concentration, contact time on the adsorption of RhB on AC-MnO2-NC by varying the parameters under study and keeping other parameters constant. In each experiment pre weighed amount of adsorbent was added to 50mL of dye solution taken in a 150mL of conical flask and the pH was adjusted by using 0.1M NaOH or 0.1M HCL. The resulting solution was agitated at 200rpm on a stirrer at constant temperature and centrifuged [Remi Research Centrifuge]. |
| The percentage removal of dye and amount of dye adsorbed on AC-MnO2-NC was calculated by equation [1] and equation [2] respectively. |
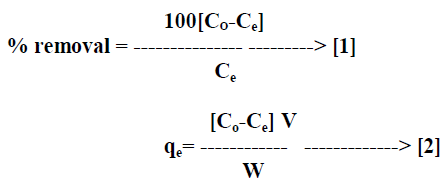 |
| Where qe is the quantity of dye adsorbed on the adsorbent at the time of equilibrium [mg/g], Co and Ce are the initial and equilibrium concentrations [mgL-1] of the dye in solution respectively, V is the volume [L] of solution and W is the weight of adsorbent [g]. All adsorption experiments were performed in triplicate and the mean values were used in data analysis. |
2.5. Batch Kinetic Studies |
| The batch kinetic [17] experiments were basically identical to these of adsorption equilibrium method. The amount of adsorption qt [mg/g] at time t, was calculated by, |
 |
| Where Ct [mg/L] is the liquid phase concentration of dye at any time. |
III. THEORY OF ADSORPTION ISOTHERM |
| To quantify the adsorption capacity of the adsorbent for the removal of dyes, the most commonly used isotherm, namely Freundlich, Langmuir and Tempkin have been adopted. |
3.1. Freundlich Isotherm |
| The linear form of Freundlich isotherm [18] is represented by the equation. |
| logqe = logkf + 1/n logCe ---------------> [4] |
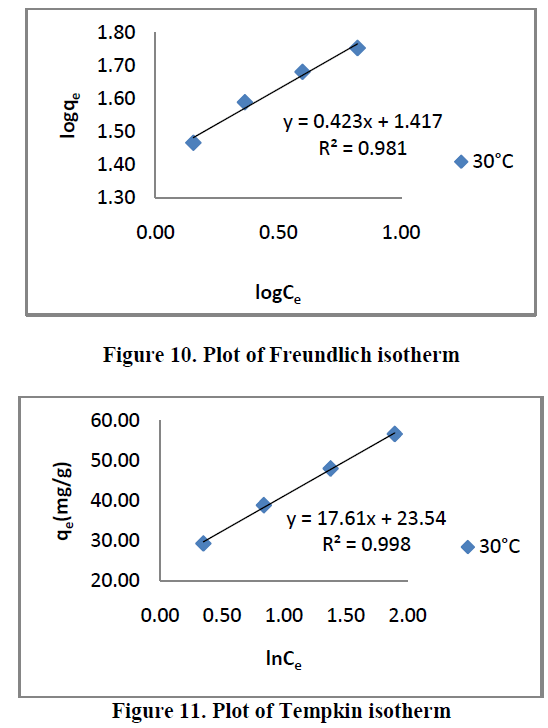
| Where qe is the amount of dyes absorbed per unit weight of the adsorbent, [mg/L], kf is [mg/g [L/mg]] measures of adsorption capacity and 1/n is the adsorption intensity. In general kf Value increases the adsorption capacity for a given adsorbate increases. The magnitude of the exponent 1/n gives an indication of the favorability of adsorption. The value of n > 1 represents favorable adsorption condition [19,20] or the value of 1/n are lying in the range of 1 to 10 confirms the favorable condition for adsorption. The linear plot of logqeVs logCe shows that the adsorption obeys the Freundlich model. |
3.2. Langmuir Isotherm |
| Langmuir isotherm model [21] is based on the assumption that maximum adsorption corresponds to a saturated monolayer of solute molecules on the adsorbent surface. The linear form of the Langmuir isotherm equation can be described by |
 |
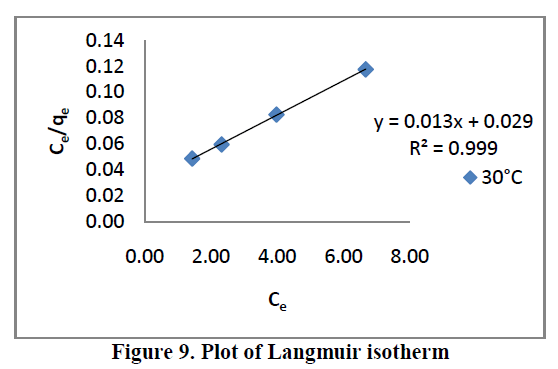
| Where Ce [mg/L] is the equilibrium concentration of the adsorbate, qe [mg/g] is the amount of adsorbate adsorbed per unit mass of adsorbent, Qo and KL are Langmuir constants related to adsorption capacity and rate of adsorption respectively. Qo is the amount of adsorbate at complete monolayer coverage [mg/g] which gives the maximum adsorption capacity of the adsorbent and KL [L/mg] is the Langmuir isotherm constant that relates to the energy of adsorption [or rate of adsorption]. The linear plot of specific adsorption capacity Ce/qe against the equilibrium concentration Ce shows that the adsorption obeys the Langmuir model. The Langmuir constant Qo and KL were determined from the slope and intercept of the plot and are presented in Table 2. In order to find out the feasibility of the isotherm, the essential characteristics of the Langmuir isotherm can be expressed in terms of dimensionless constant separation factor RL [22, 23] by the equation, |
 |
| Where Co [mg/L] is the initial concentration of adsorbate and KL [L/mg] is Langmuir isotherm constant. The parameter RL indicate the nature of the adsorption isotherm. |
 |
3.3. Tempkin isotherm |
| Tempkin isotherm contains a factor that explicitly takes into account adsorbing species-adsorbate interactions. This isotherm assumes that : [1]. The heat of adsorption of all the molecules in the layer decreases linearly with coverage due to adsorbate-adsorbate interactions, and [2] Adsorption is characterized by a uniform distribution of binding energies, up to some maximum binding energy [24]. |
| Tempkin isotherm is represented by the following equation: |
| qe =RT/b ln[ACe] --------------> [7] |
| equation [7] can be expressed in its linear form as: |
| qe= RT/b lnA+RT/b lnCe |
| qe=B lnA+BlnCe--------------> [8] |
| Where B=RT/b |
| The adsorption data can be analysed according to equation [8]. A plot of qeVersuslnCe enables the determination of the isotherm constants A and B. A is the equilibrium binding constant [1/mol] corresponding to the maximum binding energy and constant B is related to the heat of adsorption. For RhB adsorption by AC-MnO2-NC and values of the parameters are given in Table [2]. |
IV. ADSORPTION KINETICS |
| The study of adsorption kinetics describes the solute uptake rate and evidently this rate controls the residence time of adsorbate uptake at the Solid-Solution interface. The kinetics of RhB adsorption by the AC-MnO2-NC were analysed using Pseudo first-order, Pseudo second – order, Elovich and intra particle diffusion model. The conformity between experimental data and the kinetic models was expressed by the correlation co-efficient [R2] value, the R2 values close or equal to 1. A relatively high R2 value indicates that the model successfully describes the kinetics of RhB dye adsorption. |
4.1. Pseudo first order kinetic model |
| The linear form of Langergren’s first order rate equation is as follows [25], |
| ln [qe-qt] = lnqe-K1t --------------> [9] |
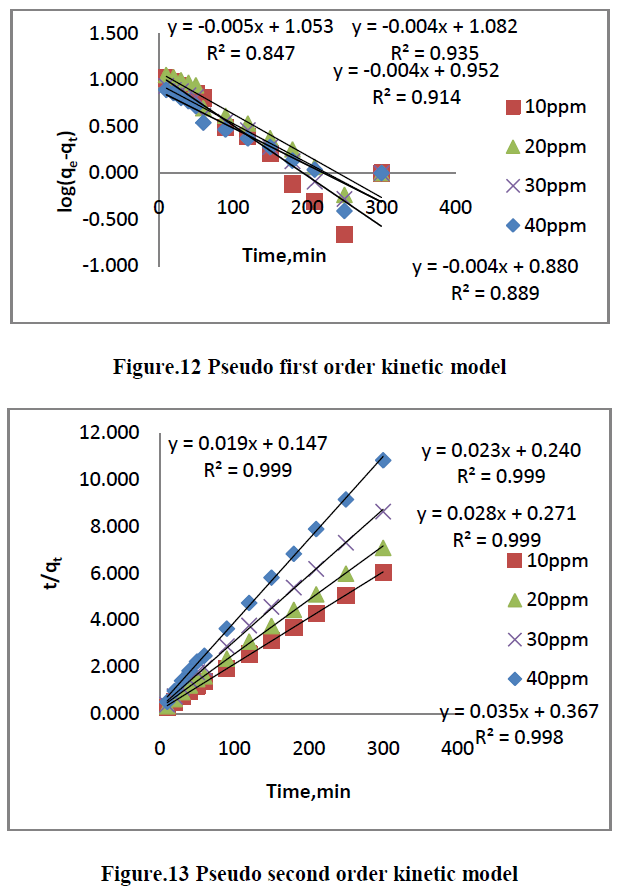
| Where qe is the amount of dye adsorbed onto the adsorbent at equilibrium [mg/g], qt is the amount of dye adsorbed on to the adsorbent at any time t[mg/g] and K1[min-1] is rate constant of the pseudo first order adsorption which can be calculated from the slope of the linear plot of ln[qe-qt] Vs t [slope = K1, qe = intercept]. The adsorption of pseudo first order rate constant and correlation coefficient [R2] values are summarized in Table [3]. |
4.2 Pseudo second order kinetic model |
| The linearised form of the pseudo second order model as given by Ho [26] is |
| t/qt =1/K2qe 2 + t/qe -------------->[10] |
| Where K2 [gmg-1min-1] is the rate constant of the pseudo second order adsorption, qe is the amount of dye adsorbed on the adsorbent at equilibrium [mg/g], and qt is the amount of dye adsorbed on the adsorbent at any time, t [mg/g]. The plot of t/qt Vs t should give a linear relationship from which qe and K2 can be determined from the slope and intercept of the plot respectively. The pseudo second order rate constant K2, the correlation coefficient [R2] values are summarized in Table [3]. |
4.3. Elovich model |
| The elovich model equation is generally expressed as [27] |
| qt = 1/β ln[αβ] + 1/β lnt --------------> [11] |
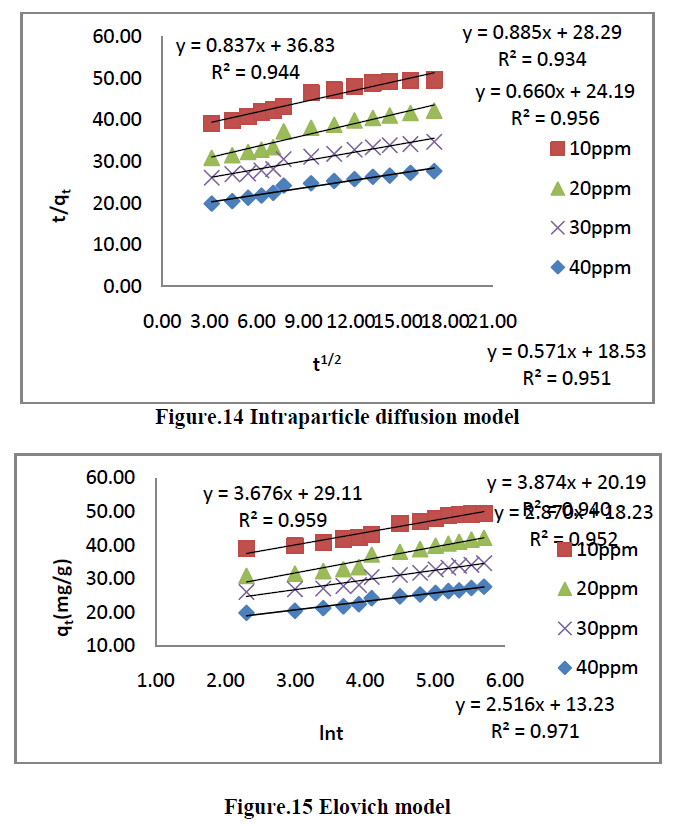
| Where α- is the initial adsorption rate [mg g-1min-1], β is the desorption constant [gmg-1] during any one experiments. A plot of qtVslnt should yield a linear relationship with a slope of [1/β] and an intercept of 1/βln[αβ]. The elovich model parameters α, β and correlation coefficient [R2] are summarized in Table [3]. |
4.4. Intraparticle diffusion model |
| The intraparticle diffusion model used here refers to the theory proposed by Weber and Morris [28] based on the following equation for the rate constant |
| qt = Kid t1/2 + C --------------> [12] |
| Where Kid is the intraparticle diffusion rate constant [mg g-1 min-1/2] and C is constant. If the rate limiting step is intraparticle diffusion, the graphical representation of adsorbed dye qt [mgg-1] depending on the square root of the contact time [t1/2] should yield a straight line passing through the origin [40]. The plot of qt Vs t1/2 will give the value of the intraparticle diffusion rate constant [Kid] and correlation coefficient [R2] can be determined from the slope respectively. The intraparticle diffusion rate constant Kid, the correlation co-efficient [R2] values are summarized in Table [3]. |
V. THERMODYNAMIC TREATMENT OF THE ADSORPTION PROCESS |
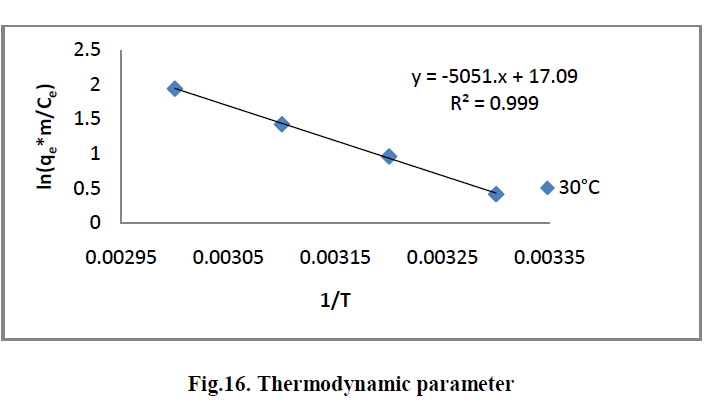
| The effect of temperature on the adsorption of RhB by AC-MnO2-NC adsorbents were investigated at 303, 313, 323 and 333K. Thermodynamic parameters, such as change in enthalpy [ΔH°], entropy [ΔS°] and Gibb’s free energy [ΔG°] were determined for the MG by AC-MnO2-NC using equation [13] & [14]. [29]. |
| ln [qem/Ce] = ΔS°/R - ΔH°/RT ----------> [13] |
| ΔG° = ΔH° - T ΔS° ---------------> [14] |
| Where m is the adsorbent dose [mg/L], Ce is the equilibrium concentration [mg/L] of the dye in solution and qem is the solid-phase concentration [mg/L] at equilibrium. R is the gas constant [8.314J/mole/K] and T is the temperature [K]. ΔH°, ΔS° and ΔG° are changes in enthalpy [KJ/mol], entropy [J/mol/K] and Gibb’s free energy [KJ/mol] respectively. |
| The values of ΔH° and ΔS° were determined from the slope [-ΔH°/R] and the intercept [ΔS°/R] of the plots of ln [qem/Ce] Vs 1/T. The ΔG° values were calculated by using equation [14]. The values of the thermodynamics parameters are presented in Table [4]. |
VI. RESULTS AND DISCUSSIONS |
6.1. Effect of Agitation time Vs initial dye concentration |
| Effect of Agitation time Vs initial dye concentration [10, 20, 30 and 40 mg/L] on removal of RhB by AC-MnO2-NC are shown in Figure 5. The percent removal of RhB increased with increase in agitation time and reached equilibrium at 210min. The percent dye removal at equilibrium decreased from 78.23 to 99.23 as the dye concentration was increased from 10 to 40 mg/L. It is clear that the removal of dye depends on the initial concentration of the dye. The removal curves are single, smooth and continuous leading to saturation. |
 |
6.2. Effect of adsorbent dosage |
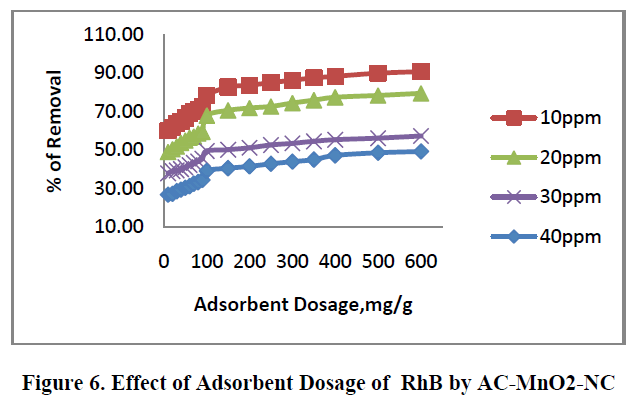
| The removal of RhB by AC – MnO2-NC at different adsorbent dosage are shown in Figure.6. [10mg to 600mg/50mL] was tested for the dye concentrations 10, 20, 30 and 40mg/L. The adsorption increases with increase in adsorbent concentration; this is due to the increase in surface area and availability of more adsorption site. The percentage removal of RhB is greatly increases in the range of 10-600mg/50mL after that small change occur. So the optimum adsorbent carbon dosages for the experiments were carried out using 100mg/50mL. |
 |
6.3. Effect of pH |
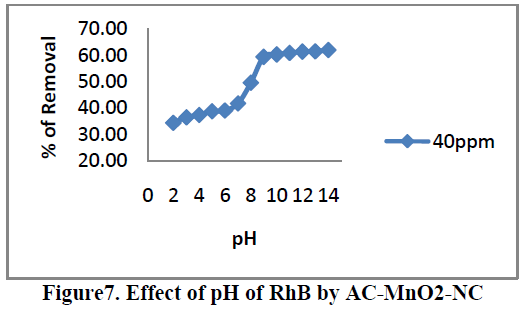
| Effects of pH on the removal of RhB by AC-MnO2-NC are shown in Figure.7. The solution pH is one of the most important factors that control the adsorption of RhB on the adsorbent material. Therefore an increase in pH may cause an increase [or] decrease in the adsorption capacity. The adsorption capacity can be attributed to the chemical form of RhB in a solution at the specific pH [or] due to different functional group on the adsorbent surface. To examine the effect of pH on the percentage removal of RhB gradually increases as the pH increases. The pH value up to 8.95 the percentage removal is up to 59.32 after that suddenly increases. At that solution pH the adsorbent surface negatively charged and favors uptake of cationic dyes due to increased electrostatic force of attraction. Therefore, all the experiments were carried out at the pH 8.95. For 40mg/L dye concentration the percent removal increased from 34.46 to 64.76 when the pH was increased from 2 to 14 and the percent removal remained almost the same above pH 9. |
 |
6.4. Effect of Temperature |
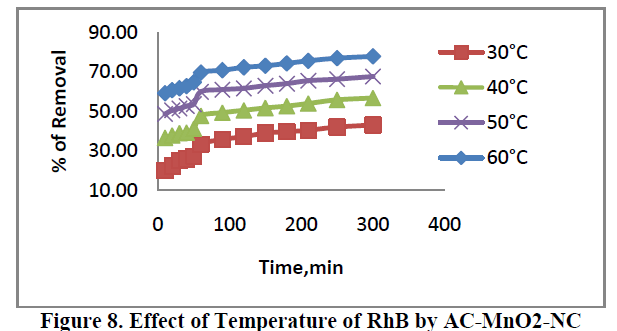
| The effect of temperature of adsorption of RhB are presented in Figure 8. For concentration 40 mg/L adsorbent was carried out at 30ïÃâð, 40ïÃâð, 50ïÃâð and 60ïÃâðC. The percent removal of dye increased from 20.04 to 77.73. This indicates that increase in adsorption with increase in temperature may be due to increase in the mobility of the large dye ions. Moreover, increasing temperature may produce a swelling effect within the internal structure of the adsorbent, penetrating the large dye molecule further. |
 |
6.5. Adsorption isotherms |
| Three different isotherm models were used to fit the experimental data the Langmuir, Freundlich and Tempkin models are given in Figure. 9, 10 and 11 and the parameter values are given in the Table 2. |
 |
 |
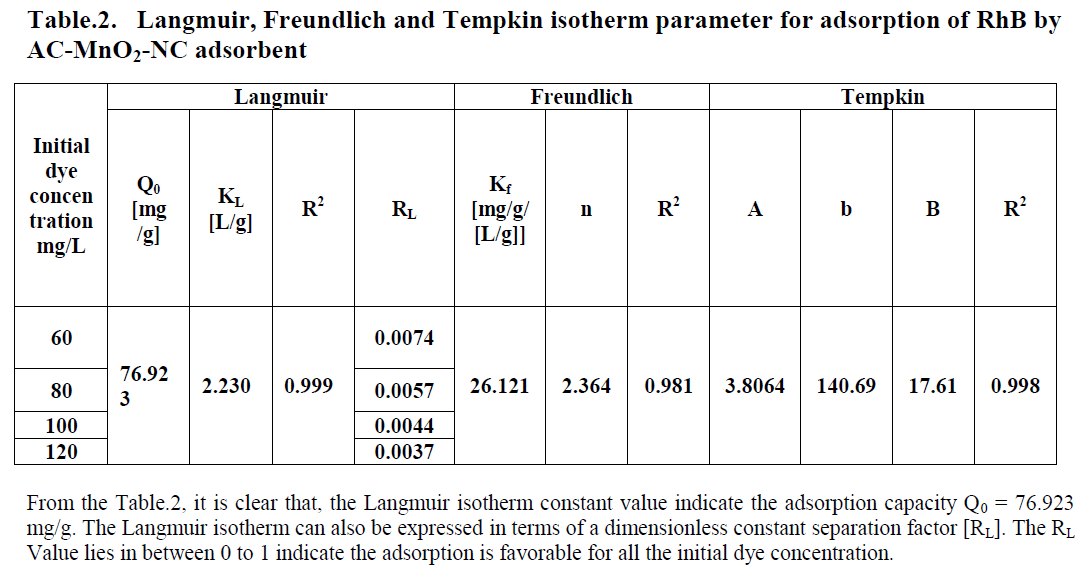 |
| From the Table.2, it is clear that, the Freundlich isotherm constant value indicate 1/n [or] n is the adsorption intensity. The ‘n’ values lies in between 1 to 10 confirm the favorable condition for adsorption. |
| From the table.1, it is clear that, the Tempkin isotherm constant value indicate maximum binding energy B= 17.61 and it is related to the heat of adsorption. |
| All the three models explain correlation co-efficient [R2]. From Table.2, RhB on AC-MnO2-NC to fit Langmuir model. This indicates monolayer adsorption. |
6.6. Adsorption Kinetics |
| The kinetics of MG dye adsorption on RhB by AC-MnO2-NC was studied with respect to different initial concentration. For evaluating the adsorption kinetics if RhB, the Pseudo first order, the pseudo second order, Elovich model and intraparticle diffusion model were used to fit the experimental data by using linear regression analysis method and it is given in Figure.12, 13, 14 and 15. The parameters of this model are summarized in Table.3. The high correlation coefficient [R2] values indicate the fitness of the model. |
 |
 |
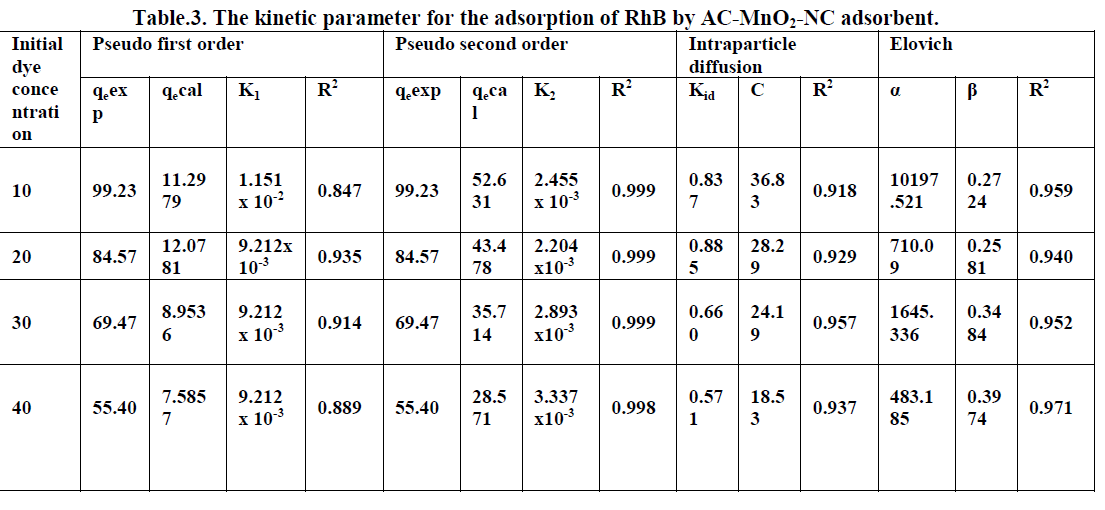 |
| From the kinetic data, the qe value calculated from the pseudo first order model is less than that of the experimental value. But the qe values calculated from the pseudo second order model are nearly equal to the experimental value. The correlation co-efficient [R2] is high for pseudo second order. So that the adsorption of RhB by AC- MnO2-NC is to follow the pseudo second order kinetic model. |
| The experimental data were used for intraparticle diffusion model, the intraparticle diffusion constant [Kid], intercept and the correlation co-efficient [R2] are calculated. From these data the intercept value indicates that the lines are not passing through origin, therefore some other process that may affect the adsorption. The correlation co-efficient [R2] is value is less than that of pseudo second order model. |
| The same experimental Tata were used for Elovich model, the initial adsorption rate [α], desorption constant [β] and the correlation co-efficient [R2] are calculated. But, the correlation Co-efficient [R2] is less than that of pseudo second order model. |
| Finally, From Table.3 indicates all these four kinetic models, RhB by AC- MnO2-NC is to follow pseudo second order kinetic model. |
6.7. Thermodynamic parameter |
| The Thermodynamic parameters for the adsorption process of RhBby AC-MnO2-NC are the changes in standard free energy change [ΔG0], standard enthalpy change [ΔH0] and standard entropy change [ΔS0] and is shown in Fig.16. The values of these parameters were calculated and are shown inTable.3 |
 |
 |
| The adsorption data indicates that ΔG° values were negative at all temperatures. The negative ΔG° confirms the spontaneous nature of adsorption of RhB by AC-MnO2-NC. The magnitude of ΔG° suggests that adsorption is physical adsorption process. The positive value of ΔH° were further confirms the endothermic nature of adsorption process. The positive ΔS° showed increased randomness at the solid – solution interface during the adsorption of RhBby AC-MnO2- NC adsorbent. |
VII. DESORPTION STUDIES |
| After activated carbon is saturated with dye molecules, different solvents could be used to regenerate the activated carbon to restore its dye adsorptive capability [30]. Desorption with acetic acid revealed that the regeneration of adsorbent was satisfactory, which confirms the physisorptive nature of adsorption. |
VIII. CONCLUTIONS |
| The present study shows that AC-MnO2-NC is an effective adsorbent for the removal of RhB from aqueous solution. Adsorption followed the Langmuir isotherms. The adsorption capacity was found to be 76.923 mgg-1. The thermodynamic parameters were found to be thermodynamically favourable physical adsorption process. Evaluation of thermodynamic parameters showed the process as endothermic and spontaneous. The kinetic parameters fit for Pseudo second order model. Desorption studies reveals that satisfactory desorption taking place confirming physisorptive nature of adsorption. Complete removal of the dye can be achieved using an appropriate dosage of the adsorbent and pH for waste waters. The results would be useful for the fabrication and designing of waste water treatment plants for the removal of dye. Since the raw material is freely available in large quantities the treatment method, seems to be economical. |
References |
|