In case of critically ill patient, it requires monitoring the patient in hospital for 24*7 bases so in order to overcome this problem, a system is designed with wireless physiological monitoring system. This paper is focused on monitoring of remote patients, after he/she is discharged from hospital. The PIC microcontroller based patient monitoring system offers a reliable, energy efficient and remote patient monitoring system using appropriate sensors and also the system able to send parameters of patient in real time. It enables the doctors to monitor patient’s parameters such as blood pressure, SpO2 and ECG in real time. Here the parameters of the patient are measured continuously and transmitted to authorized doctor through internet. Also the above parameters can be displayed as GUI using LabVIEW in patient side. This helps the patient to aware on their own health. Then the three parameters are provided dynamically to a web page in real time to be viewed by an authorized doctor, if anyone of the vital parameter goes out of normal range then an alert message as SMS is sent to the patient from the doctor side.
Keywords |
| PIC microcontroller, blood pressure, SpO2, ECG, LabVIEW, GSM, SMS. |
INTRODUCTION |
| The modern visionary of healthcare industry is to provide better health care to people anytime and anywhere in the
world in a more economic and patient friendly manner. Therefore for increasing the patient care efficacy, there arises a
need to improve the patient monitoring devices and make them more reliable. The medical world today faces two basic
problems when it comes to patient monitoring, first is the need of healthcare providers present at the bedside of the
patient and second the patient is restricted to bed and wired to large machines. In order to achieve better patient care,
the above cited problems have to be solved. As the bioinstrumentation, computers and telecommunications
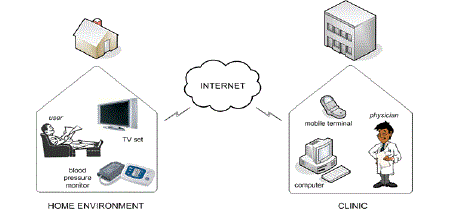
technologies are advancing, it has become feasible to design a home based vital sign Tele-Monitoring system to acquire
record, display and transmit the physiological signal from the human body to any location is shown in the figure.1
below. |
| The need for real time notification of vital signs of patient to the doctor is of prime importance, thus the need of active
database system arises and that is integrated with patient monitoring device. The importance of Patient Monitoring
System (PMS) in medical treatment is very high; therefore in recent days in medical field introducing centralized PMS.
In centralized PMS all patient monitors are connected with a single server based PMS. For a more efficient patient care
by the caregivers, the PMS must be incorporated with smart alarm systems. Thus the new PMS with intelligent alarm
system has significantly improved sensitivity of monitoring and also demonstrated the feasibility of real time learning
at the bedside. In order to alert the patient caregivers about the vital signs of patient these alarm systems are
characterized based on the signal characteristics such as for ECG, attributes like R-R interval, peak detection and for
other parameters their normal range sets the alarm system. The computer-based PMS can help improve the patient’s
awareness and understanding of his or her disease, thus the efficacy of treatment can be increased by displaying them in
a graphical user interface and also sending the clinically useful data on a personalized website[1]. The alert message is
generated by the system in two ways, first on the doctor’s mobile about the vital signs of the patient and second by an
email notification. |
SYSTEM ARCHITECTURE IN PERSONAL HEALTH TELE-MONITORING |
| The aging of population gives rise to chronic diseases in daily. Health monitoring has become more significant in
modern medical field. In recent years, the home Tele care system (HTS) has been employed in personalized
examination by miniaturization and portable auxiliary .The bio-medical signals are self-examined and transmission
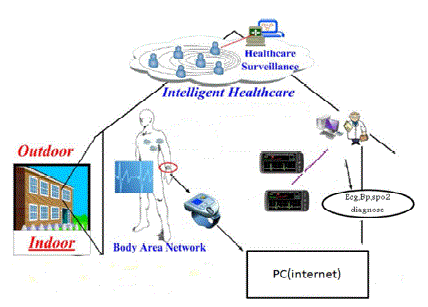
between the person and medical centre over the internet is expected to play a more prominent role in HTS .An
interactive intelligent health care and monitoring system (IIHMS)[2] is to enhance the portability and increase the
popularization of HTS. IIHMS aims to monitor patients especially those with cardiovascular disease, at any time and
place. Figure.2 below illustrates the scenarios of IIHMS heterogeneous networks with including a body area network. |
| ECG/EKG is used to measure the heart’s electrical conduction system. It picks up electrical impulses generated by the
polarization and depolarization of cardiac tissue and translates into a waveform. The waveform is then used to measure
the rate and regularity of heartbeats, as well as the size and position of the chambers, the presence of any damage to the
heart[3]. Pulse oximeter is the non-invasive method for monitoring a patient's Oxygen saturation. Blood pressure
monitoring represent the measure blood pressure in an artery and it uses oscillometric method of monitoring and that
device has a pressure sensor for sensing arterial wall vibrations. Here the microcontroller used is PIC 16F877 operate
under low power consumption with small pin count. |
BLOCK DIAGRAM OF TELE-MONITORING SYSTEM |
| The proposed system has been designed to take several inputs to measure physiological parameters of human such as
ECG, Blood Pressure and Pulse Oximeter[4]. The inputs from the sensors are integrated and processed. This measured
value has been sent to the hospital through their webpage. The history of the individual patient has been maintained by
the hospital. The vital -sign parameters of the patient is provided dynamically to a web page to be viewed by an
authorized doctor .An alert SMS will be sent to the patient indicating message received, status of normal and abnormal
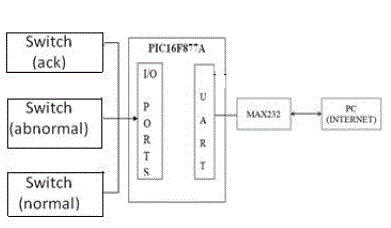
condition of the patient. In the transmitter side the data’s are collected from the sensors and are processed by the
controller and digital data’s from controller is transmitted through the Website to the receiver unit. The uploaded data
of the patient is monitored by the doctor. Using GSM, an alert message is sent to mobile to indicate the patient’s
present health status. The transmitter and receiver block diagram is shown the figure.3&4 below. |
MODULES USED IN TELE-MONITORING SYSTEM |
A. Signal Conditioning and power supply unit |
| The outputs obtained from sensors which is having low amplitude signal, so that signal conditioners circuit is used
to amplify the signals to the requirements of the receiver (circuit or equipment). Power supply is designed to convert
the voltage AC mains electricity to a suitable low voltage DC supply for electronic circuits and other devices. |
| Transformer that steps down 230V AC mains to low voltage AC, Rectifier used to convert AC to DC voltage, but the
DC that contains ripple. So smoothing is performed to smooth the DC from varying greatly to a small ripple and the
regulator which eliminates ripple by setting DC output to a fixed voltage. |
B. Microcontroller |
| Peripheral Interface Controller (PIC) is a family of microcontrollers introduced by Microchip Technology[5].
PIC microcontroller (16F877A) has attractive features and they are suitable for a wide range of applications. PIC
microcontrollers are RISC processors and uses Harvard architecture. PIC 16F877 is a family of CMOS 8-bit flash
controllers. Apart from the flash program memory there is a data EEPROM. A RISC instruction set includes fewer and
simpler instructions with hardwired control, simpler processor pipeline and a large number of registers. An inbuilt ADC
is used to convert the analog signal output from signal conditioner to digital. On chip UART transmits the signal from
controller to PC via RS232 cable. MAX232 integrated circuit is used to convert TTL logic to RS232 logic when
controller transmits the data and vice versa operation during reception. |
C. SENSORS USED |
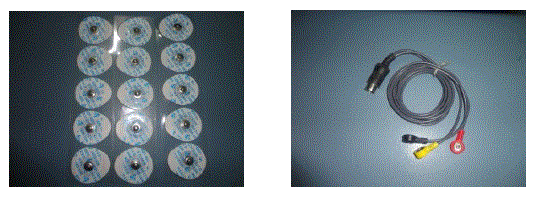
| ECG Sensor: The three electrodes with their leads are placed on the appropriate locations of the patient. The ECG
signals detected from the subject are of very low amplitude and it is amplified by the instrumentation amplifier with
sufficient gain. ECG sensor board consists of ECG electrodes and signal amplifying circuits. The task is to acquire the
data (heart signal) from the human body, amplify and filter the signal before it is sent to its destination. Microcontroller
circuit receives the acquired data in analog form and then converts it to digital signals with 8 bit resolution and a
sampling rate of 500 Hz before sending it to the personal computer (PC). The sensor gathers useful patient ECG data
and these signals have to be amplified due to the reason that signals acquired from human body are generally weak,
ranging from 0.5 mV to 5.0 mV. The amplified signals are then filtered for noise removal. |
| BP Sensor: The blood pressure sensing system reads the cuff pressure and extracts the pulses for analysis and
determination of systolic and diastolic pressure. This design uses a 50 kPa integrated pressure sensor yielding a
pressure range of 0 mm Hg to 300 mm Hg. Oscillometric method is employed by the majority of automated non
invasive devices[6]. A limb and its vasculature are compressed by an encircling, inflatable compression cuff. The blood
pressure reading for systolic and diastolic blood pressure values are read at the parameter identification point. The
simplified measurement principle of the oscillometric method is a measurement of the amplitude of pressure change in
the cuff as the cuff is inflated from above the systolic pressure. The amplitude suddenly grows larger as the pulse breaks through the occlusion. This is very close to systolic pressure. As the cuff pressure is further reduced, the
pulsation increase in amplitude reaches a maximum and then diminishes rapidly. The index of diastolic pressure is
taken where this rapid transition begins. Therefore, the systolic blood pressure (SBP) and diastolic blood pressure
(DBP) are obtained by identifying the region where there is a rapid increase then decrease in the amplitude of the
pulses respectively. Mean arterial pressure (MAP) is located at the point of maximum oscillation. |
| Pulse Oximeter Sensor: Pulse Oximetry is the non-invasive measurement of the oxygen saturation (SpO2). Oxygen
saturation is defined as the measurement of the amount of oxygen dissolved in blood, based on the detection of
Hemoglobin and Deoxyhemoglobin. Two different light wavelengths are used to measure the actual difference in the
absorption spectra of HbO2 and Hb. The bloodstream is affected by the concentration of HbO2 and Hb, and their
absorption coefficients are measured using two wavelengths 660 nm (red light spectra) and 940 nm (infrared light
spectra). Deoxygenated and oxygenated haemoglobin absorb different wavelengths. Deoxygenated haemoglobin (Hb)
has a higher absorption at 660 nm and oxygenated haemoglobin (HbO2) has a higher absorption at 940 nm Oxygen
saturation, which is often referred to as SaO2 or SpO2, is defined as the ratio of oxyhaemoglobin (HbO2) to the total
concentration of haemoglobin present in the blood (i.e., oxyhaemoglobin + reduced haemoglobin): |
 |
| Arterial SaO2 is a parameter measured with oximetry and is normally expressed as a percentage. Under normal
physiological conditions arterial blood is 97% saturated, whilst venous blood is 75% saturated. The acquired signal
from sensor is amplified and sent to the Microcontroller. The digitally converted signal is transmitted to PC and it is
displayed graphically in Lab View. The sensed data is uploaded in the particular hospital website and system generated
mail and at the same time SMS will be sent to the patient about normal/abnormal condition of health parameters. |
| LabVIEW: The LabVIEW software is used as the integrating platform for acquiring the physiological signals,
processing and transmitting the physiological data as it is an excellent graphical programming environment to develop
sophisticated measurement, test, and control systems using intuitive graphical icons and wires that resemble a
flowchart[7]. The software also includes number of advanced mathematics blocks for functions such as integration,
filter and other specialized capabilities. |
RESULT AND DISCUSSION |
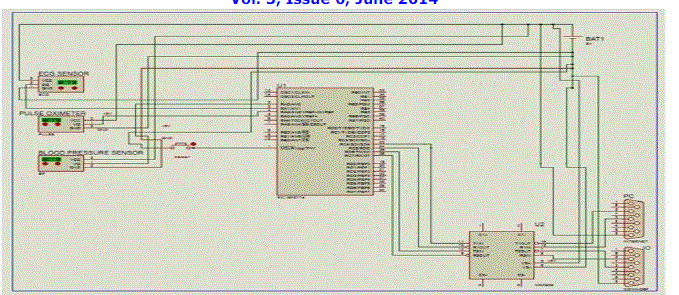
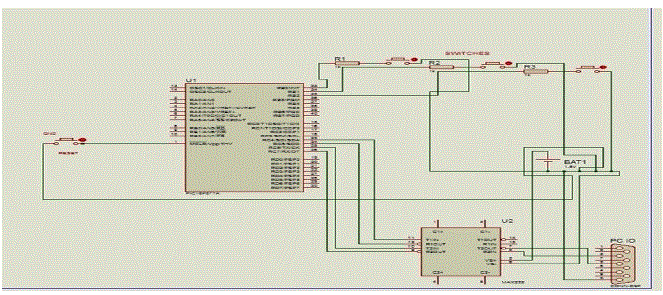
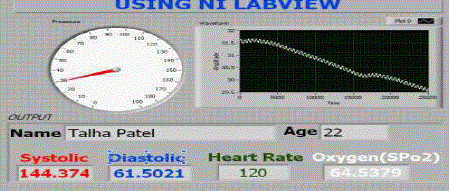
| The complete hardware circuit diagram for patient side and doctor side is shown in the figure.7&8 below. The
embedded C programming is used to program the PIC microcontroller. A sample result is displayed in the LabVIEW
software is shown in the figure.9 below. |
CONCLUSION |
| This proposed system helps the doctors to keep an eye on the heath condition of the patient on 24*7 bases and provide
proper treatment at the correct time when the patient goes to abnormal condition. The inputs from the sensors are
integrated and processed. The history of the individual patient has been maintained by the hospital. The vital-sign
parameters of the patient are provided dynamically to a web page to be viewed by an authorized doctor. An alert SMS
will be sent to the patient, indicating message received status of normal or abnormal condition of the patient. Totally
this device helps the patient to check their health regularly without going to hospital and saves the patient life in
emergency condition. |
Figures at a glance |
 |
 |
 |
 |
 |
| Figure 1 |
Figure 2 |
Figure 3 |
Figure 4 |
Figure 5 |
 |
 |
 |
 |
 |
| Figure 6 |
Figure 7 |
Figure 8 |
Figure 9 |
Figure 10 |
|
| |
References |
- Bhavin Mehta, DivyaRengarajan, Ankit Prasad, âÃâ¬ÃÅReal Time Patient Tele-monitoring System Using LabVIEWâÃâ¬ÃÂ, International Journal of Scientific & Engineering Research, Volume 3, Issue 4, April-2012.
- S. Y. Lee, L. H. Wang, and Q. Fang, âÃâ¬ÃÅA low power RFID integrated circuits for intelligent healthcare systems,âÃâ¬Ã IEEE Trans. Inf. Technol. Biomed., vol. 14, no. 6, pp. 1387-1396, Nov. 2010.
- Eric P. Wildmaier, Hershel & Kevin T. Strang, 2007, âÃâ¬ÃÅThe Human Physiology,âÃâ¬ÃÂEleventh Edition, 11th edition. McGraw-Hill Higher Education.
- Khandpur R. S, âÃâ¬ÃÅA Handbook of Biomedical Instrumentation, Tata McGraw Hill pub; India, 1993.
- http://www.microchip.com/wwwproducts/Devices.aspx?dDocName=en010242#documentation
- R. PallÃÆás-Areny and J.G. Webster, Sensors and Signal Conditioning, New York: John Wiley & Sons, 1991
- Gupta Sanjay, Joseph John âÃâ¬ÃËVirtual instrumentation using Lab- VIEWâÃâ¬ÃÂ, Electrical Engineering Series, Tata McGraw Hill pub. India, 2006.
|