ISSN ONLINE(2319-8753)PRINT(2347-6710)
ISSN ONLINE(2319-8753)PRINT(2347-6710)
A.Rajalakshmi1, D.Vijayakumar2, Dr. K .G. Srinivasagan3
|
| Related article at Pubmed, Scholar Google |
Visit for more related articles at International Journal of Innovative Research in Science, Engineering and Technology
Cloud computing platform is getting more and more attentions as a new trend of data management. Data replication has been widely used to speed up data access in cloud. Replica selection and placement are the major issues in replication. In this paper we propose an approach for dynamic data replication in cloud. A replica management system allows users to create, register and manage replicas and update the replicas if the original datasets are modified. The proposed work concentrates on designing an algorithm for suitable optimal replica selection and placement to increase availability of data in the cloud. Replication aims to increase availability of resources, minimum access cost, shared bandwidth consumption and delay time by replicating data. Our approach based on dynamic replication that adapts replica creation continuously changing network connectivity and users. The proposed systems developed under the Eucalyptus cloud environment. The results of proposed replica selection algorithm achieve better accessibility compared with other methods.
Keywords |
| online oversampling PCA, Online updating Technique, Outlier detection |
INTRODUCTION |
| Anomaly detection (also known as outlier detection) is the search for items or events which do not conform to an expected pattern. The patterns thus detected are often translate to critical and actionable information in several application domains. Anomalies are also referred to as outliers, change, deviation, surprise, aberrant, peculiarity, intrusion, etc. In particular in the context of abuse and network intrusion detection, the interesting objects are often not rare objects, but unexpected bursts in activity. This pattern does not adhere to the common statistical definition of an outlier as a rare object, and many outlier detection methods (in particular unsupervised methods) will fail on such data, unless it has been aggregated appropriately. Instead, a cluster analysis algorithm may be able to detect the micro clusters formed by these patterns. |
| Outlier detection aims to identify a set of instances which varies remarkably from the existing data. The outlierness of the data instance can be determined by the variation of the resulting principle directions.i.e. The meaning of “Anomaly” is said as observation which deviates so much from other observations as to arouse suspicions that it was generated by a different mechanism, which gives the general idea of an anomaly and motivates many outlier detection methods. Practically, anomaly detection can be found in many real time applications such as homeland security, credit card fraud detection, intrusion detection and insider threat, Identification in cyber-security, or malignant diagnosis. However, since only a limited amount of labelled data are available in the above real world applications. Anomaly detection needs to solve an unsupervised yet unbalanced data learning problem. More precisely, the difference between the two eigenvectors will indicate the anomaly of the target instance. By ranking the difference scores of all data points, one can identify the outlier data by a predefined threshold i.e. if it exceeds the threshold value or by a predetermined portion of the data, this framework can be considered as a decremental PCA (dPCA)-based approach for anomaly detection. Though the dPCA works well for the moderate size of dataset, the variation of principle direction might be insufficient when there is larger dataset. |
RELATED WORK |
| The existing approaches can be categorized into statistical (distribution), distance and density-based methods. For the distance-based methods the distances between each data point of interest and its neighbours are calculated. If the result is above some predetermined threshold, the target instance will be considered as an outlier. While no prior knowledge on data distribution is needed. This type of approach will result in determining improper neighbours, and thus outliers cannot be correctly identified in a multi clustering structure. In [3] a new method to detect the outliers using a measure called Commute Distance (CD) has been used.CD between two nodes say n and m in graph is no. of steps on the random walk, starting from n will take to visit m and then back to n for the first time. It is a robust measure for detecting both local and global outliers. |
| C (n, m) = h (n, m) +h (n, m) |
| The sampling strategy called component sampling has been used. The nodes are selected at random & a graph is sampled. |
| C (n, m) = VG(Lnn+Lmm-2Lnm) |
| The CD can be computed from the graph laplacian matrix. This approach might encounter problems when the data distribution is complex. To overcome the problem in existing, density-based methods are proposed. In [1] one of the representatives of this type of approach is used known as density-based local outlier factor (LOF) to measure the outlierness of each data instance, assigning each point with the degree of being an outlier. The degree depends on the object with respect to its neighbourhood. Based on the local density of each data instance, the LOF determines the degree of outlierness, which provides suspicious ranking scores for all samples. |
 |
| The most important property of the LOF is the ability to estimate local data structure via density estimation. This allows users to identify outliers which are sheltered under a global data structure. In [7] the angle-based outlier detection (ABOD) method has been used. ABOD calculates the variation of the angles between each target instance and the remaining data points, since it is observed that an outlier will produce a smaller angle variance than the normal ones do. Angle based outlier factor is assigned for each object in database db. The angle is weighted less if the corresponding points are far from query points. The ranking of these points, the top ranked point (rank 1) is clearly the utmost outlier. The lowest ranks are assigned to inner points of clusters. Consequently, a fast ABOD algorithm is proposed to generate an approximation of the original ABOD solution. The difference between the standard and the fast ABOD approaches is that the latter only considers the variance of the angles between the target instance and its k nearest neighbors. However, the search of the nearest neighbors still prohibits its extension to large scale problems (batch or online modes), since the user will need to keep all data instances to calculate the required angle information. |
| Statistical approaches assume that the data follows some standard or predetermined distributions, and this type of approach aims to find the outliers which deviate from such distributions. In [5] an outlier in a set of data is an observation that appears to be inconsistent with the remainder of that set of data. In order to discard the outliers here, outlier values should be checked for consistency with the assumed distribution whether assumed distribution is appropriate, thus to discard the outlier two things have been checked i.e. whether there is a very low probability that the outlier value belongs to the assumed distribution. Second, should make sure that it is not part of continuous tail o f high values. Both of these checks require the ability to calculate percentiles of the assumed distribution. However, most distribution models are assumed univariate, and thus the lack of robustness for multidimensional data is a concern. Moreover, since these methods are typically implemented in the original data space directly, their solution models might suffer from the noise present in the data. Nevertheless, the assumption or the prior knowledge of the data distribution is not easily determined for practical problems. In [10] the anomaly detection methodology called Conditional Anomaly Detection (CAD) has been used. It takes in to account the difference between the user specified environmental and indicator attributes during the anomaly detection process, this method analyses the baseline data and learns which attributes the user decides should be directly indicative of an anomaly. When a subsequent data point is observed, it is labelled anomalous or not depending on how much its indicator attribute values defer from the usual indicator attributes values. If no such relationships present on the baseline data, then CAD will effectively ignore the environmental attributes. In [13] a novel intrusion detection method based on Principle Component Analysis has been used, by which the intrusion detection can be employed in a lower dimensional subspace. Given a training set of data vectors x1, x2…. xm , the average vector μ and each mean adjusted vector can be computed. |
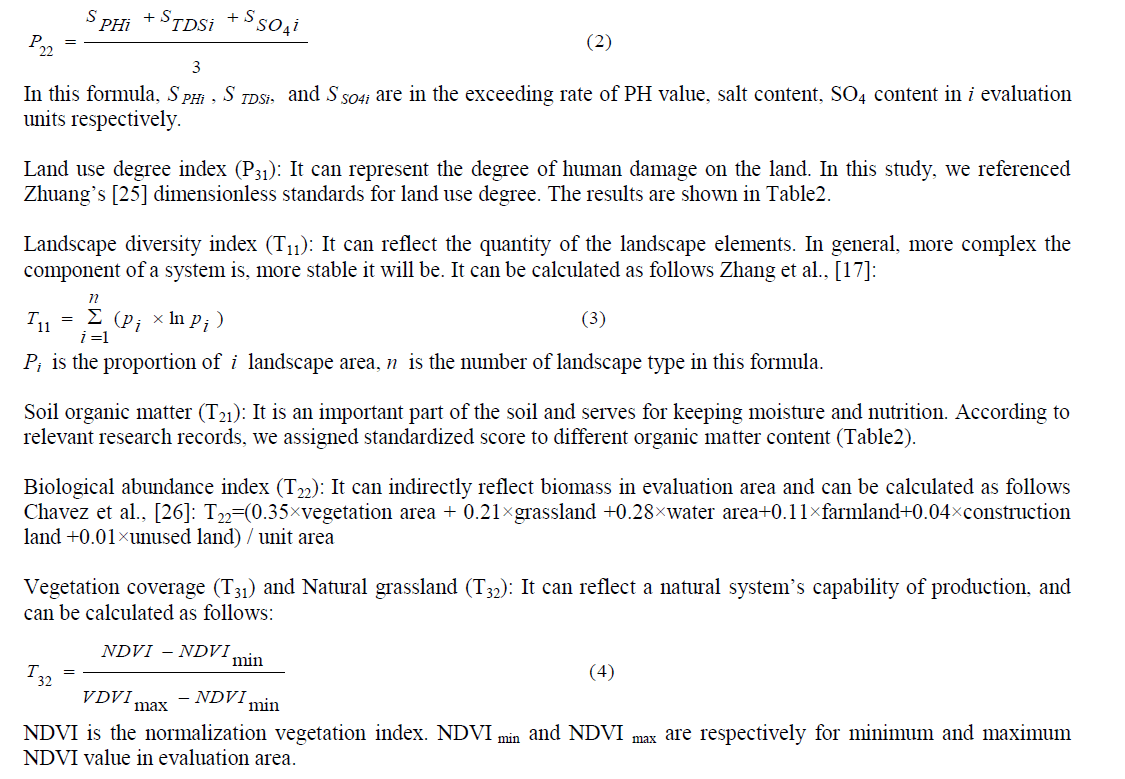 |
| In the procedure of anomaly detection, ε 1, ε2 are considered as detection index. If either ε 1, ε2 are below a predetermined threshold, the test data t is then classified as normal otherwise as anomalous. In [12] a survey is made on anomaly detection. Anomaly detection is related to, but distinct from noise removal and noise accommodation, both of which deal with unwanted noise in the data. Anomaly detection is related to novelty detection. The distinction between novel patterns and the anomalies is that the novel patterns are typically incorporated into the normal model after being detected. An important aspect of anomaly detection technique is the nature of the desired anomaly, anomalies can be classified in to three categories i.e. If an individual data instance can be considered as anomalous with respect to the rest of data, then the instance is termed as point anomaly. If a data instance is anomalous in a specific context, then it is termed as contextual anomaly. If a collection of related data instances is anomalous with respect to the entire dataset, it is termed as collective anomaly. Typically, the outputs produced by the anomaly detection techniques are one of the two types such as scores and labels. i.e. scoring techniques assign an anomaly score to each instance in the test data depending on the degree to which that instance is considered an anomaly. Thus the output of such techniques is a ranked list of anomalies. In Label category it assigns a label to each data instance, this can be controlled indirectly through parameter choices |
| A. Detection of Problem |
| a. LOF, the approach used here is worth noting that the estimation of local data density for each instance is very computationally expensive, especially when the size of the data set is large. |
| b. Major concern of ABOD is the computation complexity due a huge amount of instance pairs to be considered. |
| c. Some online or incremental based anomaly detection methods have been recently proposed, their computational cost or memory requirements might not always satisfy online detection scenarios. |
| d. The well known power method is able to produce approximated PCA solutions, but it cannot be easily extended for streaming data and for online settings. |
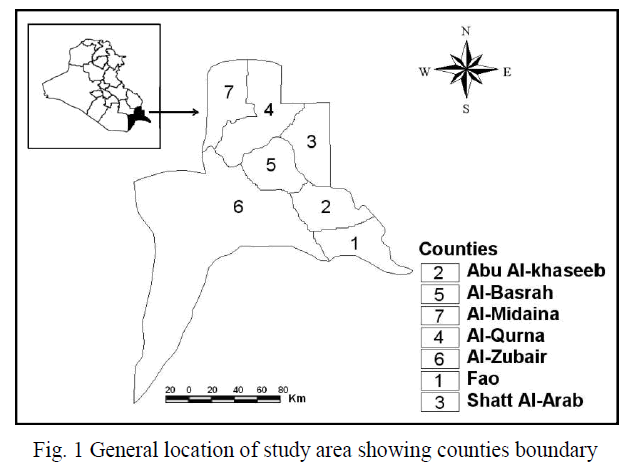
PROPOSED FRAME WORK & IMPLEMENTATION |
 |
| A. Dataset and Pre-processing |
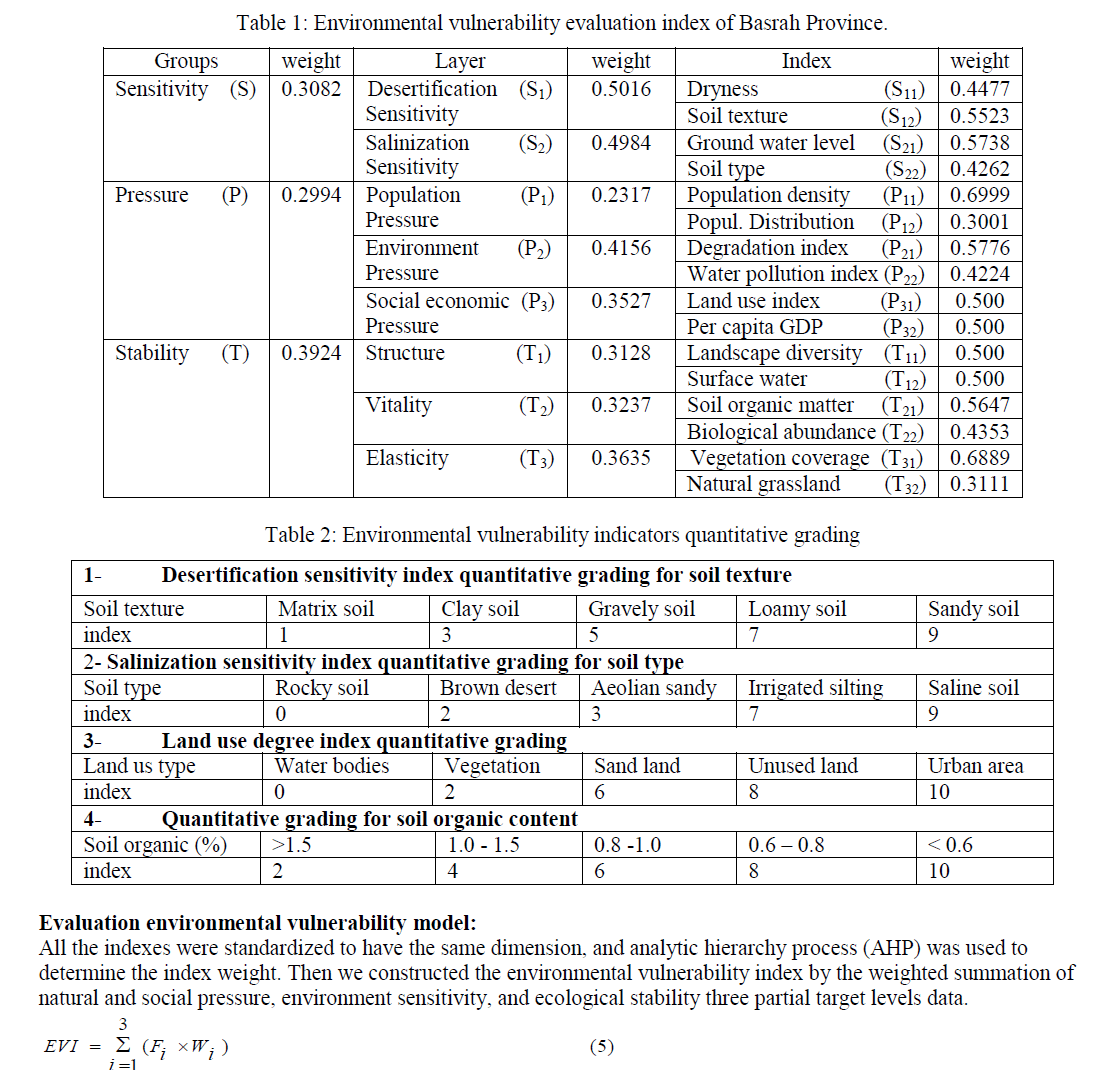 |
| The Method starts with collecting a benchmark dataset to start the analysis.The data sets are from the UCI repository of machine learning data archive. The data sets were meant for binary classification.In that the majority class as normal data and randomly select one percent data instances from the minority class as outlier samples.The Unformatted data such as noisy, incomplete datas are filtered. |
| From the UCI repository of machine learning data archive, the Adult dataset is chosen. The Adult Data set is given as input, pre-processing is done on this data set, this process filters the unformatted data. In the stage of pre processing the incomplete data, noisy data, and the inconsistent data are reduced. The original data set consists of 224 data instances. After the filtering process it has been reduced to 201 records. i.e. The age of adult starts from 18, hence the data instances that are below the value are reduced. |
| B. Principal Direction Computation |
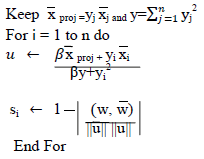
| The oversampling PCA scheme will duplicate the target instance multiple times,and the idea is to amplify the effect of outlier rathar than that of normal data.The OSPCA method aims to efficiently determine the anomaly of each target instance without sacrificing computation and memory efficiency.If the target instance is an outlier this scheme allows to emphasize its effect on the most dominant eigenvector,thus it enables to focus on extracting and approximating the dominant principal direction in the online fashion.To calculate the directions for the dataset A with n data instances,extract the dominant principal direction u from it and then compute the leading direction ~ u from it without the target instance say yt, present in it,the procedure is repeated n times with the online updating in order to identify the outliers in the large dataset. i.e Compute first Principal direction u |
 |
| Once the pre-processing done on the data set, the remaining 201 data instances are selected to perform the oversampling. The oversampling process duplicates the target instance multiple times, it aims to determine anomaly of each target instance. This stage amplifies the effect of outlier rather than normal data. After the oversampling, it consists of 603 data instances. Oversampling is done in order to create duplicates of the data instances to efficiently improve the outliers. |
| Once the oversampling performed on the data instances, the pattern is generated on the adult dataset, matrix values are needed in order to do calculate the covariance matrix. Hence, the data instances are formed as columns under their category. |
| The generated pattern pattern is formatted .i.e., the valid inputs are only extracted and used for further process, in the adult data set when the pattern is generated it contains certain labels of the categories such as work class, education, marital status, which is then made as valid inputs i.e., numerical values in order to calculate the covariance matrix, for each column in the pattern the covariance matrix is calculated and it is given as input to calculate the Eigen value with which the resultant Eigen vector is obtained. Say if there are 400 data instances in order to calculate the Eigen vector we need to remove the first data instance and compare it with the Eigen value which is calculated for total dataset, again for the second data another data instance is removed and the remaining values are compared with the total dataset. The process is continued for all the data instances and the dataset that is has the most variation will be considered as outlier. In this oversampling PCA is a drawback of computations hence an online updating technique has been proposed. |
| C. Eigen vector using Online Updating |
| The matrix updating technique and the power methods has been used to solve the oversampling Principal Component Analysis for outlier detection. However, the major drawback of the power method is that it does not guarantee a fast convergence. Moreover, the use of power method still requires the user to keep the entire covariance matrix, which prohibits the problems with the high dimensional data or with the limited memory resources. Hence an online updating technique has been used in order to keep the dominant Eigen vector when the target instance is oversampled. By solving the least squares problem, the reconstruction error of the quadratic form which is the function of u, has been computed. |
| This online updating process is feasible when outliers are detected in online or in streaming data. While oversampling there will be creation of duplicates. This projection provides a fast calculation of principle directions in the oversampling principal component analysis. i.e. the Eigen vector value which is already computed can be used , no need to calculate again when the same data instance is repeated again. Hence this process does not need to keep the entire covariance or the outer matrix throughout the entire updating process, since these only needs to calculate the principal component analysis offline. |
| D. Outlier Detection |
| The principle direction has been computed which is nothing but the Eigen vectors. Once these Eigen vectors ~ ut are obtained, the absolute value of the cosine similarity has been used to measure the variation of the principal direction. |
 |
| The cosine similarity st can be considered as the “score of outlierness”, which indicates the anomaly of the target instance. The influence of the target instance in the resulting principal direction can be viewed as a cosine similarity. |
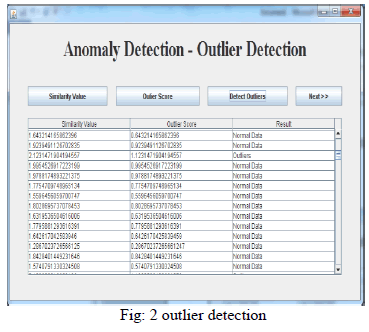
| Based on the cosine similarity the similarity value are generated which is used to detect the target instance if it is higher than a threshold value, then the instance is identified as an outlier. i.e. the threshold value can be set manually based on the number of data instances and the number of columns generated on pattern extraction. The anomalies are detected effectively and thus outliers are displayed separately from the normal data. |
 |
 |
 |
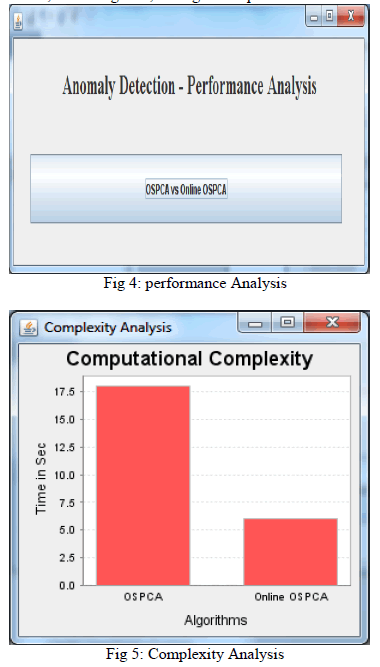
| The main advantage the online updating with the osPCA Compared to the power method or other popular anomaly detection algorithms, is the required computational complexity and memory requirements are significantly reduced, and thus this online oversampling principle component analysis method is especially preferable in online, streaming data, or large scale problems. |
 |
CONCLUSION |
| An online anomaly detection method based on oversample PCA, and thus can successfully use the variation of the dominant principal direction to identify the presence of rare but abnormal data, online osPCA is preferable for online large-scale or streaming data problems, compared with other anomaly detection methods, this approach is able to achieve satisfactory results while significantly reducing computational costs and memory requirements. This paper provides a solution to the curse of dimensionality problem in the pair wise scoring techniques. Using dynamic programming alignment matrix is calculated.(similar to Needleman- Wunschmethod).The scoring method is used to calculate alignment matrix. Trace back begins at the element in the matrix with the maximum score.Traceback continues until a cell with a score of zero is reached. Local alignment based on trace back path has been calculated. |
FUTURE WORK |
| Future research will be directed to the following anomaly detection scenarios: normal data with multi clustering structure. This proposed work is to cluster the high dimensional data using enhanced k-means clustering process based on the categorical and mixed data types in efficient manner and apply Online OS PCA to detect outlier. The goal is to use detect outliers on high dimensional categorical data that works well. In addition, also the study the quick updating of the principal directions for the effective computation and satisfying the on-line detecting demand will be made. For the former case, it is typically not easy to use linear models such as PCA to estimate the data distribution if there exists multiple data clusters. Moreover, many learning algorithms encounter the “curse of dimensionality” problem in an extremely high-dimensional space. |
References |
|