ISSN ONLINE(2319-8753)PRINT(2347-6710)
ISSN ONLINE(2319-8753)PRINT(2347-6710)
Shilpa S Kulkarni1, Shreenidhi R Kulkarni2, Suraj J Patil2
|
| Related article at Pubmed, Scholar Google |
Visit for more related articles at International Journal of Innovative Research in Science, Engineering and Technology
Since times, uncontrolled human population growth has been posing a threat to the earth‟s resources and to the habitats themselves. Population of India has been increasing dramatically since late 1900‟s. India as a developing nation should deal quite tactfully with this issue. We work here to estimate the population growth of India since 2009 to 2012 using the logistic model approach and give a comparison with actual population of India for the same time period. An error equation is also deduced based on the trend line for the specified time period and the population of India for the year 2013and onwards till 2025 is estimated. The time required for India to reach its carrying capacity is also discussed. A relevant conclusion is also made based on the obtained results. This work will provide an insight to the changing trends with respect to India‟s population growth.
Keywords |
| Population growth, Estimation of Population, Future prediction, Logistic model, Population trend. |
NOTATIONS |
 |
I. INTRODUCTION |
| A population model is a type of mathematical model that is applied to the study of population dynamics. Modelsallow a better understanding of how complex interactions and processes work. Modeling of dynamic interactions in nature can provide a manageable way of understanding how numbers change over time or in relation to each other. Many, if not all, of Earth‟s processes affect human life. The Earth‟s processes are greatly stochastic and seem chaotic to the naked eye. However, a plethora of patterns can be noticed and are brought forth by using population modeling as a tool. There are various methods to develop a population model. A simple exponential model gives sufficient approximation in estimation of population but does not defines a saturation point. Hence the population estimated increases exponentially without any upper limit giving an unrealistic figure for longer time period. This is because it does not considers the environmental factors and hence suitable for very short period of time. Logistic model tells that the population growth rate decreases as the population reaches the carrying capacity or saturation point of the environment. The logistic model is more accurate than the exponential model [1]. Much work has been done to further develop these models so as to predict population growth accurately. In this paper we propose to estimate the country‟s population for the years 2013 and onwards till 2025. |
II. LITERATURE SURVEY |
| J. N.Kapur and Q. J. A. Khan [2] talk about the simple model of population growth in their work “Some Mathematical Models for Population Growth”. This simple model only considers the excess of births over deaths per unit time and does not account for the limitation of resources. Hence a suitable parameter is considered to modify the simple model using logistic law. This form is known as simple logistic model. The authors also indicate that this modified model explained very well growth of bacterial colony in a nutrient medium and also been successfully used to fit the data for human population. An S-shape curve is obtained when the population is plotted against time. Apart from this the authors have proposes their own models to predict the population of bacteria. In the book “Spreadsheet Exercises in Ecology and Evolution”, the authors Donovan and Welden [3] tell that the Logistic model with explicit carrying capacity is most convenient way to study population growth as the related equation contains few parameters. They also hint that the solution for basic equation of continuous-logistic model can be obtained by integrating the equation. More details of this solution are discussed later in this paper. A report “Population Growth: Trends, Projections, Challenges and Opportunities” published by Planning Commission, Government of India [4] shows us the trend of decreasing birth from 1901. The report also tells us that the death rate is much lesser than the birth rate hinting net increasing population of India. Carl Haub and O. P. Sharma [5] have shown the increasing population trend in their work “India‟s Population Reality: Reconciling Change and Tradition”. It can be seen that the population of India has drastically increased in late 1900‟s. C M Lakshmana [6] in his paper “Population, Development and Environment in India” show that the population growth of India has decreased from 2001 to 2011 as compared to the previous decade. He also points out that the increasing population of India is main reason behind the environment degradation. He suggests that immediate remedial actions have to be taken to reverse the degrading trend. From [2] and [3], it can be concluded that with predate population data Logistic model works accurately in estimation of population of India. From [4], [5] and [6], we conclude that it is necessary to estimate the population of India yearly rather that projecting it as per census. This is important to understand the changing population trend for planning and implementation of policies related to population, environment and economy of India. Hence we intend to estimate the population growth of India using logistic model from year 2009 to 2012 by using available predate population data for the year 2007 and 2008. To analyze the error pattern by comparing the estimated population with actual population and to deduce an error equation based on error pattern. We also intend to incorporate the error equation with the logistic model and project the population growth of India for the year 2013 and onwards till 2025. |
III. LOGISTIC DIFFERENTIAL EQUATION AND ITS ANALYTICAL SOLUTION |
 |
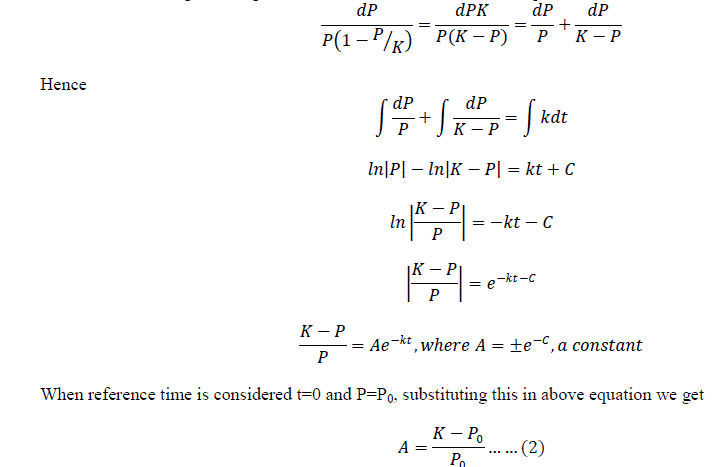 |
| The notations of time and population for the year 2013 and onwards till year 2025 are continued after the notations for year 2012 in similar manner. Carrying capacity „K‟: Gretchen C. Daily and Paul R. Ehrlich [8] in their paper mention about India‟s carrying capacity as 2 billion. The constant „A‟: The term „A‟ in equation (2) is obtained by substituting the carrying capacity and reference population that is population of India for the year 2007 (from table 1). The obtained value of term „A‟ is 0.725483734. |
| Maximum growth rate „k‟: The term „k‟ in logistic equation (3) is a constant and can be determined by using the population of India for the year 2007 and 2008. The estimation of “k” is as shown: The logistic equation (3) is rewritten for year 2008, that is when t=t1 and P=P1 as |
 |
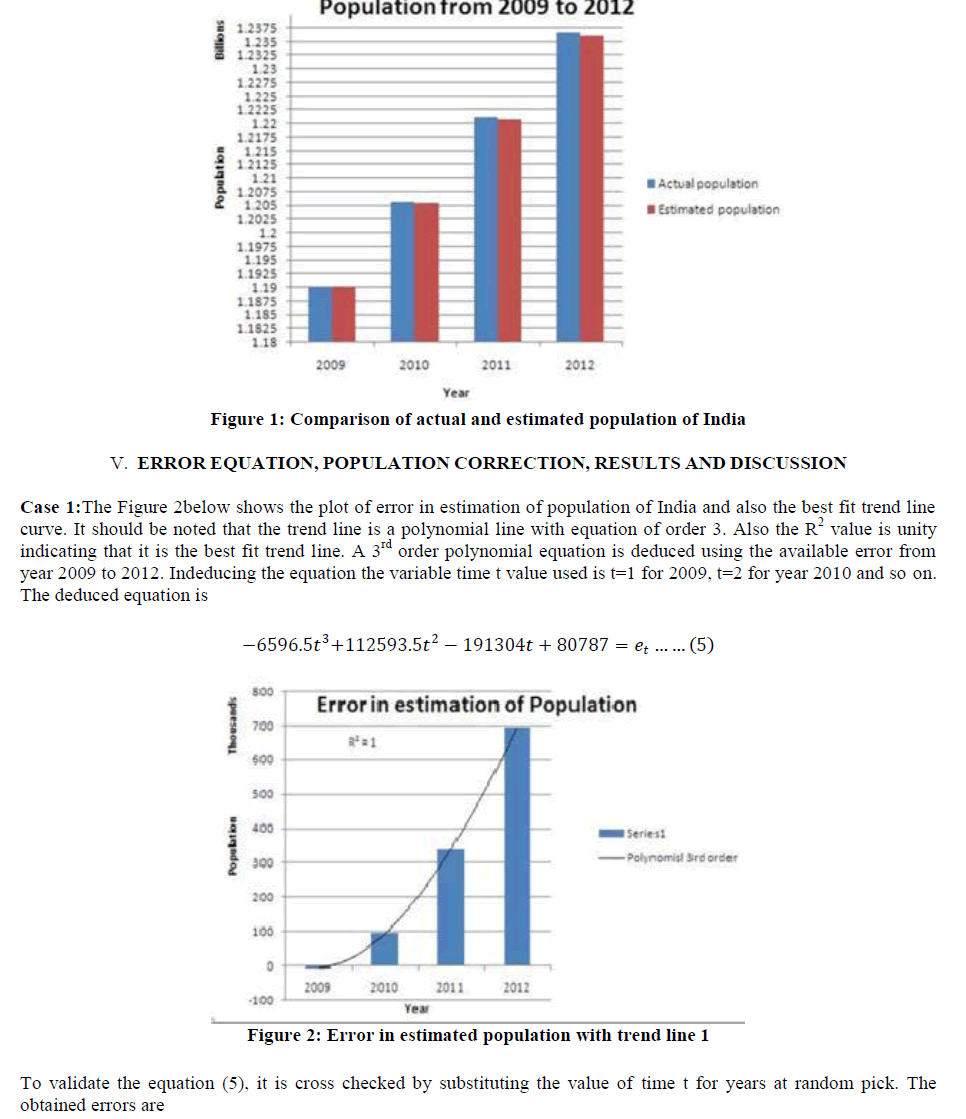 |
| Year 2013, t= 5, e5= 1114542, Year 2014, t=6, e6= 1561485, Year 2015, t=7, e7= 1996141, Year 2020 t= 12, e12= 2599851, Year 2018, t=10, e10= 2830597, Year 2019, t=11, e11= 2810215, Year 2107, t=100, e100= -5489614613. It can be observers from error e10, e11 and e12 for the year 2018, 2019 and 2020 that the error value is decreasing and for the year 2107 the error value reaches to around 5.5 billion with a negative sign. As per logistic model the population for year 2107 is estimated to 1.94 billion. This implies that the corrected population for the year 2107 would be approximately1.94 billion+ (-5.5 billion) = -3.56 billion. |
This value seems to unrealistic and treacherous. Hence the polynomial trend line of order 3 is discarded. |
| Case 2: The figure 3 shows the plot of error in estimation of population of India and also the next best fit trend line curve. It should be noted that the trend line is a polynomial equation of order 2. Also the R2 value is 0.999 indicating that it is the best fit trend line.A 2ndorder polynomial equation is deduced using the available error from year 2009 to 2012. In deducing the equation the variable time t value used is similar to case 1. The deduced equation is |
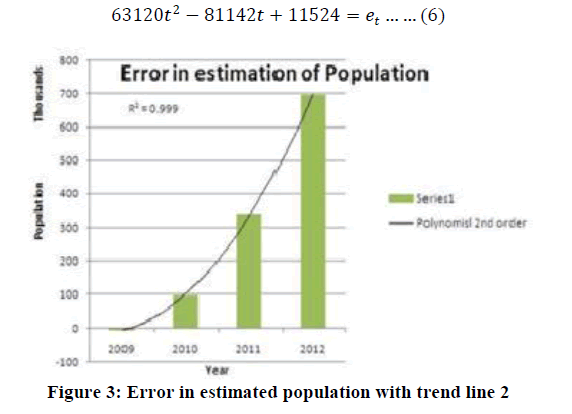 |
| To validate the equation (6), it is cross checked by substituting the value of time t for years at random pick. The obtained errors are Year 2013, t=5, e5= 1183814, Year 2014, t=6, e6= 1796992, Year 2015, t=7, e7= 2536410, Year 2020, t=12, e12= 8127100, Year 2018, t=10, e10= 5512104, Year 2019, t=11, e11= 6745482, Year 2107, t=100, e100= 623097324. It can be observers from error e10, e11 and e12for the year 2018, 2019 and 2020 that the error values are in good agreement. For the year 2107 the error value reaches to around 0.62 billion. As per logistic model the population for year 2107 is estimated to 1.94 billion. This implies that the corrected population for the year 2107 would be approximately1.94 billion+ 0.62 billion = 2.56 billion. |
This value seems to unrealistic and treacherous as the population is crossing the carrying capacity. Hence the polynomial trend line of order 2 is discarded. |
| Case 3: The figure 4below shows the plot of error in estimation of population of India and also another trend line curve. It should be noted that the trend line is a linear line. Also the R2 value is 0.944 indicating that it is a good trend line.A linear equation is deduced using the available error from year 2009 to 2012. In deducing the equation the variable time t value used are similar to case 1 and case 2. The deduced equation is |
| 234450�� − 304070 = ���� … … 7 |
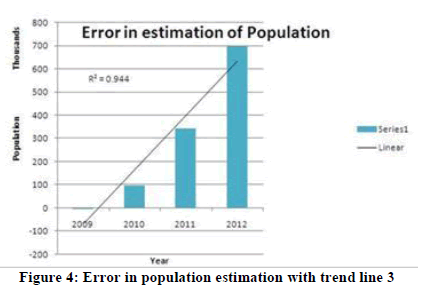 |
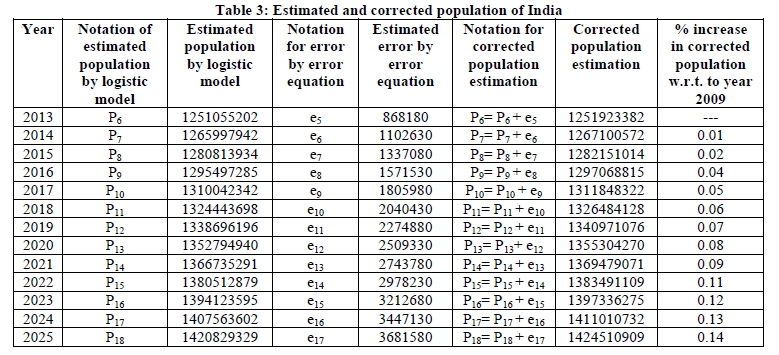
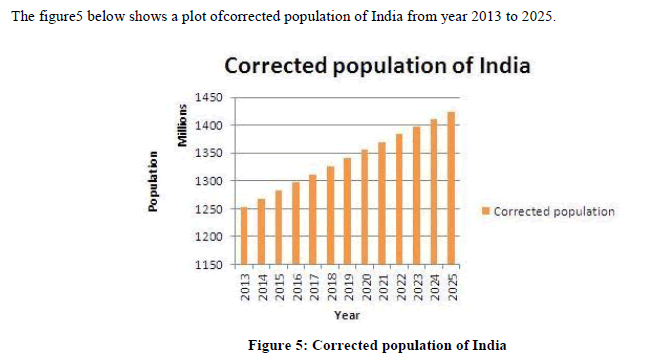
| To validate the equation (7), it is cross checked by substituting the value of time t for years at random pick. The obtained errors are Year 2013, t=5, e5= 868180, Year 2014, t=6, e6= 1102630, Year 2015, t=7, e7= 1337080, Year 2020, t=12, e12= 2509330, Year 2018, t=10, e10= 2040430, Year 2019, t=11, e11= 2274880, Year 2107, t=100, e100= 23140930. It can be observers from error e10, e11 and e12for the year 2018, 2019 and 2020 that the error values are in good agreement. For the year 2107 the error value reaches to around 0.024 billion. As per logistic model the population for year 2107 is estimated to 1.94 billion. This implies that the corrected population for the year 2107 would be approximately1.94 billion+ 0.024 billion = 1.964 billion. This value seems to be realistic and satisfactory, though the value is approaching the carrying capacity of India it can still be used for short time period. Hence the linear trend line is acceptable. Though the R2 value is less than case 1 and case 2 indicating decrease in accuracy of error estimation. The linear trend line gives realistic results. Estimated and corrected population of India from 2013 to 2025: the table 3 below shows the estimated population, the projection of corrected population of India using the logistic model and the linear error equation from case 3 and percentage increase in population with respect to year 2009. |
 |
 |
VI. CONCLUSION |
| Projection of population growth of India is important form sustainability point. The environment should be able to support the population, for this not only the environment but the nation should also contribute to control the population growth. The logistic approach is a good tool to predict population of India and any habitat in general. Though the estimated population consists of some errors the accuracy of prediction can be improved by incorporating an error equation. In this work an attempt of minimizing the error in prediction of population of India has been reduced to certain extent by incorporating a linear error equation. This error equation though holds good for short time period, certainly improves the result. The results can be improved by incorporating factors of correction like the constant „A‟ and the constant „k‟ in logistic equation which tend to change as the reference year or time zero year changes. It should also be noted that for India to reach its carrying capacity of 2 billion, it would take more than a century.To sun up all the discussion it is concluded that the logistic approach incorporated with error equation is a good tool in population estimation. |
References |
|