ISSN ONLINE(2319-8753)PRINT(2347-6710)
ISSN ONLINE(2319-8753)PRINT(2347-6710)
| Dr.G.Brindha Associate professor, Dept Of MBA, Bharath university ,Chennai – 73, India |
| Related article at Pubmed, Scholar Google |
| Dr.G.Brindha Associate professor, Dept Of MBA, Bharath university ,Chennai – 73, India |
| Related article at Pubmed, Scholar Google |
Visit for more related articles at International Journal of Innovative Research in Science, Engineering and Technology
Making an investment on shares, debenture, and bonds are both profitable and exciting, but it involves a high amount of risk and it requires analytical skills. If an investor wants to make a profit out of above said securities, he must have considerable financial acumen as well as capable of facing risk. Now a day, Most of the peoples have inclination to make an investment on various portfolios such as Shares, Debenture, Bonds. But, they are unable to manage them prudently. So this article has been prepared with a view to providing suggestion to manage their portfolio in an effective way by using RSI (Relative strength Index) and ROC (Rate of Change).
INTRODUCTION |
| Meaning: |
| Portfolio refers to combination securities such as shares, debentures…etc. Portfolio Management refers to diversification of investment with a view to minimizing the risk and maximizing the returns. It serves as platform for the investors to diversify their portfolio among various investment avenues. |
| Definition: |
| The art and science of making decisions about investment mix and policy, matching investments to objectives, asset allocation for individuals and institutions, and balancing risk against performance. |
| Portfolio management is all about strengths, weaknesses, opportunities and threats in the choice of debt vs. equity, domestic vs. international, growth vs. safety, and many other tradeoffs encountered in the attempt to maximize return at a given appetite for risk |
| Objectives: |
| 1. To discuss the concept of portfolio management. |
| 2. To analyze the risk and return of various investment avenues. |
| 3. To evaluate the performance of portfolio over a period of time. |
| Scope of the study: |
| 1. It helps the investors to take appropriate investment decision. |
| 2. It emphasizes wealth and profit maximization. |
| 3. It helps in long- term investment decision. |
| 4. It helps the investors to know the various risk associated with the return. |
| Need of the study: |
| 1. Investor can generate highest return at a given level of risk. |
| 2. It helps to identify the non -performing securities in the investment process and for improving these areas. |
| 3. It helps the investors to choose the optimal portfolio. |
| 4. Effective utilization of resources. |
| 5. Diversification of investment leads to minimization of risk. |
| Tools used in Portfolio Management: |
| Rate of Change: |
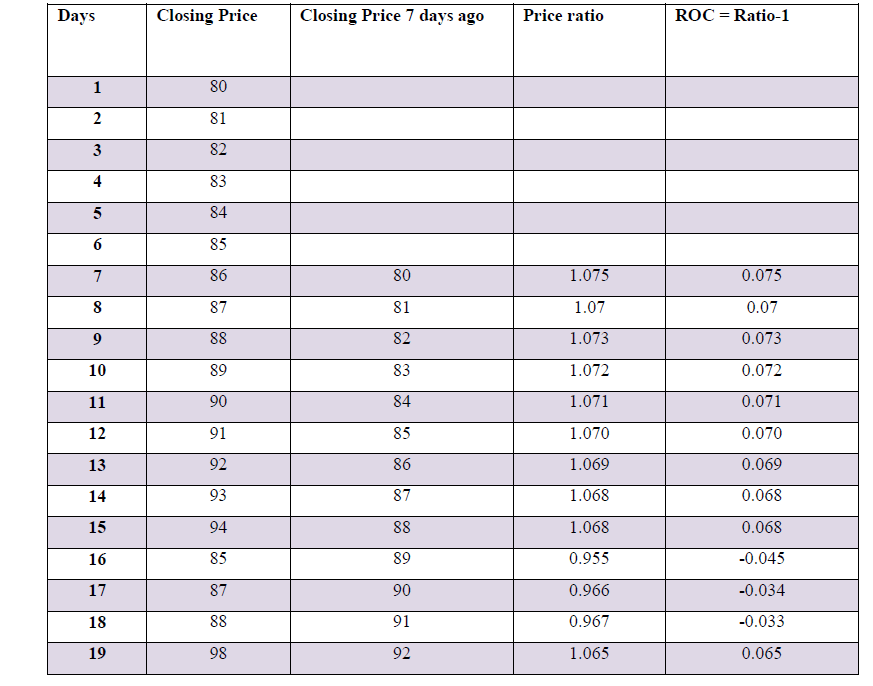
| The Rate of Change (ROC) indicator measures the percentage change of the current price as compared to the price a certain number of periods ago. The ROC indicator can be used to confirm price moves or detect divergences; it can also be used as a guide for determining overbought and oversold conditions. |
 |
| Stock price of Narmada Pvt. Ltd is given below |
 |
 |
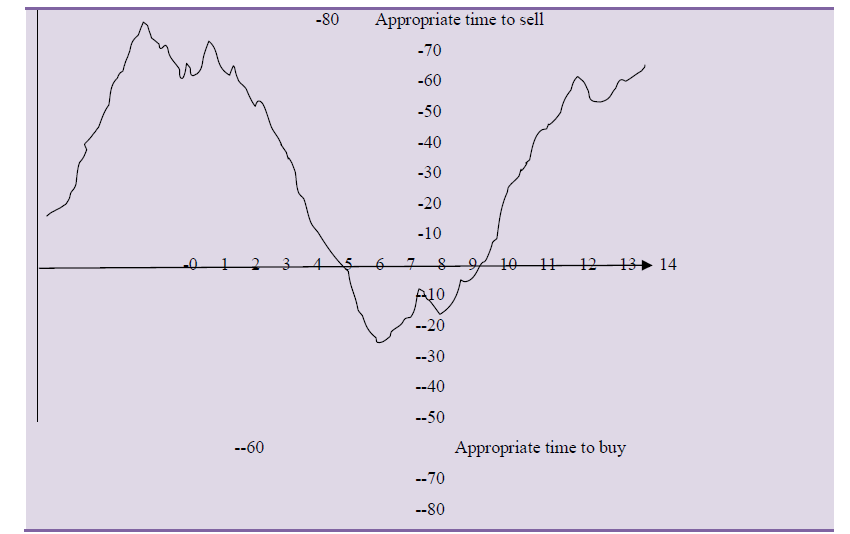 |
| The above chart clearly shows that one should buy a share that is oversold and sell the share that is overbought. In the ROC Chart, overbought zone is above the zero line and the oversold zone is below the zero line |
| Relative Strength Index: |
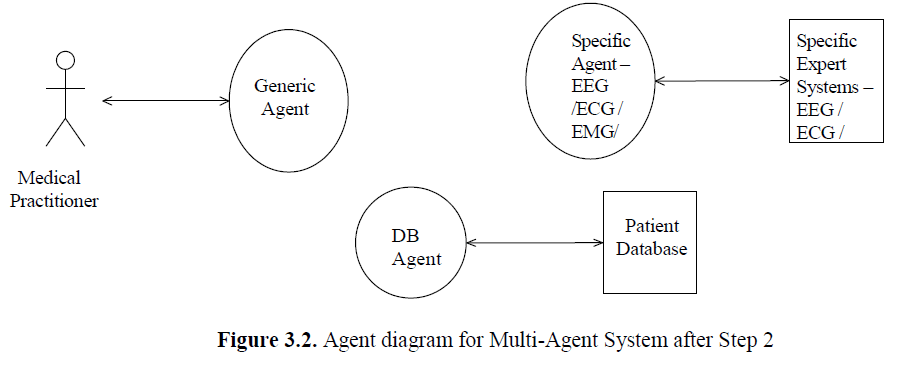
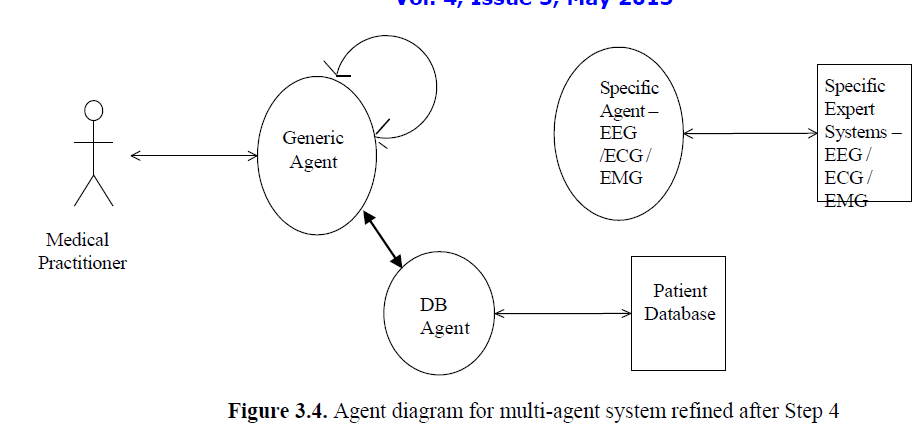
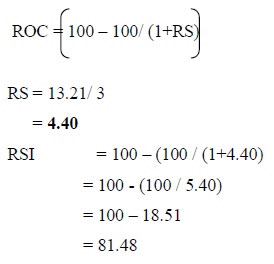
| To understand the concept of RSI easily, let us consider the following example. |
| Stock price of Narmada Pvt. Ltd is given below |
 |
 |
 |
 |
| 1 2 3 4 5 6 7 8 9 10 11 12 13 14 15 16 17 |
III.CONCLUSION |
| RSI Values above 70 are considered to denote overbought conditions and values below 30 are considered to denote oversold condition. When the RSI has crossed 30 lines from below to above and is rising, a buying opportunity is indicated. When it has crossed 70 line from above to below and is falling, selling signal is indicated. |
References |
|