ISSN ONLINE(2319-8753)PRINT(2347-6710)
ISSN ONLINE(2319-8753)PRINT(2347-6710)
Dr.S M Gopinath1, Anushree V Katti2 K.S.Dayananda1, Ismail Shareef1.M, , Drishya V.Nair3
|
| Related article at Pubmed, Scholar Google |
Visit for more related articles at International Journal of Innovative Research in Science, Engineering and Technology
French bean is one of the important leguminous vegetables grown for its tender pods either for fresh consumption or for its dried seeds as ‘Rajma’. In the present study SSR molecular markers were used to evaluate the genetic diversity in ten varieties of French bean (Phaseolus vulgaris) germplasm accessions obtained from NBPGR, New Delhi. Various morphological characters and quantitative traits were recorded. Among the ten accessions, six accessions said to possess the genes which relate to all five SSR primers. Out of five SSR primers, two primers Bmd9 and Bmd16 show bands in all ten French bean germplasm. Cluster analysis shows that ten genotypes are grouped in two clusters. The purpose of this SSR analysis is to facilitate the construction of SSR based genetic linkage maps in French bean.
Keywords |
| Cluster analysis, French bean, Genetic Diversity, SSR primers |
INTRODUCTION |
| French bean (Phaseolus vulgaris L) is also known as „RajmaâÃâ¬ÃŸ or haricot bean or kidney bean or common bean. French bean is one of the most important leguminous vegetable grown for its tender pods either for fresh consumption or for processing as canned, frozen or freeze dried product. It has anti diabetic property and it is good for natural cure of bladder burns and cardiac problems.As a rainy season crop, it does not require irrigation, when rainfall distribution is even throughout crop cycle. However, the Rabi crop requires irrigation.Irrigation at 25 days after sowing is critical. Under optimum conditions, 2.0-2.5 t/ha of grain and 3.0-3.5 t/ha straw yield can be obtained.The traditional method of morphological plant characterization is a common step in plant breeding although it has some drawbacks, as it is descriptive, error-prone, and affected by the environmental or physiological factors. Therefore, several molecular tools are being adopted for plant variety characterization and identification, because these techniques are reliable, unambiguous in nature, and easy to adopt [19].Molecular markers include biochemical constituentsâÃâ¬ÃŸ viz., secondary metabolites in plants and macromolecules viz., proteins and deoxyribonucleic acid (DNA). However, analysis of secondary metabolites is restricted to those plants that produce a suitable range of metabolites, which can be easily analyzed and distinguished between varieties. These metabolites, which are being used as markers, should be neutral to environmental effects or management practices. Hence, amongst the molecular markers used, DNA markers are more suitable and ubiquitous to most of the living organisms [32].DNA markers that are tightly linked to agronomically important traits (called gene „taggingâÃâ¬ÃŸ) may be used as molecular tools for marker-assisted selection (MAS) in plant breeding [28]. MAS involves using the presence/absence of a marker as a substitute for or to assist in phenotypic selection, in a way which may make it more efficient, effective, reliable and cost- effective compared to the more conventional plant breeding methodology. The use of DNA markers in plant (and animal) breeding has opened a new realm in agriculture called „molecular breedingâÃâ¬ÃŸ [27].Simple sequence repeats (SSRs) or microsatellites were first described by Hamada et al. (1982) as short tandemly repeated DNA sequences (2–5 bp in length) widely spread throughout the nuclear genome of eukaryotes [33].Microsatellites are short stretches of DNA which consists of single, di, tri or tetra nucleotide repeats. The ubiquitous nature of such sequence throughout the eukaryotic genome was first highlighted in a number of studies in organisms ranging from yeast to human beings. Microsatellites also represent a rich source of allelic diversity which has been exploited in many types of genetic analysis.SSR markers are locus specific and highly polymorphic. These markers are co-dominant and allow the discrimination of homozygotes and heterozygotes. Fortunately microsatellite primers obtained from one species are very often usable in closely related species of the same genus and sometimes even through genera of the family.Silva et al. (2003) identified RAPD and SSR markers associated with a resistant allele for common bean angular leaf spot (Phaeois ariopsisgriseola) from the line 'ESAL 550', derived from the Andean 'Jalo EEP 558' cultivar, to assist selection of resistant genotypes. One RAPD and one SSR marker were found to be linked in coupling phase to the resistant allele. The SSR marker was amplified by the primer PV-atct001282C, and its distance from the resistant allele was 7.6 cM. This is the most useful marker for indirect selection of resistant plant in segregating populations. A common bean genomic library enriched for microsatellite motifs (ATA), (CA), (CAC) and (GA) was constructed. After screening, 60% of the clones selected from the library enriched for the (ATA) repeat contained microsatellites versus 21% of the clones from the library enriched for (GA) (CA) and (CAC) repeats. Fifteen primer pairs have been developed allowing for the amplification of SSR loci. We have evaluated the genetic diversity of these loci between 45 different bean lines belonging to nine various quality types. A total of 81 alleles was detected at the 15 microsatellite loci with an average of 5.3 alleles per locus. We have investigated the origin of allelic size polymorphism at the locus PvATA20 in which the number of repeats ranges from 24 to 85. We have related these large differences in repeat number to unequal crossing-over between repeated DNA regions. The diversity analysis revealed contrasted levels of variability according to the bean type. The lower level was evidenced for the very fine French bean, showing the effect of breeders intensive selection. 9volune 4 , June 2002). |
MATERIALS AND METHODS |
| Fifteen French bean germplasms were grown in the field and leaf samples were collected for the extraction of plant genomic DNA. |
| A. DNA Extraction |
| Active leaves free from pest and disease were collected from each accession rinsed with water and surface sterilized with 70% alcohol. The leaves were then weighed about 0.5 grams and used for extraction of DNA by CTAB method. |
| Plant genomic DNA Isolation protocol: |
| 1) CTAB extraction buffer (100mM TrisHCl, 20mM EDTA, 1.4mM NaCl, 2%) (8ml) was preheated with 0.8g of PVP and 200μl of 0.5% β- mercaptoethanol. |
| 2) The leaf tissue (2g) was ground to fine powder with liquid nitrogen using pestle and mortar. |
| 3) The contents were transferred into a centrifuge tube and the tubes were again incubated for 1hr at 600C in water bath. |
| 4) The tubes were shaken intermittently every 10 mins and were cooled to room temperature, 6ml chloroform: Isoamyl alcohol (24:1) mixture was added and mixed gently by inverting tubes till it formed an emulsion. |
| 5) The tubes were centrifuged at 13000rpm for 10min and the aqueous phase was transferred to a new centrifuge tube, using cut tips and once again chloroform: Isoamyl alcohol step was repeated |
| 6) Clear aqueous phase was transferred to fresh centrifuge tubes and 2ml of 1.4M Sodium Chloride and 8ml ice cold isopropanol were added, mixed gently and refrigerated overnight at -200C. |
| 7) The supernatant was discarded and the pellet was washed with 70% ethanol |
| 9) Then the DNA pellets were dried by leaving tubes uncovered at room temperature for 2-3hours until the alcohol is evaporated. |
| 10) The pellets were resuspended in 200μl of TE buffer. |
| The isolated samples were stored at -20degree Celsius. DNA concentration was determined by nanotrope and quality verified by agrose gel electrophoresis (0.8%) |
B. DNA Amplification |
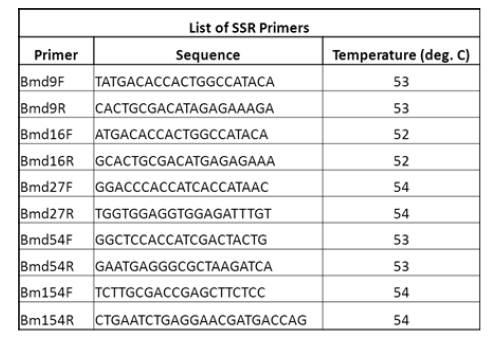
| Six SSR primers were used for PCR amplification. A list of the primers is given in the table below |
 |
| All the PCR components are added into PCR tubes and inserted into the wells of PCR machine. The PCR reaction mixture is prepared in 20 μL volumes containing 2 μL of 10X Taq buffer, 1.5 μL dNTPs (2 mM), 2 μL (F+R) SSR primer (5 pmol/ μL), 0.3 μL Taq DNA polymerase (3 U/μL) and 2μL of the extracted DNA (50 ng). The mixture was made up to 20 μL by the addition of 12.2μL sterilized distilled water. ON the machine and run it for 4 hours. After this remove PCR product and carry out Gel Electrophoresis.PCR reactions were initiated and optimized using a thermal cycler programmed to repeat the thermal profile. Setting of the PCR program based on three steps. Step one, was an initial denaturation step at 95°C for 3 min. Step two, was run for 30cycles, each starting with denaturation at 95°C for 1 min, followed by annealing 52 to 57°C for 1 min and ended by extension at 72°C for 1 min. Step three, was a final extension cycle performed at 72°C for 10 min. The PCR product was mixed with loading dye (0.5% bromophenol blue, 0.5% Xylene Cyanol and 30% Sucrose, w/v) and spun briefly in a micro centrifuge before loading. The PCR products and 100 bp DNA ladder were electrophoresed using 2% agarose gel at 80 volts followed by staining with ethidium bromide then separated fragments and were visualized with an ultraviolet (UV) transilluminator. |
 |
RESULTS AND DISCUSSIONS |
| As per PCR protocol, 10 good quality French bean accessions were selected and screened with 5 SSR primers. |
 |
 |
 |
 |
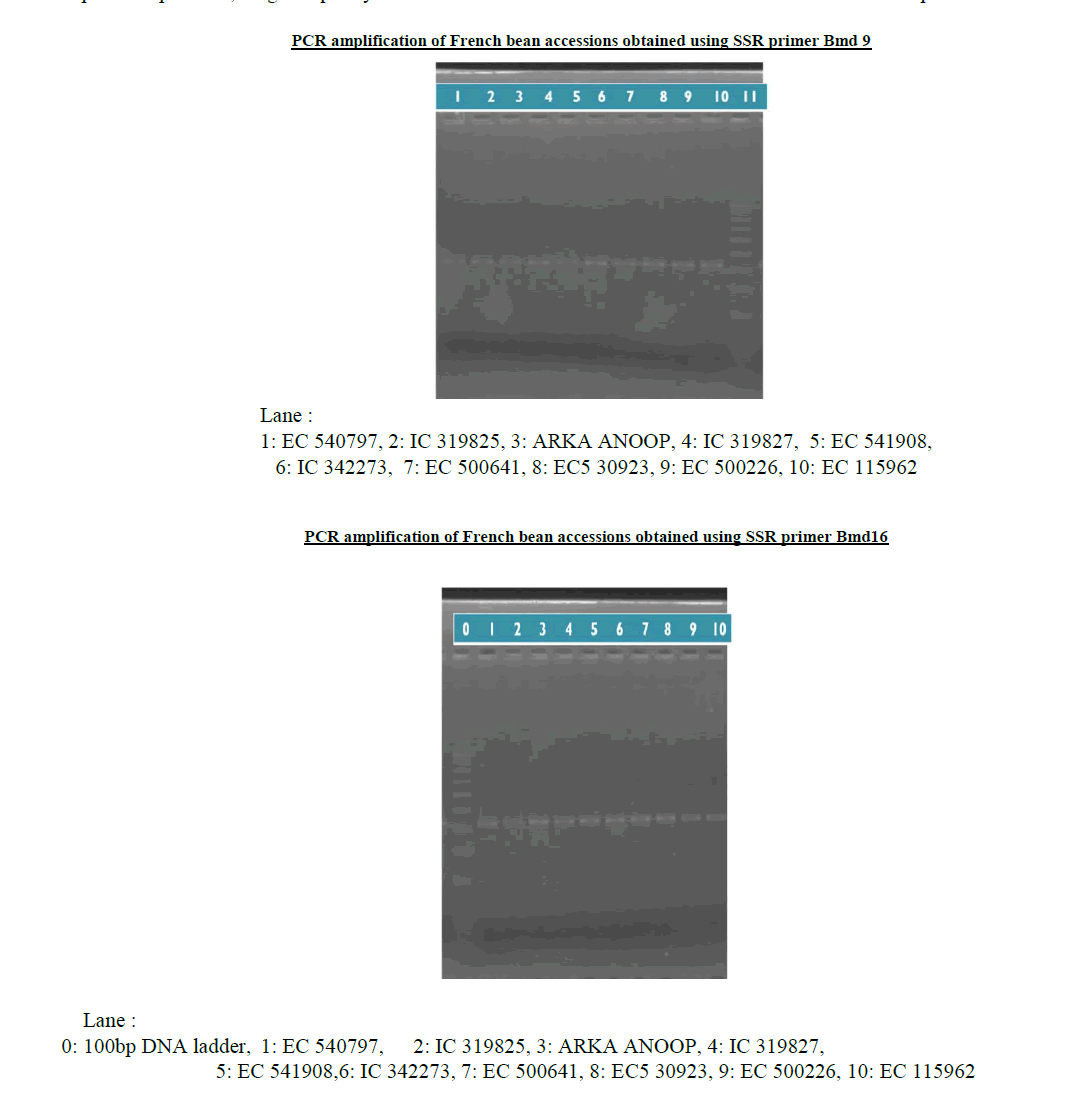
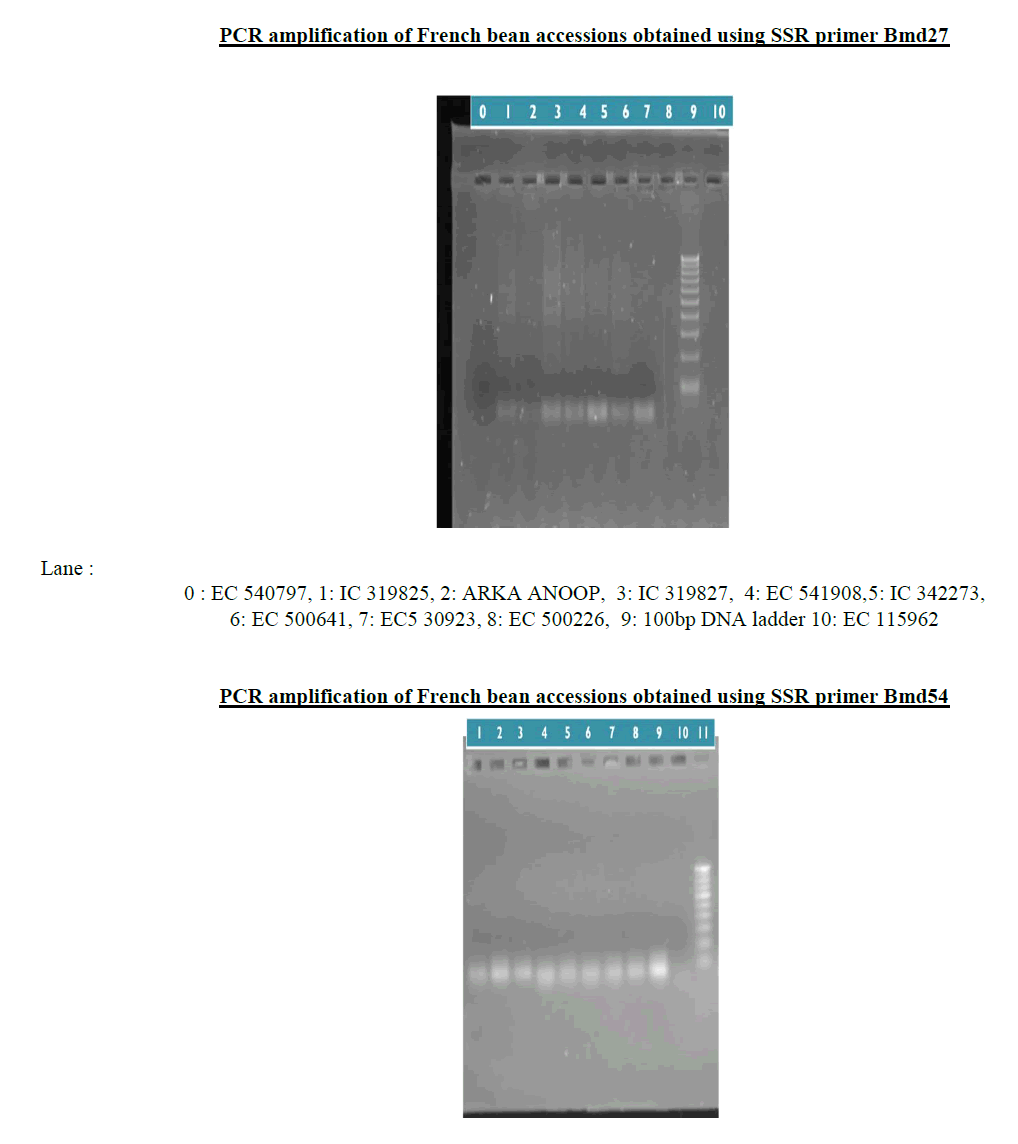
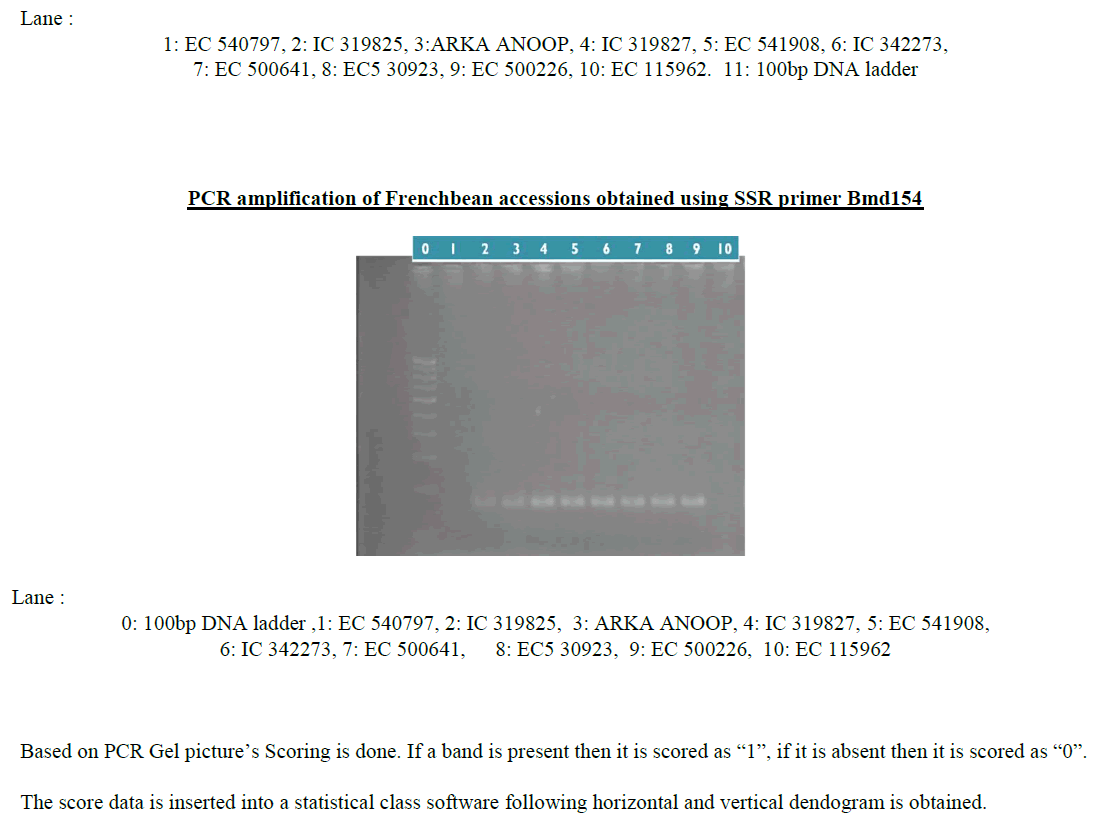
| From the essay of PCR product using SSR primers the results reveals that primer Bmd9 and Bmd16 shows presence of bands in all French bean accessions (1-10, 1:EC540797, 2:IC319825, 3:ARKANOOP, 4:IC319827, 5:EC541908, 6:IC342273, 7:EC500641, 8:EC530923, 9:EC500226, 10:EC115962, ( plate 2 and plate 3)), where as primer Bmd27 shows amplification in 2,4,5,6,7,8,9 (2:IC319825, 4:IC319827, 5:EC541908, 6:IC342273, 7:EC500641, 8:EC530923, 9:EC500226), Frenchbean accessions (plate4). Primer Bmd54 shows amplification in1-9 (1:EC540797, 2:IC319825, 3:ARKANOOP, 4:IC319827, 5:EC541908, 6:IC342273, 7:EC500641, 8:EC530923, 9:EC500226) French bean accessions (plate5). Primer Bmd154 shows amplification in 2-9 (2:IC319825, 3:ARKAANOOP, 4:IC319827, 5:EC541908, 6:IC342273, 7:EC500641, 8:EC530923, 9:EC500226) French bean accession (plate6). Therefore 2,4,5,6,7,8 (2:IC319825, 4:IC319827, 5:E541908, 6:IC342273, 7:EC500641, 8:EC530923) French bean DNA accessions are having the genes of particular traits which are linked to all 5 primers mentioned above. |
CONCLUSION |
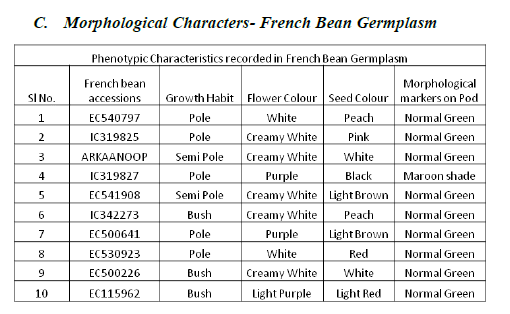
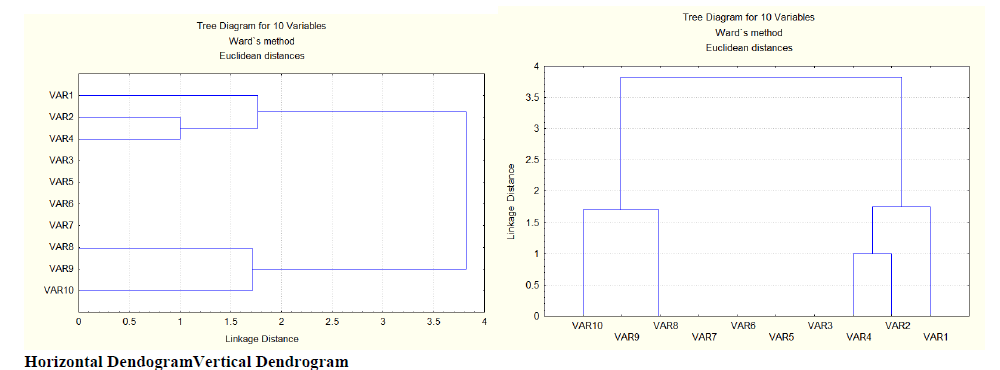
| The results obtained from the present study shows that, the 10 genotypes fall under two broad clusters. The cluster-1 is composed of variable10 (EC115962), variable 9 (EC500226) and variable 8 (EC530923), whereas the cluster-2 consists of variable 4 (IC319827), variable 2 (IC319825) and variable 1 (EC540797). The remaining were placed in between. In cluster 1, the variable 1 (EC540797) is linked to the variable 8 (EC530923) at a distance of 1.7 whereas variable 9 (EC500226) is no where linked to variable 10 (EC115962) and variable 8 (EC530923) but it is placed in between. In cluster 2, the variable 4 (IC319827) is linked to variable 2 (IC319825) at a distance of 1. This linkage is again linked to variable 1 (EC540797) at a distance of 1.7. These two clusters are linked again at a distance of 3.8. But variable 3 (ARKAANOOP), variable 5 (EC541908), variable 6 (IC342273), variable 7 (EC500641) has no linkage to cluster 1 or cluster 2 or linkage to both the clusters, they are laced in between 1 and 2 clusters.This implies, the variables in cluster -1 were genetically different (i,e they have different morphological characters such as shape, size, flower colour, seed colour, etc..) from variables in cluster-2 and hence they can be used for breeding work. |
References |
|