ISSN ONLINE(2319-8753)PRINT(2347-6710)
ISSN ONLINE(2319-8753)PRINT(2347-6710)
S. Ravikumar1J. Thirumalairaj2, R. Gokulakrishnan1,
|
| Related article at Pubmed, Scholar Google |
Visit for more related articles at International Journal of Innovative Research in Science, Engineering and Technology
The present study was made an attempt to enumerate the total heterotrophic bacteria (THB), E. coli, actinomycetes and fungi population and to evaluate the biochemical parameters from water and sediment samples. The samples were collected from eight different stations viz., Kodiyakkarai, Mallipattinam, Manora, Manamelkudi, Kottaipattinam, Mimisal, S. P. Pattinam and Thondi along Palk Strait coast of South India. The results suggested that, the maximum THB (12x105 CFU.mL-1) and E. coli (14x105 CFU.mL-1) counts were recorded in water sample at Mallipattinam coast during the month of January and February. The maximum (5x10⁵ CFU.g-1) counts of actinomycetes were recorded in sediment at Thondi during the month of March. Moreover, the counts of fungi were found maximum (12 x105 CFU.g-1) in sediment at Mimisal during the month of March. The correlation analysis revealed that, the counts of THB showed positive correlation (p<0.05) with amino acids in both water and sediment samples and showed negative correlation (p<- 0.05) with carbohydrates and proteins. The counts of E. coli showed positive correlation (p<0.05) with amino acids in sediment and also showed positive correlation (p<0.05) with carbohydrates and non-reducing sugar in water. The counts of actinomycetes showed negative correlation (p< - 0.05) with amino acids in sediment. The fungal counts showed positive correlation (p<0.05) with protein and reducing sugar in sediment.
Keywords |
| Actinomycetes, E. coli, Fungi, Microbial diversity, Palk Strait coast, Total heterotrophic bacteria. |
I. INTRODUCTION |
| The microbial community constitutes 90% of oceanic biomass, which includes bacteria, archaea, protists and fungi etc. They are responsible for 98% of primary production in the marine ecosystem [2]. They have known to produce potential commercially important bioactive secondary metabolites. Marine microorganisms can be survived in extreme pressure, salinity, temperature and absence of light. The microbial diversity in the marine ecosystem is an important to understand about the microbial biomass, biogeochemical cycling and distribution pattern. The microbial diversity monitoring in marine water and sediment plays a vital role to predict anthropogenic interventions and helps to assess sanitary condition in the coastal environment [15]. But so far it is remains unknown to understand their community distribution patterns in most of the marine ecosystems. Therefore understanding the patterns of microbial diversity is crucial to anticipate the responses of marine ecosystem for future perspectives [24], [3].The change in the environmental parameters may leads to the microbial diversity fluctuations in the marine ecosystem. In order to assess the microbial diversity in coastal environment, it is essential to determine the relationship between the biochemical parameters and the microbial diversity in the marine environment [5]. Several authors assessed only the microbial diversity in Sagami Bay [16], Pichavaram [21] and Palk Strait [23] etc. However studies on microbial diversity in relation to biochemical parameters in Palk Strait are poorly understood. In this connection, the present study has initiated to investigate the microbial diversity in relation to biochemical constituents along the Palk Strait coast of South India. |
II. MATERIALS AND METHODS |
| A. Sample Collection |
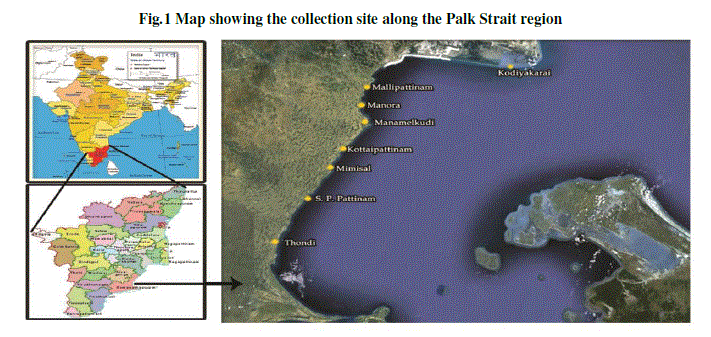
| The water and sediment samples were collected between the months of January 2012-March 2012 from eight different stations viz. Kodiyakkarai (Lat. 10° 16’ N; Long. 79° 49’ E), Mallipattinam (Lat. 10° 16’ N; Long. 79° 15’ E), Manora (Lat. 10° 15’ N; Long. 79° 18’ E), Manamelkudi (Lat. 10° 02’ N; Long. 79° 15’ E), Kottaipattinam (Lat. 09° 59’ N; Long. 79° 13’ E), Mimisal (Lat. 09° 54’ N; Long. 79° 08’ E), S.P. Pattinam (Lat. 09° 51’ N; Long. 79° 05’ E) and Thondi (09° 44’ N; Long. 79° 01’ E) (Fig. 1). The collected samples were carefully transported to the laboratory in an ice cold condition for further analysis. |
 |
| B. Microbiological Analysis |
| The collected samples were serially diluted and 1ml of each dilution was added in sterile petriplate separately. After that, sterile molten media was poured on each triplicate plate containing the sample for the isolation of THB (Zobell Marine Agar-2216e), E. coli (Tergitol-7), actinomycetes (Starch Casein agar) and fungi (Rose Bengal agar) and kept for incubation. Colonies appeared on the solid media will be counted. |
| C. Biochemical Analysis |
| The biochemical parameters such as total sugar [7], reducing sugar [13], protein [11] and amino acid [14] were estimated by following standard protocols. |
| D. Statistical Analysis |
| The correlation analysis was performed by using SPSS (ver. 16.0) software. |
III. RESULTS AND DISCUSSION |
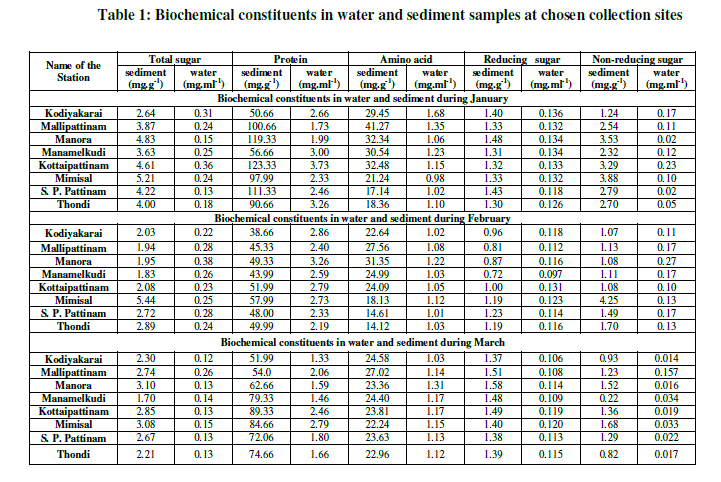
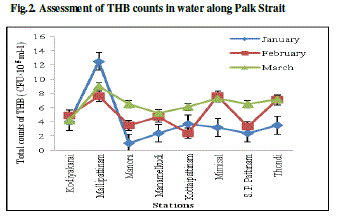
| In water, the counts of THB were recorded maximum (12.5×10⁵ CFU.mL-1) during the month of January at Mallipattinam and minimum (1.0×10⁵ CFU.mL-1) was recorded during the month of January at Manora (Fig. 2). The counts of E. coli were recorded maximum (14x105 CFU.mL-1) during the month of February at Mallipattinam and minimum (1.0x10⁵ CFU.mL-1) was recorded during the month of January at Mimisal (Fig. 3). However, none of the collection site showed the counts of actinomycetes and fungi. In sediment, the maximum (7.8x10⁵ CFU.g-1) counts of THB were recorded during the month of January at Kodiyakarai and minimum (1.3x10⁵ CFU.g-1) was recorded during the month of February at Mimisal (Fig. 4). The counts of E. coli were recorded maximum (6.0x10⁵ CFU.g-1) during the month of February at Mallipattinam and minimum (1.0x10⁵ CFU.g1) counts were recorded during the month of January at Mimisal and Manamelkudi (Fig. 5).The counts of actinomycetes suggested that, the maximum (5 x10⁵ CFU.g-1) counts were recorded during the month of March at Thondi and minimum (1.0x10⁵ CFU.g1) was recorded in January at Kodiyakkarai (Fig. 6). The counts of fungi were recorded maximum (12 x105 CFU.g-1) during the month of March at Mimisal and minimum (1.0x10⁵ CFU.g1) was recorded during the month of January month at Kodiyakkarai (Fig. 7). In water sample, the total sugar was found maximum (0.38 mg.g-1) during the month of February at Manora and minimum (0.12 mg.g-1) was recorded during the month of March at Kodiyakarai. The protein was found maximum (3.73 mg.g-1) during the month of January at Kottaipattinam and minimum (1.33 mg.g-1) was found at Kodiyakarai during the month of March. The amino acid was found maximum (1.68 mg.g-1) during the month of January at Kodiyakkarai and found minimum (1.0 mg.g1) during the month of February at S. P. Pattinam. The reducing sugar was found maximum (0.136 mg.g1) during the month of January at Kodiyakarai and the minimum was recorded by 0.106 mg.g-1 during the month of March at Kodiyakarai. The level of non reducing sugar was found maximum (0.27 mg.g-1) at Manora during the month of February and found minimum (0.014 mg.g-1) in March at Kodiyakarai coastal region. |
| In sediment, the total sugar was recorded maximum (5.44 mg.g-1) at Mimisal during the month February and minimum (1.70 mg.g-1) was recorded during the month of March-2012 at Manamelkudi. The protein was recorded maximum (123.33 mg.g-1) at Kottaipattinam during the month of January and the minimum (38.66 mg.g-1) was recorded during the month of February at Kodiyakarai. The amino acid was recorded maximum (41.27 mg.g-1) during the month of February at Mallipattinam and minimum (14.12 mg.g-1) was recorded during the month of February at Thondi. The reducing sugar was found maximum (1.58 mg.g-1) during the month of March at Manora and minimum (0.72 mg.g-1) was recorded during the month of February at Manamelkudi. The non reducing sugar was found maximum (4.25 mg.g- 1) during the month of February at Mimisal and found minimum (0.82 mg.g-1) during the month of March at Thondi (Table 1). |
| The assessment of microbial diversity poses a considerable importance and interesting task. Besides that, it helps to identify the novel secondary metabolites derived from the microbes. Generally, the water and sediments in the marine environment plays a significant role to assess microbial diversity and sanitary condition of the marine environment. In order to understand the feacal pollution, the enumeration of E. coli was highly recommended as a feacal indicator. E. coli has already been used as a feacal indicator in many countries [1]. In view of this, the present study has initiated to enumerate the microbial population including E. coli and to find out the relationship upon the biochemical constituents along the Palk Strait coast of South India. The counts of THB were recorded maximum (12.5x10⁵ CFU.mL- 1) in water at Mallipattinam and the sediments showed the maximum counts by 7.8x10⁵ CFU.g-1 in Kodiyakarai. Similarly, [10] and [12] reported that, the maximum counts of THB were recorded in Porto Novo and Cuddalore coasts. The counts of E. coli were recorded maximum (14x105 CFU.mL-1) in water and the sediment showed the maximum counts by 6x10⁵ CFU.g-1 at Mallipattinam. Similarly, [20] reported that, the maximum (5.9x10⁴ CFU.mL-1) counts of E. coli was recorded in water and showed the counts by 4.7x10⁴ CFU.g-1 in sediments at Porto Novo. Generally, the bacterial groups were found maximum in water during the rainy season. This might be due to the proliferation of nutrients derived from the adjacent river runoff which enhance the maximum growth of bacterial population. Addition of essential nutrients would have stimulated the bacterial counts [6]. However, none of the actinomycetes and fungi counts were recorded in water sample. Likewise, [22] reported that, no actinomycetes and fungi counts were recorded in water sample in Bay of Bengal. |
| The counts of sediment actinomycetes were recorded maximum (5 x10⁵ CFU.g-1) at Thondi whereas the maximum (12x106 CFU.g-1) counts of sediment actinomycetes were recorded in Andaman Islands [4], [23] reported that, the maximum counts of sediment actinomycetes were recorded in Palk Strait region. Concordantly, the counts of fungi were also recorded maximum (12x105 CFU.g-1) in sediment by the present study. The fungal counts in sediment were recorded maximum (17x105 CFU.g-1) in Bay of Bengal [22]. Generally, the actinomycetes and fungi counts were higher in sediments than in water. Moreover, the maximum counts of actinomycetes and fungi might be due to the availability of the huge amounts of dissolved and particulate nutrients would have gradually deposited on the bottom sediments which stimulate the counts [25]. [8] Reported that, the actinomycetes can forms only a small fraction of micro flora and they can survive as spores or resting propagules in marine sediment. The bacteria play an important role in the formation of sediments through their metabolic activities and responsible for the biological transformation of organic matter [18]. So, the level of organic particles and other composition including carbohydrates also diminished gradually due to their metabolic activities. Moreover, they involved in the degradation of organic matter in sediment and water which release the dissolved organic and inorganic substances [26], [9] and [17]. The biochemical constituents of the present study suggested that, the level of total protein and amino acids found maximum than the total sugars and this could be due to either microbial degradation or dissolution of reserve soluble carbohydrate and its derivatives. [19] Reported that, the bacterial groups are the main contributors for the degradation and sedimentation of organic particles. The microbial counts showed statistically significant correlation with the biochemical constituents. |
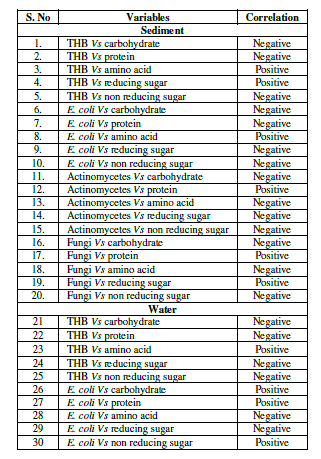
| The correlation analysis revealed that, the counts of THB showed significant (p<0.05) positive correlation with amino acids in sediment and water and showed negative (p< - 0.05) correlation with carbohydrates and proteins in sediment and water. E. coli showed significant (p<0.05) positive correlation with amino acids in sediment and carbohydrates, non reducing sugar in water. The counts of actinomycetes didn’t showed positive correlation with none of the biochemical constituents in sediment. The counts of fungi showed significant (p<0.05) positive correlation with protein and reducing sugar in sediment (Table 2). |
 |
 |
| Table 2: Significant (p<0.05) correlation between microbial population and biochemical constituents |
 |
III. CONCLUSION |
| In conclusion, the microbial counts vary with their geographical regions and significantly correlated with the biochemical constituents. Among the bacterial groups, the faecal coli form of E. coli counts were found maximum in Mallipattinam coast and this might be due to the pollution caused particularly by the anthropogenic activity when compared with other collection sites. Moreover, the present study provides adequate information on the relationship between the microbial population and the biochemical constituents. However, necessary steps to be needed so as to manage the pollution free coastal ecosystem by the manmade activities. |
ACKNOWLEDGEMENT |
| The authors express their appreciation to Alagappa University for supporting the research work and University Grants Commission, New Delhi also greatly acknowledged for the financial assistance. |
References |
|