Keywords
|
| Available Transfer Capability (ATC), DC Power Flow, DC Power Transfer Distribution Factors(DCPTDFs), and Generator Outage Distribution Factors (GODFs). |
INTRODUCTION
|
| Before the deregulation of power industry, the number of generators and distributors were limited. The peoples had hardly any choice. The reasons for motivating the deregulation of power industry were many as described here under as: |
| Electricity is most valuable and used thing, in our daily life. So why not make it a competitive market like all other markets we have. |
| Electricity production is a fully proved technology. So, the risk involved in investing in this industry is very small. |
| Due to the unfaithfulness in government and some good achievements from the privatization of other industries, we go for the privatization of power industry also [13]. |
| A private entity always knows the value of their customers and always responds quickly in response to their problems and ultimately the main aim of the competition was customer satisfaction and not to lower the cost of electricity. In a competitive market there are always some incentives involved for the improvement in the system performance. And the new inventions are always appreciated in a competitive market. This helps in improving the system. |
| Overstaffing of the regulated power industry can only be cut down by deregulation of the industry. |
| There was a huge pressure from the financial institutes. These institutes were ready to provide loan to the power industry only if they deregulate their power sector. Due to the lack of competition in a regulated power industry |
| There were many political issues in this country which forces the deregulation of power industry. |
| Due to the competition in electric industry, the number of transactions increases at an alarming pace. The transaction could be a bilateral or multiple one [3]. But the transmission network is limited for transferring the power. The total transfer capability for a transmission line is fixed; it is the thermal limit of a line [2]. Power transfer through a line should be less than its thermal limit for a secure transfer. According to NERC definitions, ATC is defined as the transfer capability remaining in the physical transmission network for further commercial activity over and above committed uses [1]. Every operator should know the value of ATC before any transaction, to avoid congestion into the transmission network [4]. The values of ATC are greatly affected by the contingencies in the system [5]. The contingencies could be single/multiple line contingency or the generator contingency. There are various methods to calculate the value of ATC. These are: Continuation power flow method (CPF), Optimal power flow method (OPF), repeated power flow method (RPF), ATC calculation based on sensitivity factors, using ACPTDFs and DCPTDFs. |
| Continuation power flow (CPF) method is an iterative method, so it takes more time to converge the solution [6]. It is based on a predictor and corrector scheme. It considers thermal limit, voltage limit, and stability limit. It provides accurate results than any other method. It overcomes the singularity of the Jacobian matrix close to the critical point. |
| Optimal power flow (OPF) method can symmetrically handlethe operational problems but since the approximation is used, the accuracy of this calculation is low [7]. It also causes convergence problems due to a huge number of variable and equations for large scale electric power systems. It considers the thermal limit and voltage limit only. |
| Repeated power flow (RPF) method repeatedly solves conventional power flow equations at a succession ofpoints along the specified transfer directions [8]. While CPF solves a set of augmented power flow equations to obtain the solution curve. Compared to any OPF method, RPF can provide P-V and V-Q curves for voltage stability studied. Moreover adjustment method of control variables in RPF is relatively easy. Compared to the CPF method, the implementation of RPF method is much easier and the time for convergence time is less. It considers the thermal limit, voltage limit, and stability limit. |
| AC power flow method is based on the power transfer factors (PTDFs); it considers the real and reactive power flow [9]. It gives an accurate estimate of ATC values, but due to the incorporation of reactive power, it becomes complicated and time consuming. DC power flow method is based on DC power transfer distribution factors [10]. This method considers only the real power flow. Generator outage distribution factors (GODFs) are used to consider the generator contingencies [11]. |
DC POWER FLOW MODEL
|
| In DC power flow method the system is assumed lossless and the reactive power flow is not considered. The voltage of each bus is assumed to be 1 p. u. By considering all these assumptions the Newton Raphson load flow equations are modified. The Newton Raphson load flow equations can be expressed as: |
 |
 |
| The resistance of transmission circuits is significantly less than the reactance. Usually, it is the case that the x/r ratio is between 2 and 10. So any given transmission circuit with impedance of will have an admittance of: |
 |
 |
 |
| If r is very small compared to x, then we observe that g will be very small compared to b, and it is reasonable to approximate equation (5) as: |
 |
| Now if = 0 then the real part of the elements of Y-bus matrix will also be zero. |
| By applying all the above said assumptions, the load flow equations become: |
 |
| |
 |
| Sine of the angle is angle itself. So, the load flow equations become: |
 |
 |
| The voltages of each bus are assumed to be unity. So, the load flow equations can be written as: |
 |
 |
| The reactive power flow in the lines is very small as compared to the real power flow, so the reactive power flow is not considered in DC power flow method. |
| DC power flow equations show the relationship between bus angle vector ïÿýïÿý and power injection vector ïÿýïÿý for an nbus system. It is given by: |
 |
| Where is the n x n susceptance matrix, whose elements are given by: |
 |
 |
| By selecting any bus to be the reference bus from the n–buses, the row and column corresponding to the reference bus can be eliminated from matrix. |
| The canbe obtained by simply taking the inverse of matrix. |
ATC CALCULATION for INTACT SYSTEM
|
| The injected power is simply given by the generated power less the load at that bus. The element corresponding to the slack bus is taken equals to zero |
 |
| Whereis a matrix which shows change in voltage angle at any bus i. |
| By using this we can find change in voltage angle of any of the lines, connected by two buses. |
| The real power flows in a line connected between bus i and j using DC power flow is given by: |
 |
| Where are the phase angles of bus i & j respectively&is the line reactance. |
| DCPTDFs are defined as the coefficient of the linear relationship between the amount of a transaction and the flow on a line. As it relates the amount of one change i.e. transaction amount to another change i.e. the lone flow. PTDF is the fraction of amount of a transaction from one zone to another over a specified transmission line.They express how the power flow in transmission lines changes in response to the transaction between a particular seller and buyer bus. The DCPTDFs for a line between buses i and j and a transaction between a seller bus m and buyer bus n can be given by: |
|

|
| Whereisthe reactance of the line between bus i and j & is the element of reactance matrix. |
| A. Single Transaction ATC Calculation |
| Whenever a transaction occurs between two buses, the real power flows of the lines changes. This is due to the change in angle. This change in line flows is given by: |
 |
| Now the total line flows will be the sum of base case real power flow and the change in line flows. Mathematically it can be written as: |
 |
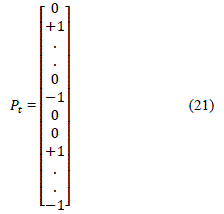
| is a column matrix which indicates the amount of power transferred between seller bus and buyer bus. In a single transaction case there is only one seller bus and one buyer bus. For those the entries in this matrix are +1 for seller bus and -1 for the buyer bus, all other elements will be zero for single transactions. |
| B. Multiple Transaction ATC Calculation |
| In multiple-transaction case two or more than two seller and buyer buses will be there. Will be +1 for all the seller buses and -1 for all the buyer buses. Mathematically this change in can be expressed as: |
 |
|
|
| The seller bus is denoted by m and buyer bus is denoted by n. The maximum allowable capability of the transaction using DCPTDF is given by: |
 |
| is the maximum transfer limit of the line between bus i and j. |
| Now the ATC can be expressed mathematically as: |
 |
| Where, is the total number of lines in the system. |
ATC CALCULATION USING SINGLE and MULTIPLE LINE CONTINGENCIES
|
| Line contingencies have a significant effect on the value of ATC. Due to any bad weather condition, maintenance purposes, or thermal breaking, whenever a line is removed from the network, the value of ATC for all other lines is affected. Due to the line outage, the power transferring through that line is redistributed to other lines. So, the ATC will be decreased. To show the effect of line contingencies, one way is to the use line outage distribution factors (LODFs) in combination with the PTDFs. LODF is a sensitivity measure of how a change in line’s status affects the line flows on other lines of the system [12]. Outage transfer distribution factors (OTDFs) is the function of LODFs and PTDFs, used to find the ATC in line contingency cases. But by using LODFs we can only remove a single line at a time from the existing network. The other way is: the line you want to remove from the network, omit that line from line data. Means, remove the line data corresponding to that line. By doing so, the susceptance matrix is reformed and hence the PTDFs changes accordingly. Due to this the line flow changes and ultimately the value of ATC changes. So, we can calculate the value of ATC by using the changed value of PTDFs, using the same relation as above discussed. By this method, we can remove multiple lines from the network up to the network disconnection. At this point the susceptance will become singular. |
ATC CALCULATION INCORPORATING GENERATOR CONTINGENCY & GENERATOR ADDITION
|
| Like, the line outage, the worst conditions like overloading, or any internal fault, may cause the generator outage also. Due to the outage of generator from the network, the line flow changes and hence the ATC of lines will be affected. To consider the effect of generator contingencies, we have to find the generator outage distribution factors (GODFs). Generator outage distribution factors are the sensitivity of the MW power flow on any line ij, due to the outage of |
| generation at any bus k. The change in generation due to any generator outage is equally compensated by the opposite change at the reference bus. GODFs are simply equals to the PTDFs for this transaction. The change in power flow is given by: |
 |
| Where, isamount of generation that the generator was generating before its outage. |
 |
| The ATC can be calculated by considering the generator outage as: |
 |
| Like the generator outage, we can also add an extra generator to the existing network at any bus, to see the effect of extra generation in the network. The generation value of the generator is set to a fixed value. By the addition of a generator at any bus, the value of ATC of the transmission lines is affected due to the redistribution of the line flows. In this paper this effect is considered and the results are shown. |
TEST RESULT
|
| The results of this technique have been obtained for IEEE 30 bus system. The results include the value of PTDF for different transactions and Real power flow is calculated for both intact and contingency cases. ATC is calculated for different transactions in both intact and contingency cases. Both the line contingency and generator contingencies are considered. ATC is also calculated for multiple line contingencies and for generator addition cases. Few transactions are chosen for which the results are shown. Those transactions are: |
| (i) Single transactions |
| Transaction between bus 23 to bus 30 |
| Transaction between bus 17 to bus 4 |
| Transaction between bus 10 to bus 15 |
| (ii) Multi-transactions |
| Transaction between buses 23, 17 and buses 30, 1 |
| Transaction between buses 23, 17, 13 and buses 30, 4, 5 |
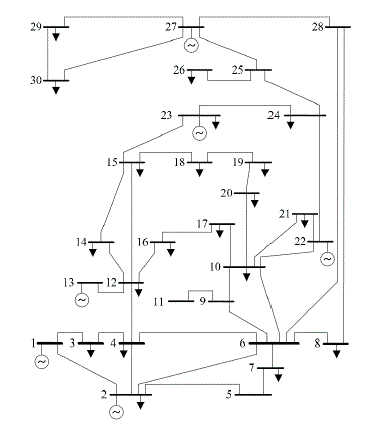
| Fig. 1 shows the single line diagram of IEEE 30 bus test system. The single line diagram shows the interconnectivity of transmission lines. It has six generator buses. All other buses are load buses. The bus number one is assumed to be the reference bus. |
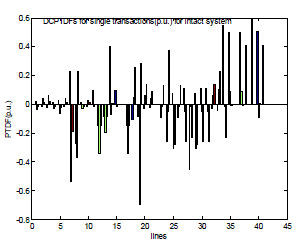
| Fig. 2 shows the values of DC Power Transfer Distribution Factor (DCPTDF) for single transactions in an intact system. The values of DCPTDFs are plotted in grouped bar chart form, for easier comparison of the different transaction values. |
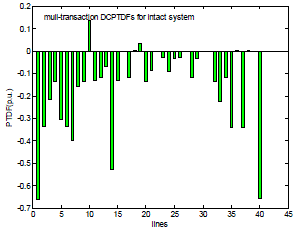
| Fig. 3 shows the values of DC Power Transfer Distribution Factor (DCPTDF) for multi-transaction case. DCPTDF has different values for different transactions, and the difference in the values can be easily seen through the figures. |
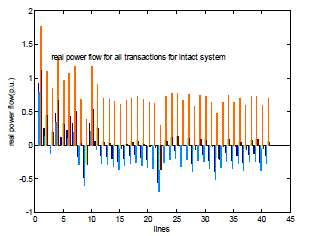
| Fig. 4 shows the values of real power flow in an intact system. This figure shows how the real power flow through the lines changes with every transaction. With every transaction the line flow in the transmission lines will get redistributed and hence the real power flow changes with every transaction. |
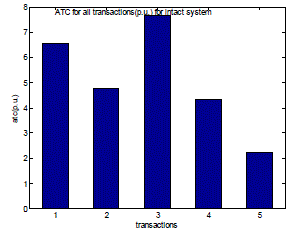
| Fig. 5 shows the values of Available Transfer Capability (ATC) for all transactions which are written above, in an intact system. These are also in grouped bar chart form, which expresses the difference in the values of ATC for different transactions straight away. |
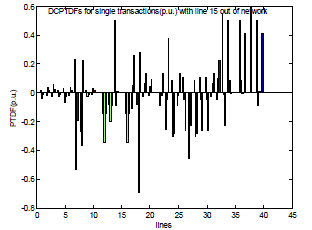
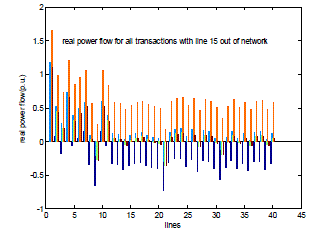
| Fig. 6 shows the values of DC Power Transfer Distribution Factor (DCPTDF) for single transactions with line number 15 out of the existing network. This expresses the values of DCPTDF in a line contingency case. With every line outage from the network, the value of DCPTDF changes. |
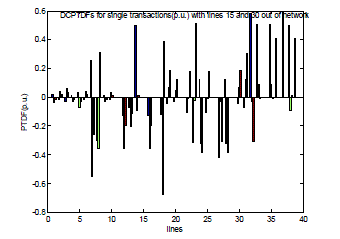
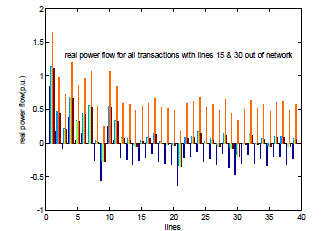
| Fig. 7 shows the values of DC Power Transfer Factor (DCPTDF) for single transactions with multiple lines outage case. Figure expresses the outage of lines, number 15 & 30 out of the test system. |
| Fig. 8 expresses the values of real power flow for single transactions with the outage of line number 15 from the network. With every outage of a line from the network, the line flow through the transmission lines will be redistributed and the real power will get changed. |
| Fig. 9 shows the values of real power flow for single transactions in a multiple line contingency case. The line numbers 15 & 30 are kept out from the network to consider the multiple line contingency case. |
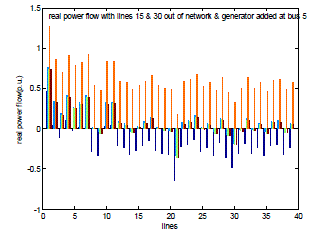
| Fig. 10 shows the values of real power flow for single transactions with multiple lines contingency and an extra generator added at bus number 5 of the network. Due to this thereal power flow will get changed and hence this affects the value of ATC. |
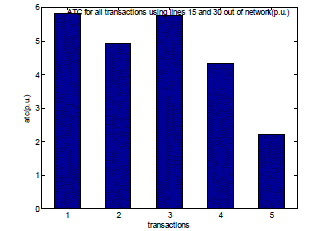
| Fig. 11 shows the values of Available Transfer Capability (ATC) for all the transactions with lines number 15 & 30 out of the existing network. The values of ATC changes with the change in real power flow through the lines. This is due to the outage of multiple lines from the network. |
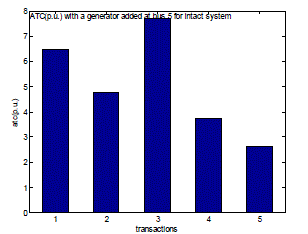
| Fig. 12 shows the values of Available Transfer Capability (ATC) for all transactions in an intact system with an extra generator added at bus number 5 of the network. Due to an extra generator addition, the real power flow will get changed and hence the ATC. |
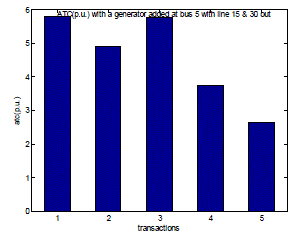
| Fig. 13 shows the values of Available Transfer Capability (ATC) for all transactions with lines 15 & 30 out of the network with an extra generator added at bus number 5 of the existing network. This is another case of change in real power flow of transmission lines. |
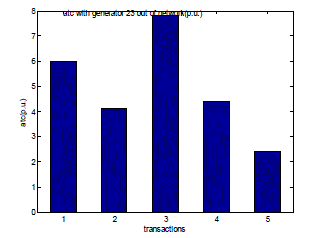
| Fig. 14 shows the values of Available Transfer Capability (ATC) for all transactions in generator contingency case. This figure expresses the values of ATC with generator from the bus number 23 out of the network. Because, like the line outage, there could be a generator outage also in a power system. |
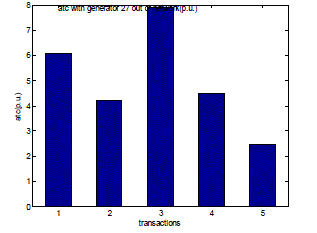
| Fig. 15 expresses the values of Available Transfer Capability (ATC) for all transactions with the generator from the bus number 27 out of the test system. Due to the generator outage the real power flow through the transmission lines changes and hence the value of ATC. |
CONCLUSION
|
| The ATC calculation is very important prior to any transaction and the calculation should be fast enough. That’s why in this paper the ATC is calculated using DC power flow. The ATC is calculated for both intact as well for contingency cases. Two types of contingencies are used in this paper, one is line contingency and the other is generator contingencies. Both the single and multiple line outage cases are taken and examine their effect on the value of ATC. GODFs are used to consider the generator contingencies. This paper shows how the real power flow for different transactions changes with both types of contingencies and by the addition of an extra generator to the existing network. Most of the operators used this method to find ATC before any transaction. By this method operators can easily choose the maximum ATC value transaction to maximize their profit. |
Figures at a glance
|
 |
 |
 |
 |
 |
| Figure 1 |
Figure 2 |
Figure 3 |
Figure 4 |
Figure 5 |
 |
 |
 |
 |
 |
| Figure 6 |
Figure 7 |
Figure 8 |
Figure 9 |
Figure 10 |
 |
 |
 |
 |
 |
| Figure 11 |
Figure 12 |
Figure 13 |
Figure 14 |
Figure 15 |
|
| |
References
|
- North American Electric Reliability Council (NERC), “Available Transfer Capability Definitions and Determination”, NERC Report, June 1996.
- Transmission Transfer Capability, “AReference Document for Calculating and Reporting the Electric Power Transmission Capacity of Interconnected Electric Systems”, North American Electric Reliability Council, May 1995.
- Hamoud G., “Assessment of Available Transfer Capability of Transmission Systems”, IEEE Transactions on Power Systems, Vol.15, No.1, pp. 27-32, February 2000.
- Fang R.S. & David A.k., "Transmission Congestion Management in an Electricity Market", IEEE Trans. On Power Systems, Vol.14, No.3, pp. 877-883, August 1999.
- Gravener, M., Nwankpa, H. C., &Yeoh, T., “ATC Computational Issues”, International Conference on Power System, Hawaii, pp. 1-6, 1999.
- H. D. Chinag, A. J. Flueck, K. S. Shah and N. Balu, “CPFLOW: A practical Tool for Tracing Power System Steady-State Stationary Behavior Due to the Load and Generation Variations”, IEEE Transactions on Power Systems, Vol. 10, No. 2, pp. 623- 634, May 1995.
- Alsac O. and Stott B., "Optimal load flow with steady state security", IEEE Trans. on Power Apparatus and Systems, Vol. PAS-93, No. 3, pp. 745-751, May/June 1974.
- Gao, B., Morison, G., &Kundur, P. “Towards the Development of a Systematic Approach for Voltage Stability Assessment of Large- Scale Power Systems”, IEEE Transactions on Power System, Vol.11, No. 3, pp. 1314 – 1324, 1996.
- Kumar, A., Srivastava, S. C., & Singh, S. N. “Available Transfer Capability (ATC) Determination in a Competitive Electricity Market Using AC Distribution Factors”, Electric Power Components and Systems, Vol.32, No. 9, pp. 927-939, 2004.
- P. venkatesh, R. Gnanadass, N. P. Padhy, “Available transmission capability determination using power transfer distribution factors”, International journal of emerging electric power systems, Vol. 1, Issue 2, pp. 1-14, 2004.
- Wood and B.F. Wollenberg, "Power Generation, Operation and Control", John Wiley, New York, 1996.
- D. Manjuree, ElhamMakram, “Investigation of distribution factors for bilateral contract assessment”, Electric Power Systems Research 66, pp. 205 – 214, 2003.
- Palanicharmy C., et al., "Privatizing and Restructuring Indian Power Sector - An Overview", IE (I) Journal-EL, Vol. 80, pp. 23-30, May 1999.
> |