KEYWORDS
|
| Image Processing, Image Segmentation, Cancerous Cell Detection, Feature Extraction, Histopathological Image Analysis, Active Contour Model, Morphological Feature Extraction, Computer Assisted Diagnosis |
INTRODUCTION
|
| Early stage cancerous cell detection using histopathological images is characterized by the identification of abnormal uncontrolled cell. Damaged cells divide and multiply to form a tumor that may be benign (non-cancerous) or malignant (cancerous) [5]. The distortion in the shape of a cell and the density of cluster of cells are the signatures of the presence of malignity in a body tissue. The proposed automated system makes use of morphological feature analysis, i.e., cell shape analysis in order to detect and classify cells as cancerous or non-cancerous. |
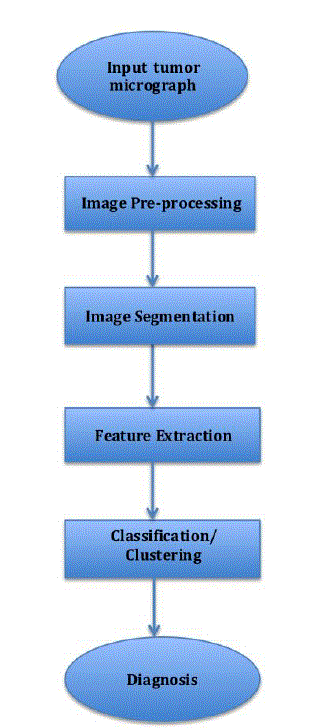
| The entire process is divided into a number of phases, namely, Image Pre-processing, Image Segmentation, Feature Extraction and Classification. |
| Image Pre-processing largely comprises undesirable noise removal and enhancement of image in order to determine focal areas of the image. For this purpose, we have applied techniques such as dilation and erosion. Median filtering and thresholding techniques were also applied. |
| After pre-processing, Image segmentation is done in order to extract clear cell boundaries for further processing. Many segmentation methods exist of which some are region based, texture based, gradient contour based, active contour based etc. We have employed the Chan-vese implementation of theActive Contour Model [2]. Overlapping and connectedclustering of cells are the primary problems prevailing in the segmentation domain. |
| Feature extraction is performed on these segmented images. In this phase, we extracted and analysed both textural and morphological features. Textural features are extracted and analysed using Grey Level Co-occurrence Matrix (GLCM) which is amongst the most frequently used techniques for texture analysis. |
| Morphological Feature Analysis, i.e., cell shape analysis has become a necessity in cell image processing and pattern recognition. Its main aim is the quantitative characterization of cell morphology for abnormality identification and classification. It forms a major part of the early stage cancer detection procedure. |
| The last phase deals with the classification of cells as cancerous or not. A number of supervised and unsupervised techniques are available for the classification/clustering of elements on the basis of extracted features. Few of the famous techniques are K-means, Fuzzy c-means, Super Vector Machine (SVM), Neural Networks, Decision trees etc. We have employed the General Classifier Neural Networks (GCNN) model for classification [1]. |
RELATED WORK
|
| Ahmad Chaddad et al [5], in April 2011, extracted Haralick’s Texture Features and Morphological Parametersfrom Segmented Multispectrale Texture Bio-Images for Classification of Colon Cancer Cells. They made use of Probabilistic Neural Network (PNN), the activation function for which is a function that measures the distance of unknownvariable to all known class variables |
| Baouchan Pang et al [8], in October 2010, proposed a machine learning technique for cell nucleus segmentation ofcolor histological image based on convolutional networks. They used gradient descent algorithm,convolutional network with 3 hidden layers and 8 feature maps per hidden layer for segmentation of cells from background. |
| Akif Burak Tosun et al [9], in July 2008, proposed a homogeneity measure based on the distribution of the objects that are defined to represent tissue components. Using this measure, they demonstrated a new object-orientedsegmentation algorithm and therefore, implemented the Object-oriented texture analysis for the unsupervised segmentation of biopsy imagesfor cancer detection. |
| T.S. Furey et al [10], in May 2000, made use of Support Vector Machine (SVM) for classification and validation ofcancer tissue samples using microarray expression data. |
| M.Dhivya et al [11], in March 2014, used Support Vector Machine (SVM) Classifiers in order to detect cancer using histopathological image analysis. |
| A. D. Belsare et al [7], in August 2012, reviewed the various techniques used in computer assisted histopathology image analysis for cancer detection andclassification. |
METHODOLOGY
|
| A. IMAGE PRE-PROCESSING |
| Primary aim in this step is to remove the large amount of random noise present in the images in order to determine the focal areas on which mathematical operations need to be performed. For this median filtering is used for enhancing image quality, i.e., forincreasing the contrast between the foreground (areas of interest) and background, which is followed by the thresholding technique for noise reduction. In thresholding, the intensity matrix of an image is used for identifying pixels under a threshold value which are considered noisy. These threshold values can be determined automatically by using several computational techniques. We have employed the Otsu method for determining an optimal threshold valueto maximize the between-class variance [8]. |
| B. IMAGE SEGMENTATION |
| Segmentation can be both region and boundary based. We employed both the approaches as each alone have their respective limitations. |
| The region based approach includes the thresholding technique which is used here to separate cells from the background but it does little to separate overlapping cells. For this, Watershed Algorithm is applied to detect the boundary lines between the overlapping cells. |
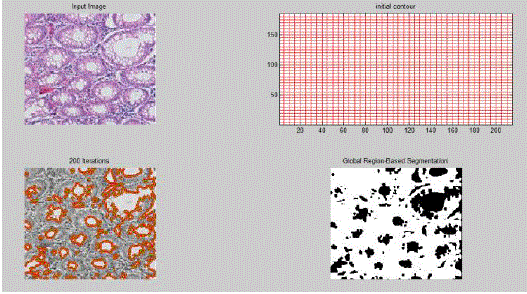
| Amongst the various boundary based techniques, Active Contour Model proves to be very powerful especially when irregular shapes such as cancerous cells are present within an image. In this method we begin with some initial contour, defined by a chosen function. We describe two major areas, namely, area inside contour and area outside contour. Then we evolve this contour on the basis of some level set function. Our target is to optimize this function by varying the parameters of the function. Chan-Vese segmentation [2] method has been used to optimally fit a two-phase piecewise constant model to the image. It is an excellent implementation of the Active Contour Model as unlike others, this method does not rely on edge detection. The segmentation boundary is represented using a level set function. Here, we used an energy fitting function as the level set function with the following four parameters:- |
| 1. Variation of grey/RGB inside contour |
| 2. Variation of grey/RGB outside contour |
| 3. Length of contour |
| 4. Area inside the contour |
| We applied penalties on the above four parameters. As all these parameters have a minimum value of zero, we optimized the function by varying these parameter values. We gave high percentage to the parameter which we wished to optimize the most and at the same time gave relaxation to the others. For example, to minimize the variation inside contour, i.e., to segment the area that is as uniform as possible in terms of RGB/Grey scale value then set its corresponding parameter’s value accordingly giving high percentage value to it.Image is described as I, with domain Ω then φ: Ω ->IR, a function H(φ) is known as Heaviside function which is defined as, |
| H(φ)=1, if φ >=0 |
| =0, if φ <0 |
| The level set function (i.e. energy fitting function) used:- |
 |
| where term 1 is an integral term representing total length of contour and μ is the weight given to this parameter. Hence, the combined term describes the penalty on total length of the contour. Similarly term 2 represents the penalty on the total area inside contour, term 3 represents the penalty on the variation of area inside contour and term 4 represents the penalty on variation of area outside the contour. |
 |
| The terms c1 and c2 represent the average value of area inside and outside the contour respectively. |
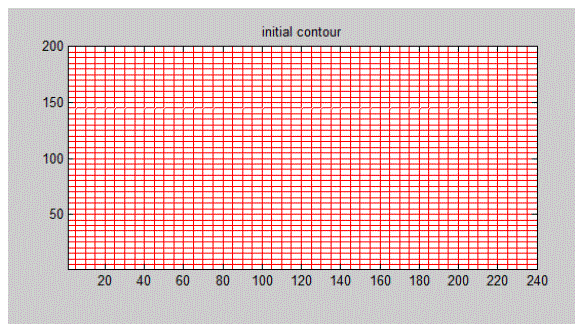
| Different types of initialization may be undertakensuch as single large circle, multiple circles etc. But one must keep in mind the fact that convergence of initial contour affects the final segmentation or output. |
| We initialized using a uniform continuous function:- |
 |
| Algorithm for segmentation using Chan-Vese method[2]:- |
| 1. Initialize the value of f |
| 2. Repeat for a large number of iterations |
| 3. Compute c1 and c2 for current value of f |
| 4. Update f according to the new values obtained |
| 5. Calculate the difference between fn and fn-1 |
| 6. If this difference is less than threshold |
| 7. Then break the loop |
| 8. Do reinitialization (optional) |
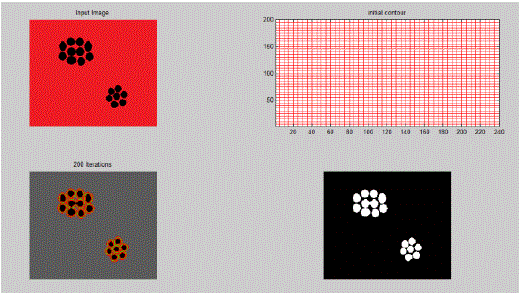
| In the above example clear segment boundaries are defined using Active Contour Model for a general image consisting of a random pattern of circles. Here,μ = 0.5, λ1 = 1, λ2 = 1 and ν is kept constant. As value of μ is kept low, therefore the boundary is not fine or not much penalty is given to contour length. Hence, it segments individual cells. |
| Using the same approach, we segmented individual cells which formed the primary input for feature analysis. |
| C. FEATURE EXTRACTION |
| After segmentation of cells from the image we perform morphological analysis of these cells. Morphological features are geometric features. Eight morphological parameters were used to classify segmented cells. These parameters include the following:- |
| 1. Area- The total number of pixels present in a cell. |
| 2. Perimeter- The total number of pixels present in the boundary of a cell. |
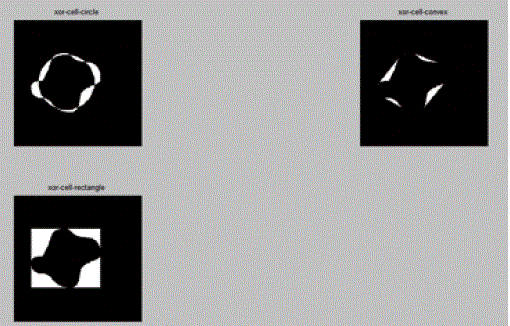
| 3. Xor cell-circle- It is applied between the cell and a circle having the same area and center of mass as of the cell |
| 4. Xor cell-convex- It is applied between the cell and a convex which covers the cell. |
| 5. Solidity- It is defined as the ratio of area of nucleus of a cell to its cell area. If the cell is abnormal then size of nucleus increases, hence, solidity also increases. |
| 6. Xor cell-rectangle- It is applied between the segmented cell and a rectangle covering it. |
| 7. Standard deviation along X-axis- If the cell is cancerous then cells distribution is disturbed and there is random distribution hence, if Std dev along any axis comes to be high then there is a possibility of cancer. |
| 8. Standard deviation along Y-axis- explanation same as above. |
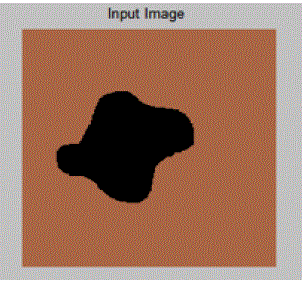
| Fig.7 shows a pattern taken as input and Fig.8 shows the corresponding xor-cell-circle, xor-cell-convex and xor-cellrectangle outputs. |
| D. CLASSIFICATION |
| Classification is done on the basis of features extracted for each cell. We extracted eight morphological features for each cell and arranged each feature in a 2-D array with each column representing a cell and rows corresponding to the eight morphological features taken into account– Area, Perimeter, XOR cell-circle, XOR cell-convex, Solidity, XOR cell-rectangle, Standard deviation in x directionand Standard deviation in y direction. We employed the General Classifier Neural Network (GCNN) model [1] in order to classify different cells among cancerous and non-cancerous group. |
| GCNN is a radial basis function based classification neural network proposed by Buse Melis Ozyildirim and Mutlu Avci in the year 2012. The neural network makes use of the gradient descent algorithm based optimization on the smoothing parameter. It has 5 layers; input, pattern, summation, normalisation and output. For each pattern layer neuron, a smoothing parameter is allocated. Smoothing parameters are updated to converge squared error of winner neuron to global minimum [1]. GCNN makes use of target values for each pattern layer neuron and provides regression based effective classification. |
CONCLUSION
|
| In some cases where the images contain high level of noise, the Active Contour Model fails to give clear segmented boundaries of cells. Also, as it works on the principle of optimization of energy function, there may be instances where area inside the cell and area outside the cell exhibit same value for a particular energy function thus ACM does not work accurately in such a case. Low resolution of the image, increased blurness and excessive overlapping of cells also pose a problem in cell segmentation process. |
| The Watershed algorithm along with the various thresholding and filtering techniques might lead to distortion of images in the form of blurring or unwanted removal of a few cells from the image. Also, there are cases where the cell and the background plazma both have the same value for particular measurement for a given feature such as the grey scale value. Here, there is no clear distinction between edge of the cell and that of the plazma, hence, may lead to inaccurate results. |
| Another problem faced during feature extraction phase was the inability of the system to discriminate between singlenucleus and multi-nuclei cells and therefore, both were treated as the same. GCNN proved to be comparable to other famous neural network models used for classification and clustering like Self- OrganisingMap (SOM), Probabilistic Neural Network(PNN), Generalised Regression Neural Network (GRNN), etc. Using the described methodology, we successfully segmented the images to indicate clear cell boundaries and also, classified each cell into their corresponding groups of cancerous and non-cancerous type on the basis of extracted features. |
| |
Figures at a glance
|
 |
 |
 |
 |
| Figure 1 |
Figure 2 |
Figure 3 |
Figure 4 |
|
 |
 |
 |
 |
| Figure 5 |
Figure 6 |
Figure 7 |
Figure 8 |
|
References
|
- Buse Melis Ozyildirim and Mutlu Avci, “Generalized classifier neural network,” Elsevier,Neural Networks 39 (2013) 18–26 19.
- T. Chan and L. Vese, “Active contours without edges,” IEEE Trans Imag Proc, Vol.10, No.2, 2001, pp. 266-277.
- Shengyong Chen, Mingzhu Zhao, GuangWu, Chunyan Yao, and Jianwei Zhang,Review Article on “Recent Advances in Morphological CellImage Analysis,” Hindawi Publishing Corporation, Computational and Mathematical Methods in Medicine, Volume 2012.
- Vandana, B. S.; Antony, P. J., “Automated Segmentation using Histopathology Images as a Diagnostic Confirmatory Tool in Detection of BoneCancer,” International Journal of Computer Applications . 2012, Vol. 57, p48-55. 8p.
- AHMAD.CHADDAD, CAMEL.TANOUGAST, ABBAS. DANDACHE and AHMED.BOURIDANE, “Extracted Haralick’s Texture Featuresand Morphological Parameters from Segmented Multispectrale Texture Bio-Images for Classification of Colon Cancer Cells,” Issue 2,Volume 8, April 2011.
- Cigdem Demir and Bulent Yener, “Automated cancer diagnosis based on histopathological images: a systematic survey,”TECHNICALREPORT, RENSSELAER POLYTECHNIC INSTITUTE, DEPARTMENT OF COMPUTER SCIENCE, TR-05-09.
- D. Belsare and M. M. Mushrif, “HISTOPATHOLOGICAL IMAGE ANALYSIS USING IMAGE PROCESSING TECHNIQUES: ANOVERVIEW,” Signal & Image Processing : An International Journal (SIPIJ) Vol.3, No.4, August 2012.
- Baochuan Pang, Yi Zhang, Qianqing Chen, Zhifan Gao, Qinmu Peng and Xinge You,”Cell Nucleus Segmentation in Color HistopathologicalImagery Using Convolutional Networks”, 978-1-4244-7210-9/10, 2010 IEEE.
- B. Tosun, M. Kandemir, C. Sokmensuer and C. Gunduz-Demir, “Object oriented texture analysis for the unsupervised segmentation ofbiopsy images for cancer detection”, Pattern Recognition, Vol.42, No.6, 2009, pp. 1104-1112.
- T.S. Furey, N. Cristianini, N. Duffy, D.W. Bednarski, M. Schummer and D. Haussler, “Support vector machine classification and validation ofcancer tissue samples using microarray expression data”, Bioinformatics 16(2000) 906-914.
- M.Dhivya, S.Deepa, S.Anbumani and R.Kavin, “Detection and grading of cancer using histopathological image analysis”, InternationalJournal of Electronics and Communication Engineering (IJECE), 2014, Vol.3, Issue 2,59-68.
|