ISSN ONLINE(2319-8753)PRINT(2347-6710)
ISSN ONLINE(2319-8753)PRINT(2347-6710)
Mahesh Kumar. M. K¹., M.K.Mahesh², Sushmitha.B.R¹
|
| Related article at Pubmed, Scholar Google |
Visit for more related articles at International Journal of Innovative Research in Science, Engineering and Technology
A water quality index (WQI) developed by the Canadian council of ministers of the Environment (CCME) was applied to chikkakere , a lake at Periyapatna, Mysore district , Karnataka state, India to study its impact on the protection of aquatic life. The index in the lake is rated as poor. The water quality is almost endangered or deteriorated and the conditions often deviate from natural levels, Microcystis aeruginosa blooms are dominant in the lake. These permanent blooms often cause huge fish kills. Nitchzia species are also dominant among Bacillariophyaceae indicating pollution. Overall the lake water is unable to protect aquatic life. The water quality failed to satisfy the parameters and its use for purposes like Drinking, Aquatic, Recreation, irrigation and livestock.
KEY WORDS |
| Physico- chemical, CCME- WQI, Chikka kere, fresh water. |
I. INTRODUCTION |
| Limnology is an interdisciplinary science which involves a great deal of detailed field as well as laboratory studies to understand the structural and functional aspects and problems associated with the fresh water environment from a holistic point of view (Adoni et al., 1985). The ecological studies of water bodies has gained immense important in recent year because of multiple use of water for human consumption on agriculture and industry resulting in most spectacular hydrobiological changes occurred in water system (Amit Kumar, 2012). The quality of water is determined by its physical, chemical and biological characters. |
| The quality of water can be determined by using various techniques as water quality indices, one such technique is the Canadian Council of ministries of the environment (CCME) Water quality Index (WQI). It facilitates to evaluate surface water for protection of aquatic life with the help of specific guidelines. The guidelines for each parameter are numeric values that define physical, chemical or biological characteristics of the water that cannot be exceeded without causing harmful effects (CEQG, 1999). |
II. STUDY AREA |
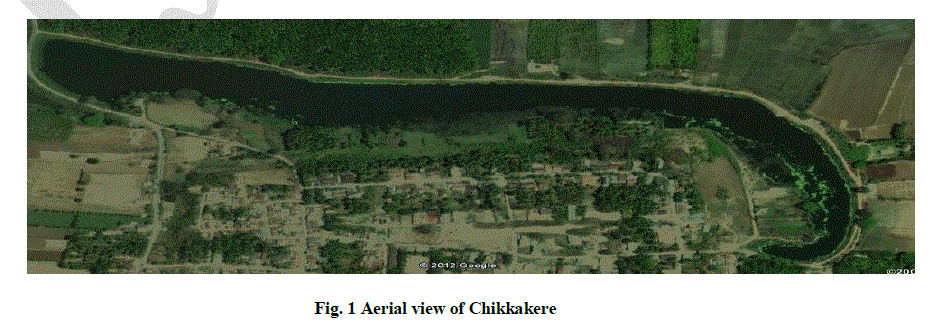
| Chikka kere: Kannada literature reveals that Kere means lake. Figure 1 shows the aerial view of the lake. |
 |
| Chikka kere is situated at latitude of 12° 20ÃÅÃâ 31.38Ãâ¹ÃÂN, and longitude 12° 05ÃÅÃâ 71.64Ãâ¹ÃÂE and is at an elevation of 2815ft. It is about 68 Km from Mysore city near Periyapatna in upparagere village. The sewage of village joins the lake. Three temples are situated near the lake and frequently animals sacrifice and ethical incarnation near the lake has been observed and reported. The lake water is used only for washing clothes and other anthropogenic activities. The water color is greenish and with less aquatic weeds |
III. MATERIALS AND METHODS |
| Surface water samples were collected in the second week of every month from July 2012 to June 2013 at three different sites of the lake like inlet, middle point and outlet. The water samples were analysed to study the physico- chemical parameters by following the standard methods of APHA (2005) and Trivedi and Goel (1984). The physical parameters like pH, Water temperature, Electric conductance, Total dissolved solids, Salinity and Turbidity were examined at the spot, and chemical parameters like Dissolved Carbon-di-oxide and Dissolved oxygen were also carried out near the spot. Other chemical parameters like Biochemical oxygen demand, Chemical oxygen demand, Nitrate, Phosphate, Total hardness, Calcium, Chloride and Total alkalinity were analysed at the laboratory. |
| CCME- WQI was developed with the intent of providing a tool for simplifying the reporting of water quality data (CCME 2001). It is a tool that provides meaningful summaries of water quality data that are useful to technical and policy individuals as well as the general public interested in water quality results. The CCME water quality was calculated by feeding the data to CCME- WQI Software- 1.0. |
IV. RESULTS AND DISCUSSION |
A. Physico- chemical parameters: |
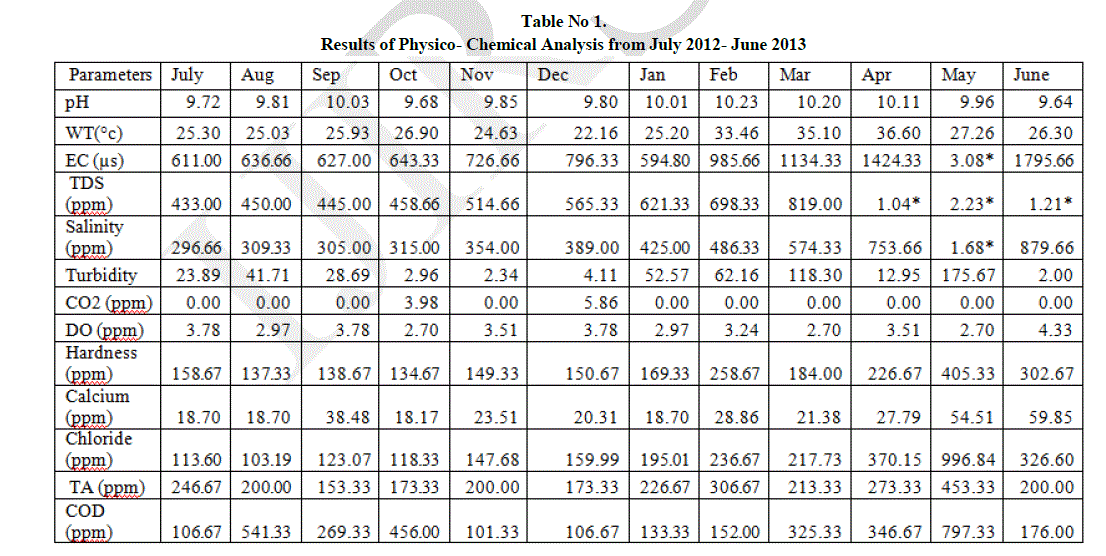
| The result of physico- chemical analysis of water samples has been listed in Table 1. |
 |
| pH is a term used universally to express the intensity of the acid or alkaline condition of a solution. The pH value ranges from 9.64 to 10.23. The minimum value of 9.64 was recorded in June and maximum of 10.23 in February. It has been mentioned that the increase in pH value appears to be associated with increased use of alkaline detergents in residential areas and alkaline material from wastewater is from industrial areas (Chang, 2008). |
| Temperature is an important factor which regulates the biogeochemical activities in the aquatic environment. The water temperature ranges from 22.16°C to 36.60°C. The minimum value of 22.16°C was recorded in December and maximum of 36.60°C in April. Electric conductance is a tool to assess the purity of water and is the measure of water capability to transmit electric current. The Electric conductance recorded ranges from 594.80 ppm to 3.08 ppt. A minimum value of 594.80 ppm was recorded in January and maximum of 3.08 ppt in May. |
| Total dissolved solids represent the amount of soluble inorganic substance in water. Total dissolved solids observed in the lake ranges from 433 ppm to 2.23 ppt. Minimum value of 433 ppm was recorded in July and maximum of 2.23 ppt in May. The values are generally higher in the summer season is mainly due to reduction in water volume (Nayan khound et al, 2012). The entry of sewage, urban runoff, industrial waste water influence the increase in the concentration of Total dissolved solids. |
| Salinity observed in the lake ranges from 133 ppm to 1010 ppm. The minimum of 133 ppm was recorded in January and maximum of 1010 ppm in May. Salinity in water is due to the presence of ions mainly carbonates and bicarbonates which results in the pollution of water body. Salinity in summer season is increased highly due to lowering of water level. |
| Turbidity is the measure of suspended matter in water. Suspended matter often includes mud, clay and silt. Turbidity ranges from 2 NTU to 175.67 NTU. The minimum value of 2 NTU was observed in June and maximum of 175.67 NTU in May. The high turbidity during summer season may be due to addition of large amount of sewage waste and pollutants from the surrounding areas (Verma et al, 2012). |
| Dissolved Carbon-di-oxide ranges from 0.00 ppm to 5.86 ppm. No Carbon-di-oxide of 0.00 ppm was recorded in July, August, September, November, January, February, March, April, May and June and maximum of 5.86 ppm in December. The increase in Carbon-di-oxide is due to overgrazing of microorganisms in the lake (Sumita srivastava, 2010). |
| Dissolved oxygen values ranges from 2.70 ppm to 4.33 ppm. The minimum value of 2.70 ppm was recorded in October, March and May and maximum value of 4.33 ppm in June. The increase in DO is influenced by the moderate temperature. Lower DO indicates the pollution of the lake.The regular addition of large quantities of sewage and detergent into the lake from nearby residential localities is responsible for higher level of hardness (Kaur et al, 1996 and Mohanta et al, 2000). Hardness ranges from 134.67 ppm to 405.33 ppm. The minimum of 134.67 ppm was recorded in October and maximum of 405.33 ppm in May. The high value of hardness during summer season may be due to the evaporation of water and addition of Calcium and magnesium salts (Verma et al, 2012). |
| Calcium concentration in the lake ranges from 18.71 ppm to 59.85 ppm. A minimum of 18.71 ppm was recorded in October and maximum of 59.85 ppm in June. In aquatic system, naturally calcium is present but the addition of high quantity of sewage waste is also responsible for the increased amount of calcium (Verma et al, 2012). |
| Chloride is not utilized directly or indirectly for aquatic plant growth and hence its existence in the aquatic system is regarded as pollution (Jayalakshmi et al, 2011). Chloride ranges from 103.19 ppm to 996.84 ppm in the lake. A Minimum of 103.19 ppm was observed in August and maximum value of 996.84 ppm in May. High chloride concentration in the lake water may be due to high rate of evaporation or due to organic waste of animal origin (Prasad et al, 1985 and Purohit, 1990). |
| Total alkalinity is due to the presence of carbonates and bicarbonates of calcium and magnesium discharged from Kitchen waste water. Amount of total alkalinity in the lake ranges from 153.3 ppm to 453.33 ppm. A Minimum concentration of 153.3 ppm was observed in September and maximum of 453.3 ppm in May. The high value of total alkalinity in the lake may be due to cattle bathing and laundering of clothes (Animesh Agrawal et al, 2011). |
| Chemical oxygen demand (COD) is commonly used to indirectly measure the amount of organic compounds in water. This makes COD as a useful indicator of organic pollution in surface water (King et al, 2003). COD values ranges from 101.33 ppm to 797.33 ppm. A minimum of 101.33 ppm was observed in November and maximum of 797.33 ppm in May. Higher value of COD pointing to deterioration of water quality was likely caused by the discharge of municipal waste water (Mamais et al, 1993). |
| Biochemical oxygen demand (BOD) refers to the oxygen used by the micro organisms in aerobic oxidation of organic matter, therefore with the increase in the amount of organic matter in the water BOD increases. BOD values ranges from 32.44 ppm to 54.07 ppm. A minimum value of 32.44 ppm was observed in January and maximum of 54.07 ppm in May. Higher contents of organic load as well as high proliferation of microorganism are the causative factors for maximum BOD levels (Shukla et al, 1989). |
| Biochemical oxygen demand (BOD) refers to the oxygen used by the micro organisms in aerobic oxidation of organic matter, therefore with the increase in the amount of organic matter in the water BOD increases. BOD values ranges from 32.44 ppm to 54.07 ppm. A minimum value of 32.44 ppm was observed in January and maximum of 54.07 ppm in May. Higher contents of organic load as well as high proliferation of microorganism are the causative factors for maximum BOD levels (Shukla et al, 1989). |
B. CCME water quality index |
 |
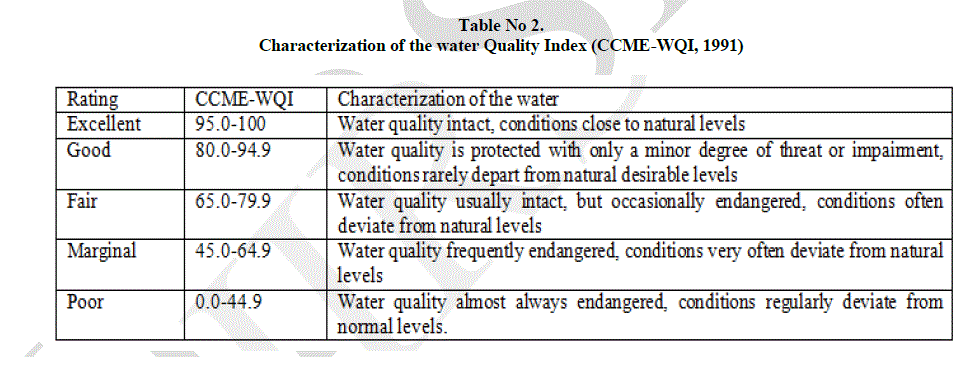
| Table 3. Shows the result for CCME water quality index of Chikka kere. The CCME model consists of three measures of variance from selected water quality objectives (Scope, frequency and amplitude). From results of CCME water quality it is clear that the water quality is poor for overall purpose, drinking, aquatic, recreation, irrigation and livestock. The index value ranging from minimum 6 to 32, 6 for both recreation and irrigation, 12 for aquatic, 15 for drinking, 21 for overall and 32 for livestock. |
| The number of tested data for overall is 9 from which 7 have failed, for drinking 7 variables were tested out of which 6 variables have failed, 3 data were tested for aquatic in which all have failed, for recreation only one variable was tested which has failed, 2 variables were tested for irrigation both of which have failed and for livestock 4 variables were tested out of which 2 variables have failed. |
| Failing data were TDS, Turbidity and BOD for overall and drinking purpose. For aquatic failing parameters were Turbidity and BOD. For recreation it was turbidity and for irrigation and livestock it was BOD. Passing data were DO and total alkalinity for overall and livestock and total alkalinity for drinking purpose. Occasional passing data were salinity, hardness, COD and EC for overall purpose, for drinking it was hardness, COD and EC, for aquatic, irrigation and livestock occasionally passing data were salinity, COD and EC respectively. |
 |
V. CONCLUSION |
| The results of Physico- chemical analysis and CCME- WQI indicates that the lake is unfit for use and reached the eutrophication state due to various anthropogenic activities, sewage disposal and organic pollution which become a threat to the ecosystem of water body. |
ACKNOWLEDGMENT |
| The authors would like to thank the Principal, Yuvaraja's College, Mysore for providing laboratory facilities and also the University of Mysore for giving UGC Non- NET fellowship for financial assistance. |
References |
|