ISSN ONLINE(2319-8753)PRINT(2347-6710)
ISSN ONLINE(2319-8753)PRINT(2347-6710)
Manju Meena1, Bharat Singh Meena1, Uttra Chandrawat1, Ashu Rani2,*
|
| Related article at Pubmed, Scholar Google |
Visit for more related articles at International Journal of Innovative Research in Science, Engineering and Technology
Atmospheric samples of wet and dry depositions were collected on seasonal variation basis at various sampling sites situated in five different zones from an industrial city Kota, India during 2012-2013. The analytical results show seasonal and spatial variation in metal concentration (crustal and anthropogenic) during monitoring months. Average concentrations of heavy metals (Cu, Cd, Zn and Pb) were higher in winter and lower in summer and reversed trend was observed in crustal metals (Fe, Ca and Mg). Overall, heavy metal concentrations showed the following trend - Zn > Pb > Cu > Cd in both wet and dry depositions. Analysis of enrichment factor of heavy metals showed moderately enriched Cu, Cd, Zn, and Pb. The study clearly indicates that wet and dry depositions varied as function of sampling sites, seasons and distance from coal based thermal power plant.
Keywords |
| Wet and dry depositions, Heavy metals, Enrichment factor, Thermal power plant |
INTRODUCTION |
| The urban atmosphere is subjected to large inputs of anthropogenic contaminants arising from both stationary (power plants, industries, incinerators, and residential heating) and mobile sources (road traffic) [1]-[4]. According to their physical and chemical properties, these heavy metals are partitioned between particulate, liquid, and vapour phases and are subsequently transported to the Earth’s surface through dry and wet deposition [5]. Most trace elements in terrestrial ecosystems originate from atmospheric wet and dry depositions, which are recognized as important processes determining pollutant dynamics in the atmosphere. The magnitude of atmospheric deposition and the ratio of wet to dry deposition is controlled among others by emission sources, distance to emission sources (thermal power plant) and the sampling site [6] and meteorological conditions, e.g. prevailing wind directions, frequency and amount of precipitation. Because either mode, wet or dry, may contribute equally to or predominate in total deposition, it appears essential to include both wet and dry deposition to estimate loading from atmospheric deposition. From a biogeochemical perspective, the characterization of total atmospheric deposition is relevant in order to identify the variability and sources of the atmospheric pollutants [7]. Because of presence of Kota Super Thermal Power Station (KSTPS), a major coal based thermal power plant, where huge amount approximate 3000 metric tonne per day of fly ash (homogeneous mixture of several metal oxides viz. SiO2, Al2O3, Fe2O3, CaO, MgO, CuO, CdO, MnO2, NiO2, ZnO, PbO etc.) is produced and released in the atmosphere, the study of concentrations of heavy metal in atmospheric precipitation in and around Kota city is thought to be carried out to measure heavy metal toxicity. Besides this, few large scale industries including DCM Shriram Consolidated Limited (DSCL), Multimetals Limited, Samtel Glass Limited, Chambal Fertilizers and Chemicals Limited (CFCL), Shriram Fertilizers and Metal India, Shriram Rayons and a number of Kota stone cutting polishing units further enhance the heavy metal burden of the city environment. In the present study, a total of 90 wet and 490 dry deposition samples were analyzed at various sampling sites situated in five different zones in and around the city Kota under the influence of KSTPS and several large & small scale industries. The study aims at identifying concentrations of seven metals i.e. Fe, Ca, Mg, Cu, Cd, Zn and Pb of crustal and anthropogenic origin during 2012-2013 in order to evaluate the influence of the main anthropogenic activities in the area during the meteorological events. |
II. BACKGROUND THE STUDY AREA |
| Kota is one of the major industrial city of Rajasthan state in India. It is situated 25011 N and 75051 E on the eastern bank of river Chambal in the southern part of Rajasthan with an elevation of 271 meters (889 feet) above sea level on the south- east of Aravali ranges. The total geographical area of the district is 5,21,133 hectares as per land. According to the 2011 census Kota district has a population of 19,50,491. Kota has a semi arid climate with temperature ranging from 80C – 470C having long summers up to six months. The Rainy season follows with comparatively lower temperatures, but higher humidity and frequent downpours. The average annual rainfall is about 885.6 mm. Many large and small scale industries are present due to availability of river water and power. Kota district is a power production centre of the country where coal based KSTPS is situated. A popular cost effective building stone i.e. Kota stone is being excavated, cut to various sizes and polished in more than 100 units generating huge amount of slurry waste containing mainly CaO, MgO and SiO2. |
III. MATERIALS AND METHODS |
Sampling Sites: |
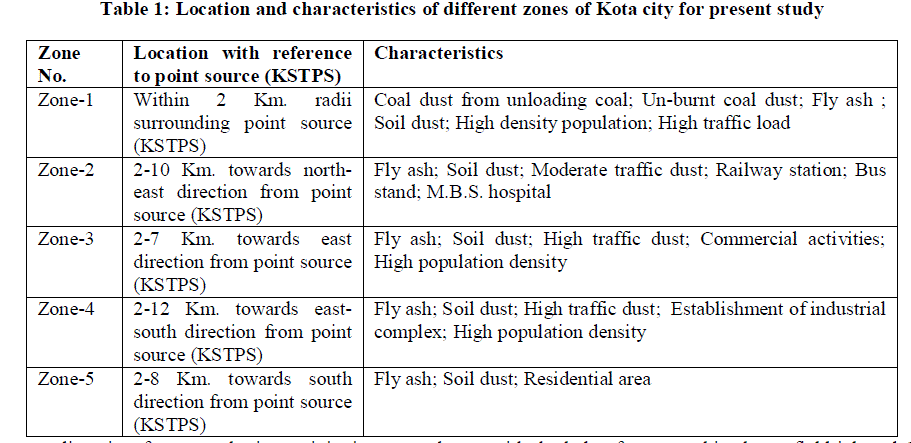 |
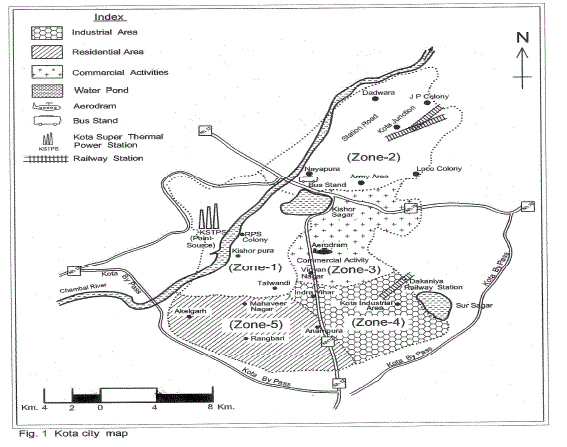
| The sampling sites for atmospheric precipitation were chosen with the help of cartographic charts, field job and GPS (Global Positioning System). The choice of the sampling sites followed some criteria laid by ASTM D 5111 Standards (ASTM 1996a). These criteria were: I) distance from polluting sources (approximately a radius of 12 km from KSTPS); ii) predominant wind direction; iii) the distance from obstacles that could interfere in sampling (twice the height of obstacles); and iv) logistics (security, access, electric power supply).The entire city area was divided into five zones (Fig.1) and monitoring sites were chosen for collection of wet and dry deposition samples. The location with respect to the point source KSTPS of emissions and possible source of heavy metal emission in the zones are presented in Table I. |
 |
Sample Collection and Analysis: |
| A total of 90 rainwater (wet) samples covering every rain event have been collected, during monitoring period i.e., from January to December, 2012, using a polypropylene funnel of 20 cm diameter fitted onto 3 L capacity polyethylene bottle at all the sampling stations in each zone. The containers were washed with milli-Q water (conductivity < 2 μS. cm-1) and were fixed at about 2 m above the ground level to avoid surface contamination. To avoid dry deposition, the containers were deployed for sampling at the onset of rain and retrieved soon after the rain (Pandey and Singh 2012). The rain water samples were filtered and then acidified to pH < 2 with ultra – pure HNO3. Dry deposition (free fall dust) samples were collected monthly in both summer (March, April and October) and winter (January, February, November and December) months in 2012-2013. Dust samples falling freely due to gravity, were collected at all the zones at a height of 6 m above the ground surface on plastic trays of 1 m2 area. All free fall dust samples collected, here, represent only dry fall out, as there was no rain during the sampling period. After sampling, dry depositions were scraped off the trays and these trays were washed with milli-Q water to recover stuck particles. The water was evaporated slowly at 50 0c and the residue was mixed and homogenized with the scraped samples [8]. Then, samples were digested for the analysis. For analysis, 1 gm of sample was placed in a covered beaker (to avoid the loss of Cd and Pb) containing a mixture of high purity HNO3 (5 mL) and allowed to remain over night at ambient temperature. After slow evaporation to dryness, 2 mL of HNO3 was added and the solution was extracted with 0.1 N HCl and diluted milli-Q water, filtered on prewashed whatman filter paper no. 42 and diluted with 1% HNO3 in a 50 mL polyethylene bottle [9]. The concentrations of 6 metals (Fe, Zn, Cu, Cd, Mg and Pb) were measured by Direct Air – Acetylene Flame method (Atomic Absorption Spectrophotometer - Shimadzu-6300). The Ca metal concentration was determined using Flame Photometer (Systronics -128). Certified standard solutions (CertiPURïÃâ¬Ãª - MERCK) were used for calibrating the instruments. For quality control, the absence of any kind of interference was ensured during analyzing the samples undiluted and in 1:10 dilution on finding the comparable results. Baseline stability of the instrument was verified by analyzing a blank between samples or standards readings and rezeroed when necessary [10]. |
IV. RESULT AND DISCUSSION |
Seasonal Variations of Heavy Metals Concentration: |
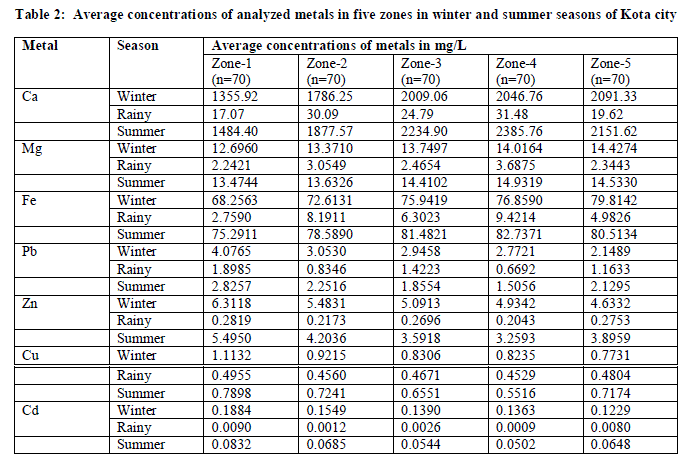
| The average concentrations of all the analyzed metals at various sampling sites of five different zones undertaken for the study in both wet and dry depositions are summarized in Table 2. Heavy metal pollution due to Cu, Cd, Zn and Pb is found to be highest in zone 1 which is within 2 km radii surrounding the point source KSTPS in both wet and dry depositions. In rainy season, the concentrations of heavy metals (Cu, Cd, Zn and Pb) in zone 5 were higher than those measured in zones 3, 2 and 4. The main direction of wind in studied zone is south-west (13.85%) that is the best reason for increasing heavy metal concentrations in zone 5. In dry season, zone 5 was found to have lowest concentration for all the above said metal species in both the seasons (winter and summer) which is a residential area mainly with less number of anthropogenic sources. North-east (8.2%) direction of wind blow from KSTPS encourages the worrying levels of heavy metals in zone 2 originated from fly ash. The average heavy metal concentrations in wet and dry depositions showed the following trends- Zn > Pb > Cu > Cd. Despite the use of lead free petrol, high concentration of Pb could be due to Pb particles in street dust accumulated from earlier vehicular exhaust for a long time due to its higher residence time in environment [11]. Seasonal variation of the average concentrations of all the analysed metals were generally consistent from site to site, but were different depending on the metal species. At all the zones, concentrations of crustal metal species viz. Ca, Mg and Fe were lowest in winter and highest in summer while heavy metal species viz. Cu, Cd, Zn and Pb concentrations were highest in winter and lowest in summer. |
 |
| The variability with origin (crustal and anthropogenic) and sampling season may be related to different wind strengths in summer and winter seasons as shown in Table 3. The high wind strength during summer is responsible for deflation or entrainment and transport of crustal metals as coarse particles are influenced by gravity [12] whereas wind strength available to transport these metals drops significantly in the winter. Secondly, the stable and cold conditions during winter months favour the prolonged life of ambient particles in the atmosphere leading to elevated levels of free fall particulate matter. |
 |
Enrichment Factor: |
| Calculation of enrichment factor (EF) values helps to determine whether a certain element has additional or anthropogenic sources other than its major natural sources. Since calcium (Ca) has been used as a reference element for an EF evaluation, assuming that the contribution of its anthropogenic sources to the atmosphere is negligible [13], this study used the EF calculation formula as follows: |
 |
| Where x is the concentration of the ion of interest and c is the concentration of the reference ion. |
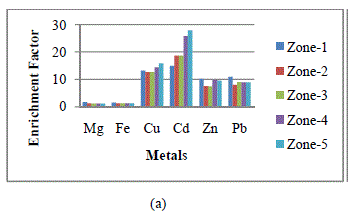
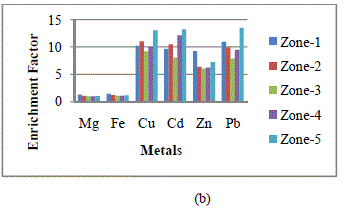
| If the EF value approaches unity, then crustal sources are predominant. In general, an EF > 5 indicates that a large fraction of the element can be attributed to non- crustal or anthropogenic sources [14]. Fig. 2 shows the seasonal mean enrichment factors (EFs), based on average seasonal metal concentration of heavy metals identified in wet and dry deposition samples collected from the five zones. EF values for Cu, Cd, Zn and Pb were much higher than 5. This indicates that the collected samples were extremely contaminated by anthropogenic source i.e. coal based KSTPS. |
 |
 |
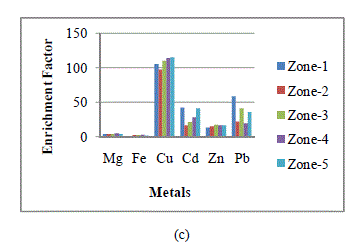 |
| Fig. 2: Enrichment factors of metals in wet and dry depositions at each zone in Kota city in (a) winter, (b) summer and (c) rainy seasons |
V. CONCLUSION |
| The measurement of wet and dry deposition samples concentrations of seven metal species were conducted at various sampling sites situated in five different zones in and around Kota city during 2012-2013. The results showed that the concentrations of studied heavy metals in both wet and dry depositions were high in zones with higher anthropogenic activities. The residential zones were found to have less heavy metal burden, however, wind blow towards zone 5 can cause this scourge sometimes here too. In dry deposition, average metal concentrations were found to be the lowest in winter and highest in summer for crustal metal species viz. Ca, Fe and Mg and reverse trend was observed for anthropogenic origin metal species viz. Cu, Cd, Zn and Pb i.e., highest in winter due to stable and cold meteorological conditions (low temperature, wind strength and relative humidity) and lowest in summer. The enrichment coefficients of the heavy metals viz. Cu, Cd, Zn and Pb in the dust fall were found to be greater than the unity suggesting their anthropogenic origin. In view of the worrying level of heavy metals in the atmosphere, it is evident that role of location of KSTPS and various industries in the city in the emission of metals is significant and there is an urgent need to maintain the receptive capacity of the atmosphere by adopting proper abatement procedures by industrial and mining sector for maintaining the healthy environment to breathe. |
ACKNOWLEDGEMENTS |
| The authors are thankful to A. Mukhopadhyay and DST, New Dehli and DST – FIST facility, Govt. College, Kota and University of Kota for analytical support and Minor Research Project sanctioned by UGC, New Dehli for the financial support of this work. |
References |
|