ISSN ONLINE(2319-8753)PRINT(2347-6710)
ISSN ONLINE(2319-8753)PRINT(2347-6710)
Dr. Falguni Parekh1 and Kevin Pramodchandra Prajapati2
|
| Related article at Pubmed, Scholar Google |
Visit for more related articles at International Journal of Innovative Research in Science, Engineering and Technology
Climate can be defined as the ―expected weather‖ and when changes in the expected weather occur, we call these climate changes. With respect to the relations between the hydrological cycle and the climate system, every change on the climate could affect all meteorological parameters and this leads to change in the crop water requirement in agriculture. Considering this, a study was carried out to assess the impact of climate change on crop water requirement for the crops grown in the Sukhi command area of Vadodara district, Gujarat. For this study, daily meteorological data like maximum temperature, minimum temperature, wind speed, sunshine hours and rainfall for the period 2003 to 2009 are used. Cropping pattern data and crop data was used for this study. Future climate data were predicted for the periods of 2011-2030, 2046-2065 and 2080-2099 considering A2 scenario of the Intergovernmental Panel on Climate Change Special Report on Emissions Scenarios (IPCC SRES) using stochastic weather generator named Long Ashton Research Station Weather Generator (LARS-WG 5.0) considering HADCM3 (Hadley centre Unified Model 3) scenario file. Reference crop evapotranspiration (ETo) was determined using mean monthly meteorological data with the help of CROPWAT 8.0 and then crop water requirement (ETc) was determined. Results shows the clear effect of climate change on crop water requirement of Rabi and Hot Weather crops. Results shows that crop water requirement of all Hot Weather crops (Millet, Ground nut, Maize, Small vegetables and Tomato) in all future periods is increasing as compared to base period 2003-2009. Crop water requirement of Rabi crops (Wheat, Sorghum, Maize, Small Vegetables, Tomato, Gram and Cowpeas) shows negligible decrease in crop water requirement in the period 2011-2020 but all crops shows considerable increasing water requirement in the period 2021-2030 including the periods 2046-2065 and 2080-2099 as compared to base period 2003-2009. For meeting the increasing water demand and to increase yield, over all water resources should be increased by doing water conservation practices effectively and also farmers’ should be motivated to use drip or sprinkler irrigation system instead of flooding methods
Keywords |
| Climate change, Future climate data prediction, Evapotranspiration, CROPWAT, LARS-WG, Crop water requirement. |
INTRODUCTION |
| Climate change is becoming the hottest topic to the entire globe. When it comes to defining climate, in general it can be define as âÃâ¬Ãâ¢expected weatherâÃâ¬Ãâ. When changes in the expected weather occur, we call these climate changes. Climate may change in different ways, over different time scales and at different geographical scales. Since climate is changing, scientists have become interested in global warming, due to mankind's impact on the climate system, through the enhancement of the natural greenhouse effect. |
| Since climate change is likely to have impact on the hydrological cycle and consequently on the available water resources and agricultural water demand, there are concerns about the impacts of climate change on agricultural productivity. Furthermore, industrialization and the extended use of fossil fuels have lead to a great increase in the atmospheric concentrations of greenhouse gases. With respect to the relations between the hydrological cycle and the climate system, every change on the climate could affect parameters such as precipitation, temperature, runoff, stream flow, groundwater level, and this leads to not only change in the crop water requirement in agriculture but also industrial and domestic water consumption and demand will also change. |
| General Circulation Models (GCMs) are used to simulate the present and projected future climate considering various climate change scenarios. A1, A2, B1 and B2 are four main climate change scenarios family. Scenarios are constructed based on the assumptions of future human activities and future technological growth. LARS-WG (Long Ashton Research Station Weather Generator) is a stochastic weather generator which can be used for simulation of weather data considering various GCM’s (General Circulation Model) climate change scenario files. In this literature, LARS-WG is used for generating simulated climate data based on SRES A2 climate change scenario. Crop water requirement can be defined as âÃâ¬Ãâ¢the depth of water needed to meet the water loss through evapotranspiration of a disease-free crop growing in large fields under non restricting soil conditions including soil water and fertility and achieving full production potential under the given growing environmentâÃâ¬Ãâ.In general words, it is the amount of water needed by the various crops to grow optimally. |
| Paper is organized as follows. Section II gives the detail about study area and types of data collected for this study. Methodology is described in Section III with detail about LARS-WG. Section IV presents results showing results of climate change on water requirement of Rabi and Hot Weather crops of study area. Finally, Section V presents conclusion. |
STUDY AREA AND DATA COLLECTION |
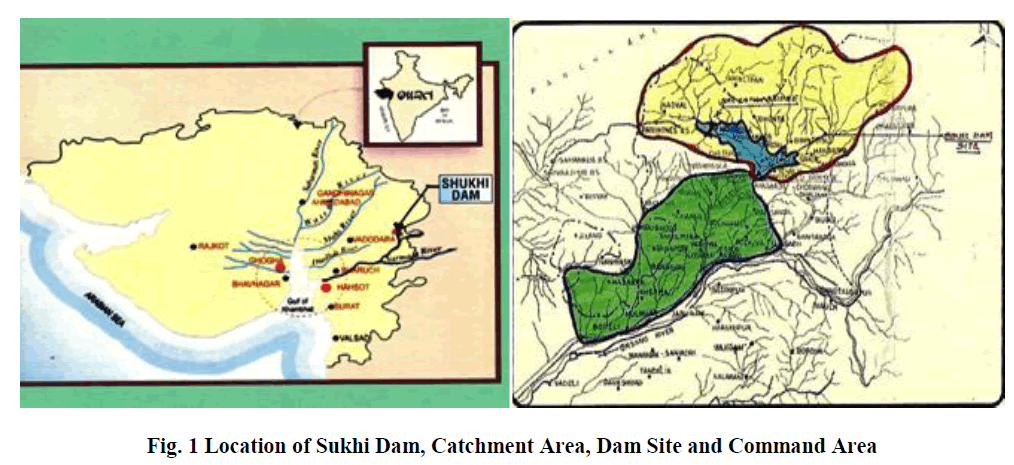
| The present study is carried out on the command area of Sukhi Reservoir located in Gujarat state. Sukhi Reservoir Project, one of the major Water Resources projects is envisaged, constructed and developed by Govt. of Gujarat at the confluence of Sukhi and Bharaj River near village Sagadhra and Khos in Pavijetpur and Chhota-Udepur Talika respectively of Vadodara District in Gujarat. Sukhi Reservoir has its total catchment area of 411.81 sq.Km. Among this total area, 25.90 sq.Km. is in Madhya Pradesh and 385.91 sq.Km. in Gujarat. Total 17094 Hectare land of 92 villages of 3 Talukas of Vadodara district and 3607 Hectare land of 39 villages of 2 Talukas of Panchmahal district is benifited due to this project. Figure 1 shows the location of Sukhi dam, catchment area, dam site and command area of Sukhi reservoir. |
 |
| For this study, meteorological data were acquired from the State Water Data Centre, Gandhinagar which include daily data of maximum temperature, minimum temperature, wind speed, sunshine hours and rainfall for the period 2003 to 2009. Cropping pattern data included season wise crops grown in study area was acquired from Irrigation Department Sub division No. 10, Bodeli. Crop data includes Length of crop development stages in days and crop coefficient (Kc) for each crop of all seasons were taken from Food and Agriculture Organization (FAO) Irrigation and Drainage Paper No. 56. |
METHODOLOGY |
| Methodology is divided into three parts: (1) Generation of future climate data using LARS-WG 5.0, (2) ETo calculation using CROPWAT, (3) Calculation of Crop Water Requirement. |
LARS-WG 5.0 |
| LARS-WG developed by Semenov and Barrow, is a stochastic weather generator model that has no limitations on the size of the watershed and can be used for simulation of weather data at a single site (synoptic station of the study area), under both current and future climate conditions. These data are in the form of daily time series of climate variables including precipitation (mm), maximum and minimum temperature (°C) and sunshine hours (hr). |
(1) PROCEDURE TO GENERATE FUTURE CLIMATE DATA |
| The process of generating synthetic weather data can be divided into three distinct steps: |
| 1. Model Calibration - site analysis - observed weather data are analysed to determine their statistical characteristics. |
| 2. Model Validation – Q test - the statistical characteristics of the observed and synthetic weather data are analyzed to determine if there are any statistically-significant differences. |
| 3. Generation of Synthetic Weather Data - generator - Synthetic data corresponding to a particular climate change scenario are generated by applying global climate model-derived changes in precipitation, temperature and solar radiation to the LARS-WG parameter files. |
(2) ETo CALCULATION USING CROPWAT |
| In order to calculate reference evapotranspiration (ETo), using the Penman-Monteith method, monthly mean data are required, including Maximum and minimum temperatures (°C), Sunshine hours (hour), Wind Speed (km/day), Relative Humidity (%). Wind speed and Relative humidity could not be simulated using LARS-WG. In order to incorporate wind speed in estimation of ETo, long term observed monthly average wind speed in the period of 2003 to 2009 are used and it is assumed that the wind speed would not significantly change in the future. Monthly relative humidity (RH) is assumed to be a function of temperature, sunshine hours (Sun) and rainfall of the same month (Rain) as presented here. |
| RH = f (Tmin, Tmax ,Sun ,Rain) |
| Minitab software is used to fit the multivariable linear regression function to find Relative Humidity for future years (i.e 2011-2030, 2046-2065, 2080-2099) |
| Humidity = 118 + 2.46 T min - 3.18 T max - 0.756 Sunshine Hours + 0.442 rain |
| Finally, reference evapotranspiration (ETo) in (mm/month) is calculated using CROPWAT model, for past (2003-2009) as well as future weather data (2011-2030, 2046-2065, 2080-2099). |
(3) CALCULATION OF CROP WATER REQUIREMENT |
| For this study following crops are considered. In sukhi command area crops viz., Wheat, Sorghum, Maize, Gram, Cowpeas, Small Vegetables and Tomato are grown in Rabi season and crops viz., Millet, Groundnut, Maize, Small Vegetables and Tomato are grown in Hot Weather season. Kc curves are drawn for all crops taking standard values of crop development period, crop coefficient from FAO 56 and approximate planting date. Monthly Kc values are calculated for Rabi and Hot Weather crops. Finally crop wise ETc is calculated using the formula given below. |
| ETc = Kc × ETo |
EXPERIMENTAL RESULTS |
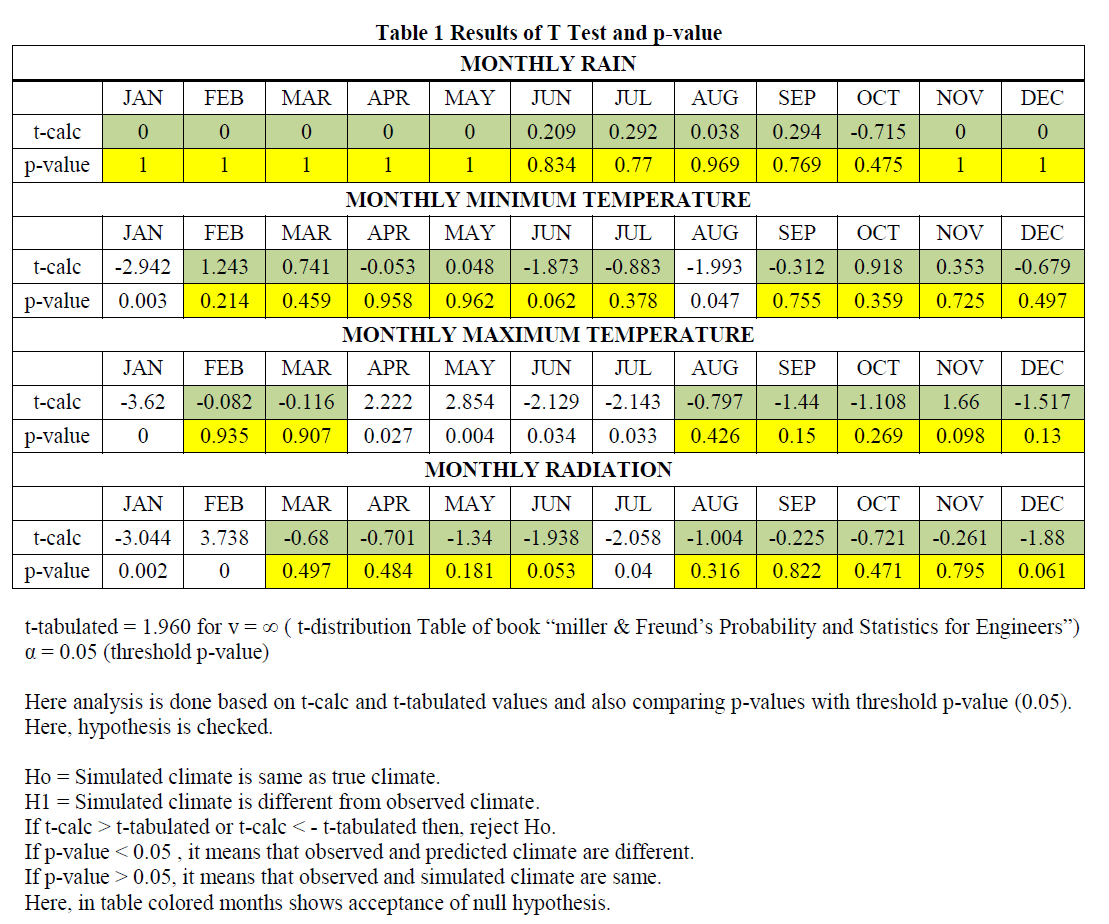
| The statistical characteristics of the observed and synthetic weather data are analyzed to determine if there are any statistically significant differences between observed and simulated data using t-test (a t-test is any statistical hypothesis test in which the test statistic follows a Student’s t distribution, if the null hypothesis is supported). Table 1 shows t test results |
 |
CROP WATER REQUIREMENT |
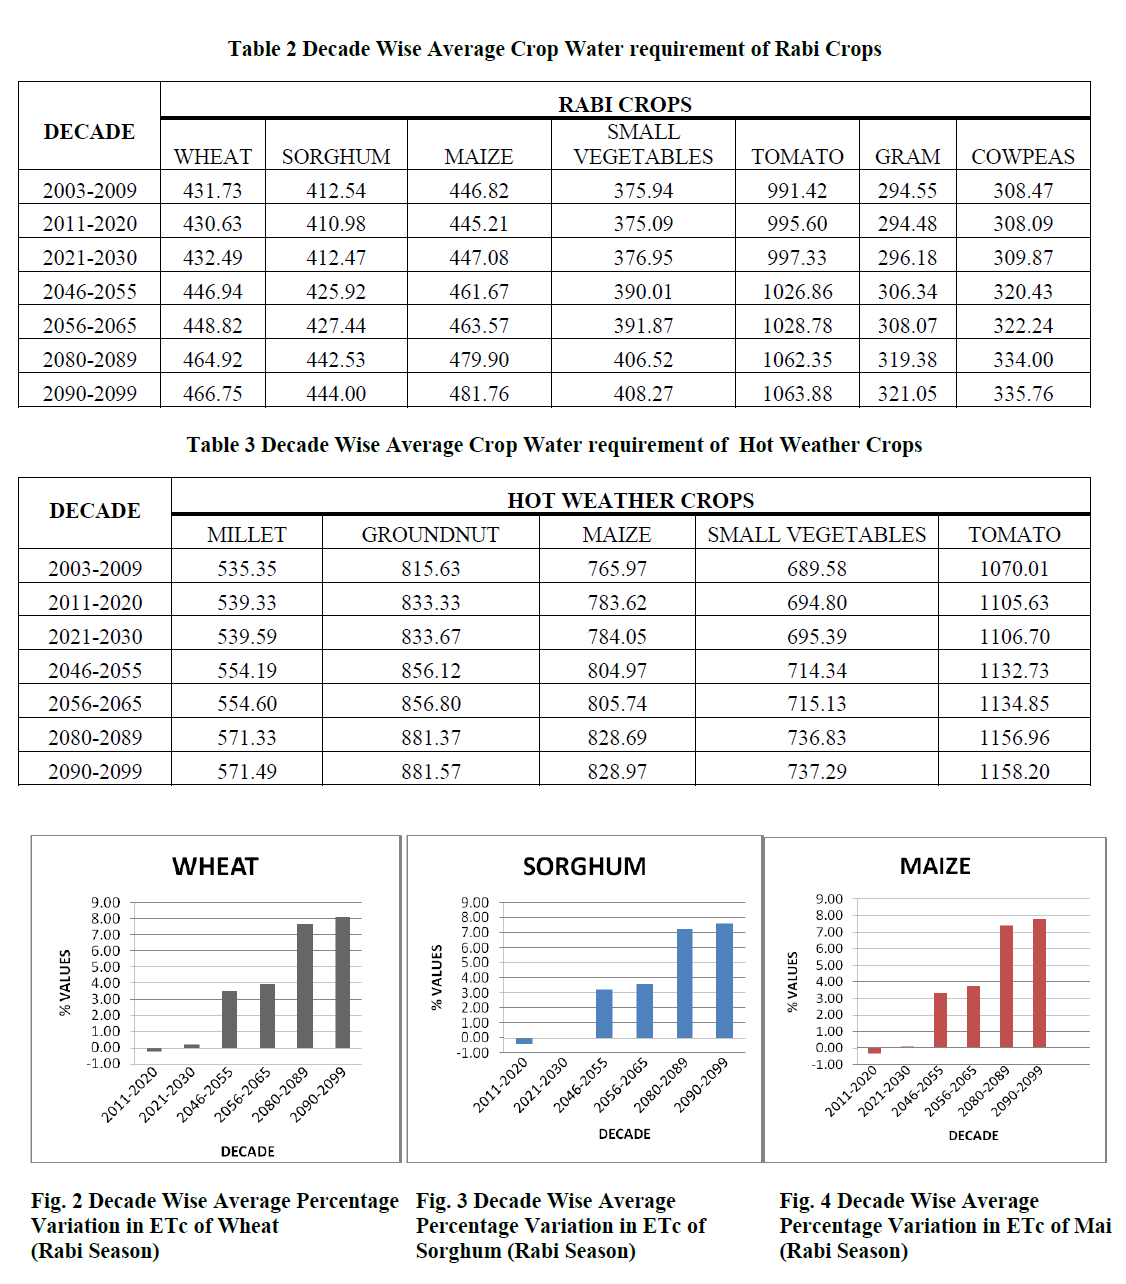
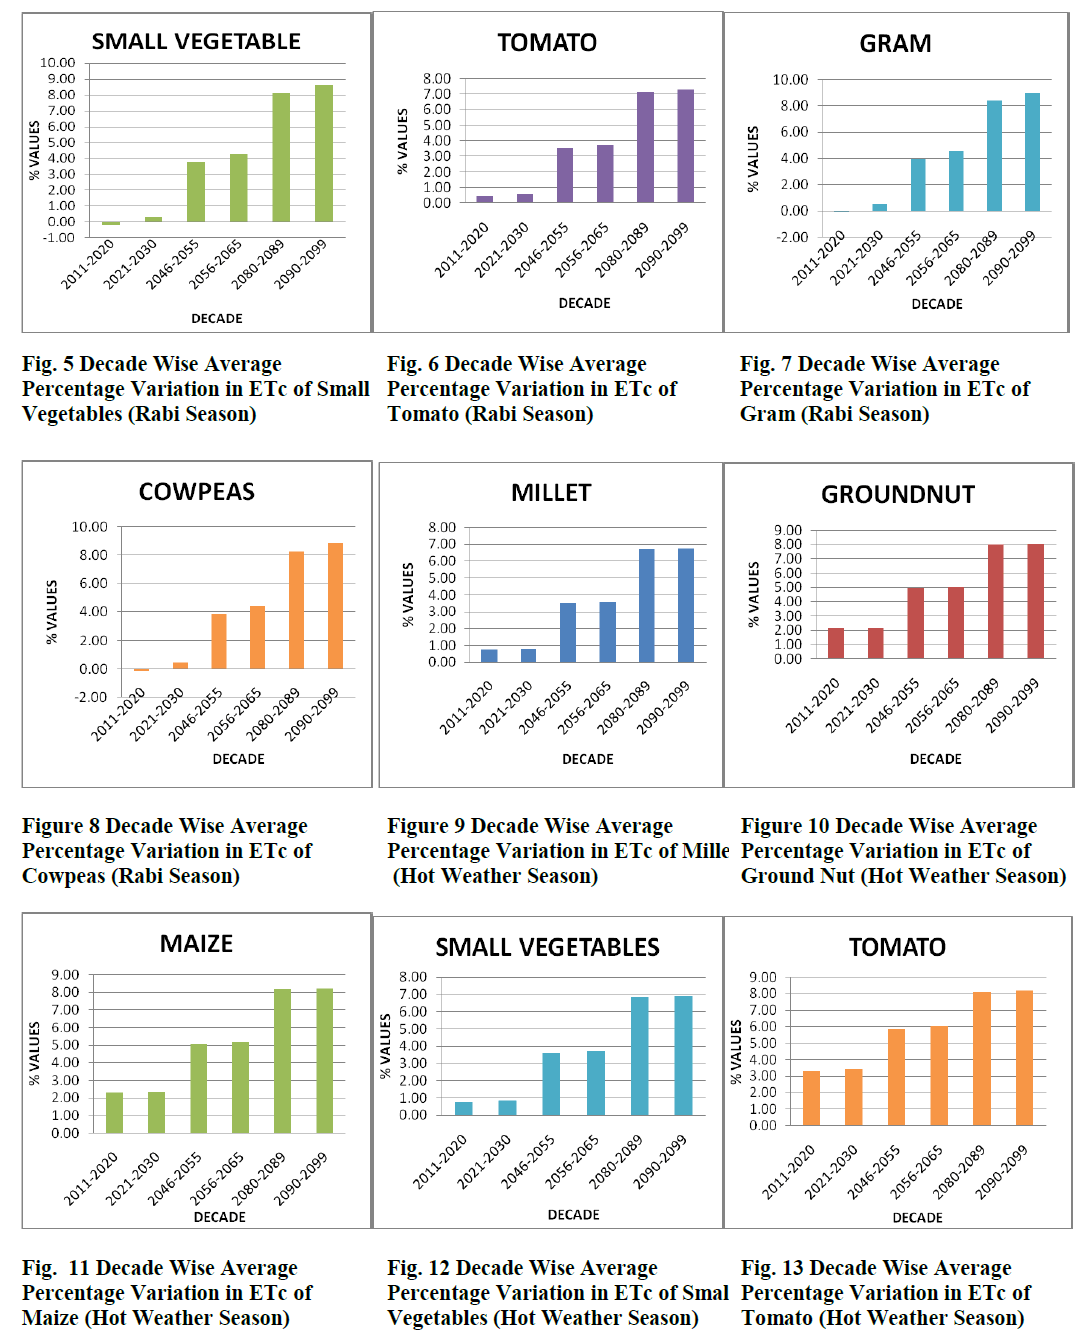
| Table 2 and table 3 shows decade Wise Average Crop Water requirement of rabi Crops and hot weather crops. Figure 2 to 13 shows Decade Wise Average Percentage Variation in ETc of various crops grown in rabi and hot weather season. |
 |
 |
COMPARISON OF WEATHER PARAMETERS |
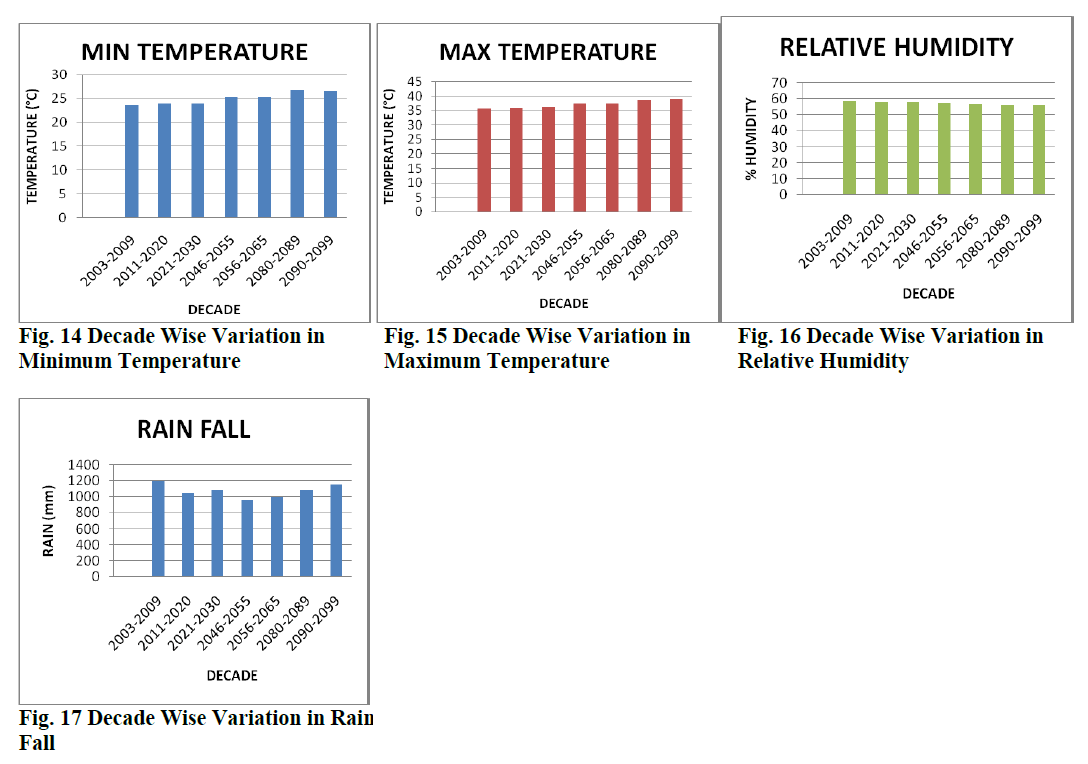
| Various climate parameters like Maximum Temperature, Minimum Temperature, Sunshine Hour, Rain fall and Relative humidity for past and future years are compared. For that year wise average is calculated for each climate parameter and then decade wise average climate parameters are calculated for comparison. Figure 14 to 17 shows the decade wise variation in Minimum Temperature, Maximum Temperature, Relative Humidity and Rain fall. |
 |
CONCLUSION |
| From t-test results we can conclude that for all months the mean of simulated and observed monthly rainfall are same. The mean of simulated and observed monthly minimum temperature are same for all months except January and August. The mean of simulated and observed monthly maximum temperature are same for February, March, August, September, October, November and December. The mean of simulated and observed monthly solar radiation are same for all months except January, February and July. |
| Results and analysis conclude the effect of climate change on crop water requirement of Rabi and Hot Weather crops. There are both rise and fall in crop water requirement has been seen in this study. All Hot Weather crops (Millet, Ground nut, Maize, Small vegetables and Tomato) shows rise in crop water requirement in all future periods (2011- 2030, 2046-2065 and 2080-2099) as compared to base period 2003-2009. In the period 2011-2020, all Rabi crops (Wheat, Sorghum, Maize, Small Vegetables, Tomato, Gram and Cowpeas) shows negligible fall in water requirement, whereas considerable rise in water requirement of all Rabi crops has been seen in other future periods (2021-2030, 2046-2065 and 2080-2090). |
| It has been concluded from the results and analysis that in future years crop water requirement will increase in the study area. The reason for this may be due to increase in Maximum and Minimum temperature and decrease in Relative humidity in future years. Also average rainfall of the study area is showing decreasing trend until end of 2065 and showing increasing trend until end of 2090.The results of this study will be useful for policy makers and planners of water resources for the future planning of projects and suggest water saving techniques to satisfy increasing crop water requirement. |
References |
|