1Benue State University, Makurdi, Nigeria
2University of Jos, Jos, Nigeria
Received date: 13/12/2016 Accepted date: 09/02/2017 Published date: 15/02/2017
Visit for more related articles at Research & Reviews: Journal of Statistics and Mathematical Sciences
Macroeconomic indicators, help to shows the market values of shares transactions in a country, is of paramount concern on the issue relating to the economic development of nations and, thus, an analysis of its immediate causes is inevitable. There is also the view of development economists and policy makers that a well-developed macro economy is crucial for the mobilization of financial resources for long-term investment and thus constitutes one of the major pillars of economic growth. Cluster analysis classifies data into groups such that data in the same group are similar but significantly different from data in other clusters. In finance, these macroeconomic indices reflect the general performance of the Nigeria economy. The economy is the concern of how wealth is made, circulated, and meets its end. It centers on the pattern in which a country creates, disseminate, and consumes the tangible material commodities of life. However, the Gross Domestic Product (GDP) can be influenced by some of these macroeconomic indices. This research work is set out to identify, investigate, and classify the highlighted scenario to with; the relationship between macroeconomic indices in Nigeria and the economic growth. Some of the macroeconomic indices can be sort using Cluster analysis. Cluster Analysis is appropriate when you must classify some observed variables and wish to develop similarity between the numbers of artificial variables (called clusters) that will account for most of the similarities in the observed variables. Two-step clustering technique was adopted for the study. This procedure is an exploratory tool designed to reveal natural groupings (or clusters) within a dataset that would otherwise call for similarity. The Similarity measure of between the clusters formed was determined. Thirteen input variables were used to extract the groups via; (Macroeconomic factors: Gross Domestic Product, Public Finance, Fixed Asset, Private Investment, Net Export, Consumption, Net Savings, External Reserve, Net Import, and Balance of Payment, inflation rate, Forex Rate, and public debt). They Were classified based on the Gross Domestic Product of Nigeria from 1980 – 2010. The Cluster analysis results indicate that macroeconomic indicators tested have the significant influence on the Nigerian economy (Gross Domestic Product). From the ANOVA table, the cluster membership was used as a factor and tested against the Gross Domestic Product shows that it is significant (P = 0.000) which lead to the rejection of the null hypothesis. It is recommendable that the Government of the day should pay more heels to our External Reserves, Fixed Assets, Consumption, Net Savings than any other macroeconomic factors in boosting a reliable Gross Domestic Product.
Macroeconomic indicators, cluster analysis, gross domestic Product, Clusters Comparison
Macroeconomy is the center of investment throughout the world, Nigeria has not been an exempted. One of the head to head issues in economics and business over the years is whether macro economy as in its diverse nature causes economic growth or whether it is a consequence of increased economic activity. Macroeconomic indicators, this explain how the market values of shares transactions in Nigeria, is of utmost concern to the economic growth of developing nations and, thus, an analysis of its possible determinants is discernible. Cluster Analysis as a primary classification method that can be used to classified multivariate data into similar clusters.
Review of Literature
There is a view by development economists and policy makers that well developed macroeconomic indicators are serious for the mobilization of financial resources for long-term investment and thus constitute one of the major pillars of economic growth. The fact is that almost all the macroeconomic indices that come to African landmark are channeled to South Africa, ignoring Nigeria and other African countries with hardly any private inflow. Hondroyiannis reported a bi-directional relationship between macroeconomic indices and economic development. Ewah, appraised the role of macroeconomic indices utility on economic growth in Nigeria and opined that the capital has the potential to induce growth but has not contributed rigorously to the economic growth due to low macroeconomic indices, low absorption capacity inadequate liquidity, misappropriation of funds among others. Okereke, posits that the cheap source of funds from the capital market remain a vital element in maintaining development of the economy. Cluster Analysis is a ubiquitous technique for multivariate data analysis and quality processing [1-5]. This research work discusses Cluster Analysis as a primary classification method, how many components to be in a group and have similarity on the macro economy. The main thrust of this research work is to classify and find similarities between the macroeconomic indices such as Gross Domestic Product, Public Finance, Fixed Asset, Private Investment Export, Consumption, Net Savings, External Reserve, Net Import, and Balance of Payment using Nigerian's data. The data for the research is a secondary data sourced from the internet via; the Central Bank of Nigeria’s Record. Cluster analysis is a powerful multivariate statistical tool that classifies data into groups (Clusters), in many objects, based on their similarities. Like discriminant analysis, each object has multiple characteristics, which can be expressed as a random vector X= (X1, X2, …, Xp) with values that differ from component to component. The prime aim of cluster analysis is to identify similar objects by their similarities. Cluster analysis group same objects into clusters, so that the element within a group are very alike and objects from different groups are significantly different in their characteristics. Cluster Analysis becomes necessary when you must classify some observed variables and wish to develop similarity between the numbers of artificial variables (called clusters) that will account for most of the similarities in the observed variables. In finance, these macroeconomic indices reflect the general performance of the Nigeria economy. The economy is about how wealth emanates, circulated, and consumed. It concentrates on how a country produces, distributes, and consumes the tangible material commodities of life. It is also about how the income from these activities linked between those that contribute towards them. Macroeconomic indicators also known as macroeconomic indices are economic statistics that are released periodically by government agencies and private organization. These signs enhance the economic performance of a country or region, and, therefore, can have a significant effect on the Gross Domestic Product. However, the Gross Domestic Product (GDP) can be influenced by some of these macroeconomic indices. Some of which are Public Finance, Fixed Assets, Private Investment, Forex Rate, Inflation Rate, Public Debt, Interest Rate, Net Export, Consumption, Net Savings, External Reserve, Net import, and Balance of Payment. This research work is set out to identify, investigate, and classify the highlighted scenario to with; the relationship between macroeconomic indices in Nigeria economic performance. Some of the macroeconomic indices can be organize using Cluster Analysis. Indeed, despite the tremendous efforts by various stakeholders aimed at strengthening and deepening the macroeconomic indices, the Nigerian macroeconomic indices still faced with a lot of challenges. Lack of confidence on the part of investors, low level of market capitalization, leadership crisis, lack of clarity and transparency on the part of the regulatory bodies. Consequently, the Nigerian macroeconomic indices are unable to discharge its fundamental role in mobilizing long-term funds for the industrial sector and the economy in general effectively. The broad objective of this study examined the activities and classification of the Nigerian macroeconomic indices. The goals of the study are via; to examines and classify the operations of the Nigerian macroeconomic indices [6-10]. To evaluate the similarities between the macroeconomic indices about the economic growth and development in Nigeria, to make recommendations concerning how the operations of macroeconomic indices could be improved to boost economic growth and development of Nigeria Arising from the preceding. This study sets to provide answers to these questions: What is the classification of the macroeconomic indices about economic growth in Nigeria? There any similarities on the classification of the operations of the Nigerian macroeconomic indices in the Nigerian economy? How could the macroeconomic indices through its crucial role stimulate economic growth and development in Nigeria? In a quest to achieve the above objectives, the following hypotheses are formulated for testing: H01: There is no significant similarity between macroeconomic indices factors and the growth and development of the Nigerian economy. H1: There is a significant similarity between macroeconomic indices and the growth and development of the Nigerian economy..
The Two-Step Cluster Analysis
This procedure is an exploratory tool designed to reveal natural groupings (or clusters) within a dataset that cannot be detected. The method used by this algorithm has many desirable characteristics that make it different from other forms of clustering methods:
1. Dealing with categorical and continuous variables: By assuming variables to be independent, a joint multinomial-normal distribution can be placed on categorical and continuous variables.
2. Automatic selection of some clusters: By comparing the values of a model choice criterion across different clustering solutions, the procedure can automatically determine the optimal number of clusters.
3. Scalability: By constructing a group features (CF) tree that summarizes the records, the Two-Step algorithm allows you to analyze large data files.
Distance and Similarity Determination
Cluster analysis group same objects into the similar cluster, and group unlike objects into different groups. Invariably, one need to define what is "same" and how to quantify similarity before clustering occurs. In the clustering technique, one often uses "distance" to depict how close each two of objects are. There is different distance determination and the most frequently used distance measures in cluster analysis as discussed.
Euclidean distance
The Euclidean distance between any two objects, that is, the distance between object i and object k,
 (1)
(1)
Most references call this Euclidean distance "rule distance".
Standardized Euclidean distance
Clearly, by using the Euclidean distance defined in Equation (1), the distance will be dominated by the few variables with larger numerical scales. If we want each variable to have an equal importance in deciding the distances between objects, then we need to standardize each variable so that each of them has about the same numerical scale. The standardization of each variable can do by subtracting the mean and dividing by the standard deviation, which is like standardizing normally distributed data. Specifically, we will transform each raw data xij into standardized data,
 (2)
(2)

then the standardized Euclidean distance between any two objects I and k is
 (3)
(3)
Standardized Euclidean distance is also called the Pearson distance.
Similarity
The similarity is a measure of similarity between two objects or two clusters. Its maximum value is 1 (or 100%), and its minimum value is 0. The larger the similarity value, the more similar the two objects or clusters are. Higher similarity value indicates smaller distance in objects. Specifically, given two objects and, a similarity measure between and is denoted by which satisfies the following conditions:
• 0 ≤ Srs ≤ 1
• Srs =1 if and only xr = xs
• Srs = Ssr
One commonly used similarity measure is defined as follows:  (4)
(4)
Where dmax is the maximum distance value in the distance matrix D. Another commonly used similarity measure is the Pearson product moment correlation defined as

Clustering criterion
To determine how the automatic clustering algorithm determines the number of clusters the clustering criterion can be used. Either the Bayesian Information Criterion (BIC) or the Akaike Information Criterion (AIC) can be specified.
Data
The method works with both continuous and categorical variables. Cases represent objects to classified, and the variables represent attributes upon which the clustering based.
Case order
Cluster features tree and the final solution may depend about instances. To minimize order effects, randomly order the cases. One may want to obtain several different solutions with cases sorted in different random orders to verify the stability of a given solution. In situations where this is difficult due to enormous file sizes, multiple runs with a sample of cases arranged in various random orders might be substituted.
Assumptions
The likelihood distance measure opined that variables in the cluster model are independent. Moreso, an individual continuous variable is assumed to have a normal (Gaussian) distribution, and each categorical variable is considered to have a multinomial distribution. Empirical internal testing indicates that the procedure is robust to violations of both the assumption of independence and the distributional assumptions, but you should try to be aware of how well these assumptions are satisfied. However, the data used for this project were collected from central bank statistical bulletin from National Bureau of Statistic [11-17].
Analysis of data
The data for this research work were analyzed using the Predictive Analytical Software (PASW) IBM Version 20.
From the Model Summary table above, the two-step algorithm nonhierarchical method was adopted. 13 input variables were used to extract the clusters via; Macroeconomic factors: Gross Domestic Product, Public Finance, Fixed Asset, Private Investment, Net Export, Consumption, Net Savings, External Reserve, Net Import, and Balance of Payment, inflation rate, Forex Rate, and Public Debt. The data were classified based on the Gross Domestic Product of Nigeria from 1980 – 2010. The Cluster Quality served as those set of indicators used to check how consonant or right these clusters are in the classification (Figure 1). The Cluster Sizes shown in a pie- chart from the smallest to the largest (Figure 2). The smallest group is having five members and occupied about 16.1%, the largest cluster had about ten members and held 32.3%, the ratio of sizes of clusters from the Largest clusters to smallest groups is 2.0 which means that no cluster in the cluster set is more than 2times the other clusters. The Cluster table showed the sizes of the groups in percentages. The input variables arranged in Predictor of importance Order via; External Reserves, Fixed Assets, Consumption, Net Savings, Net import, Public Finance, Forex Rate, Public Debt, Private Investment, Balance of Payments, Interest Rate, Inflation Rate, and Net Export. The Evaluation Fields is the Gross Domestic Product (Cluster 1). The Predictor importance graph shows the macroeconomic indicator effects on the Gross Domestic Product from the most important (External Reserve) to the least important (Private Investment) indices (Graph 1).
Cluster Comparisons
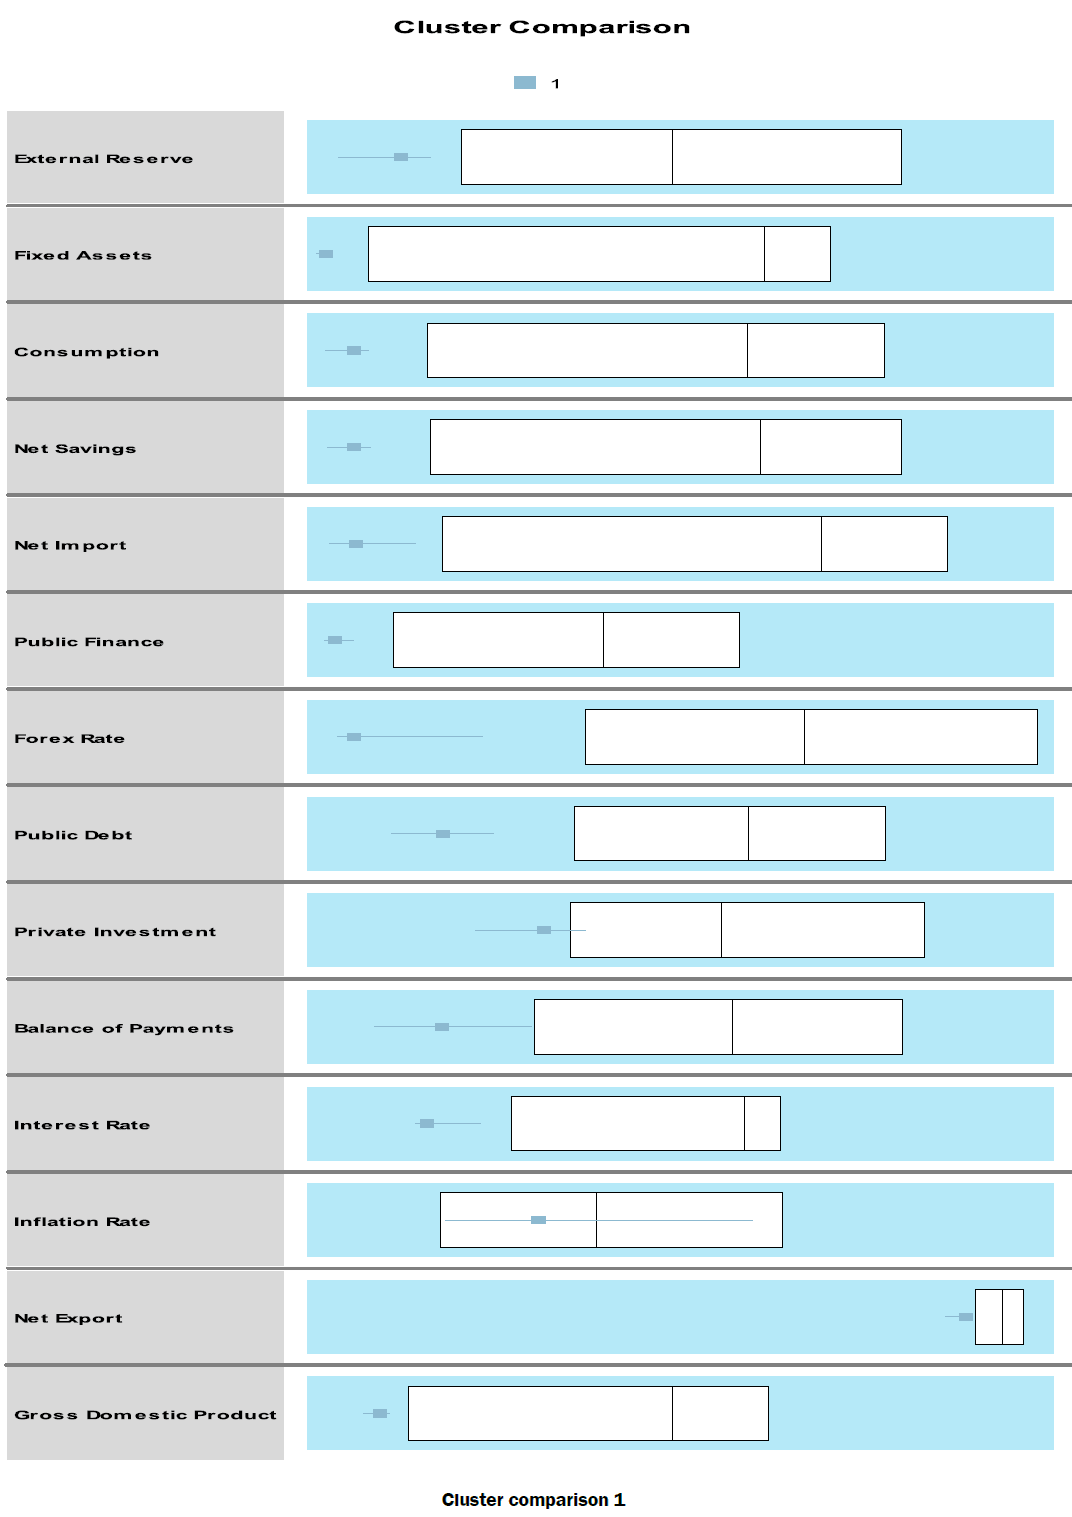
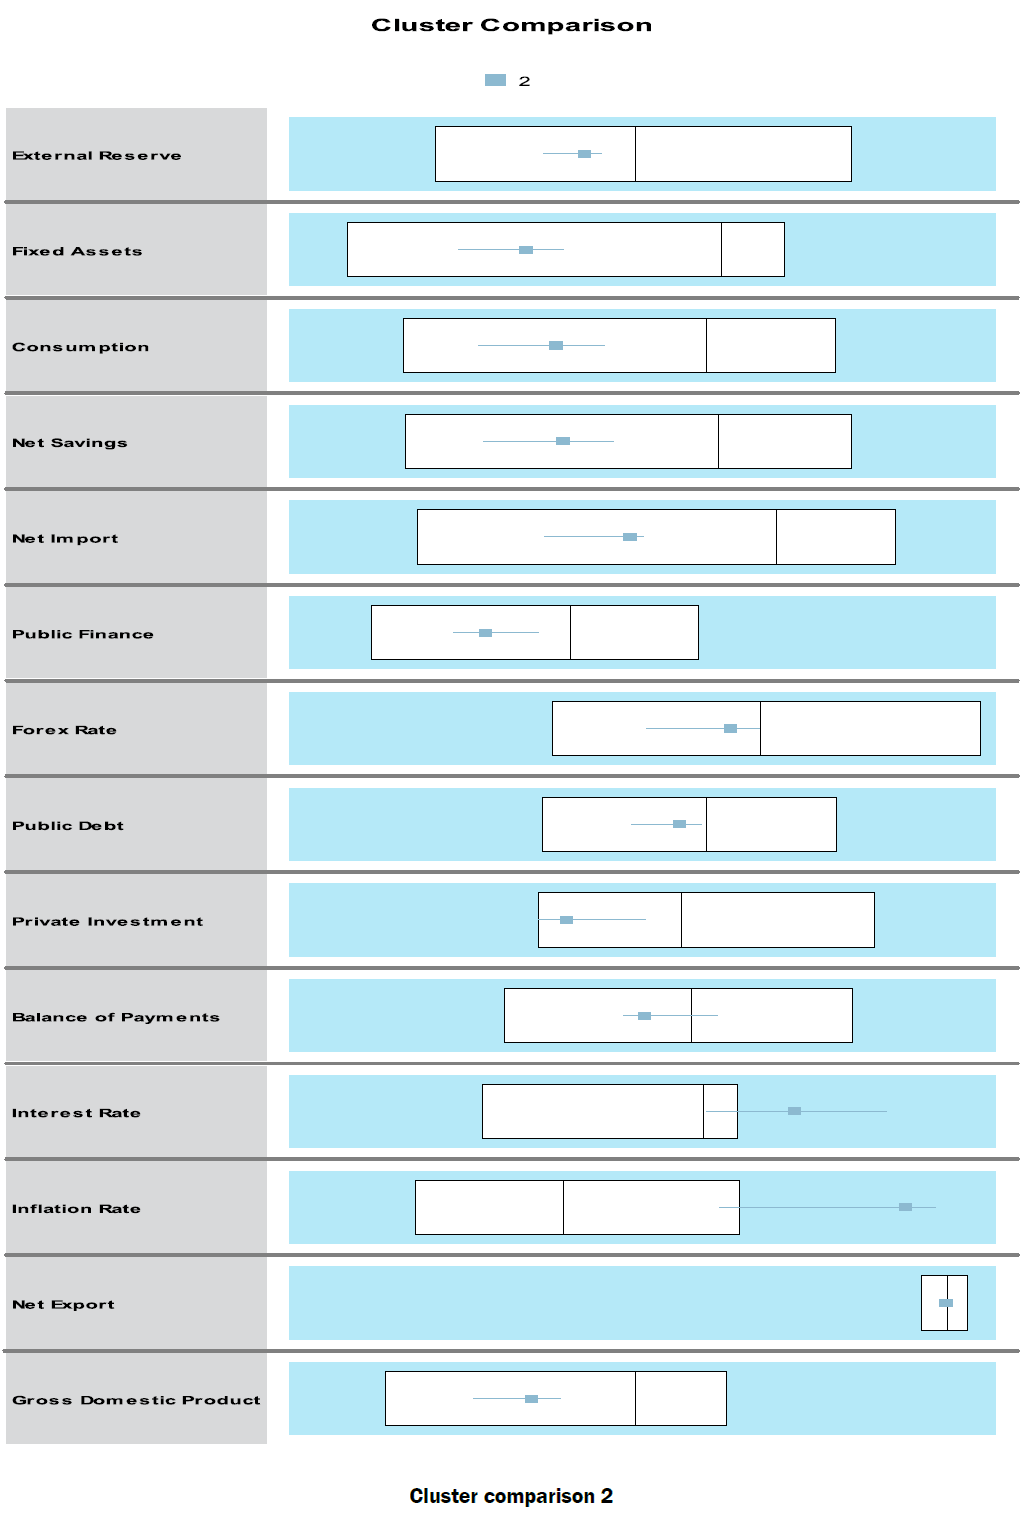
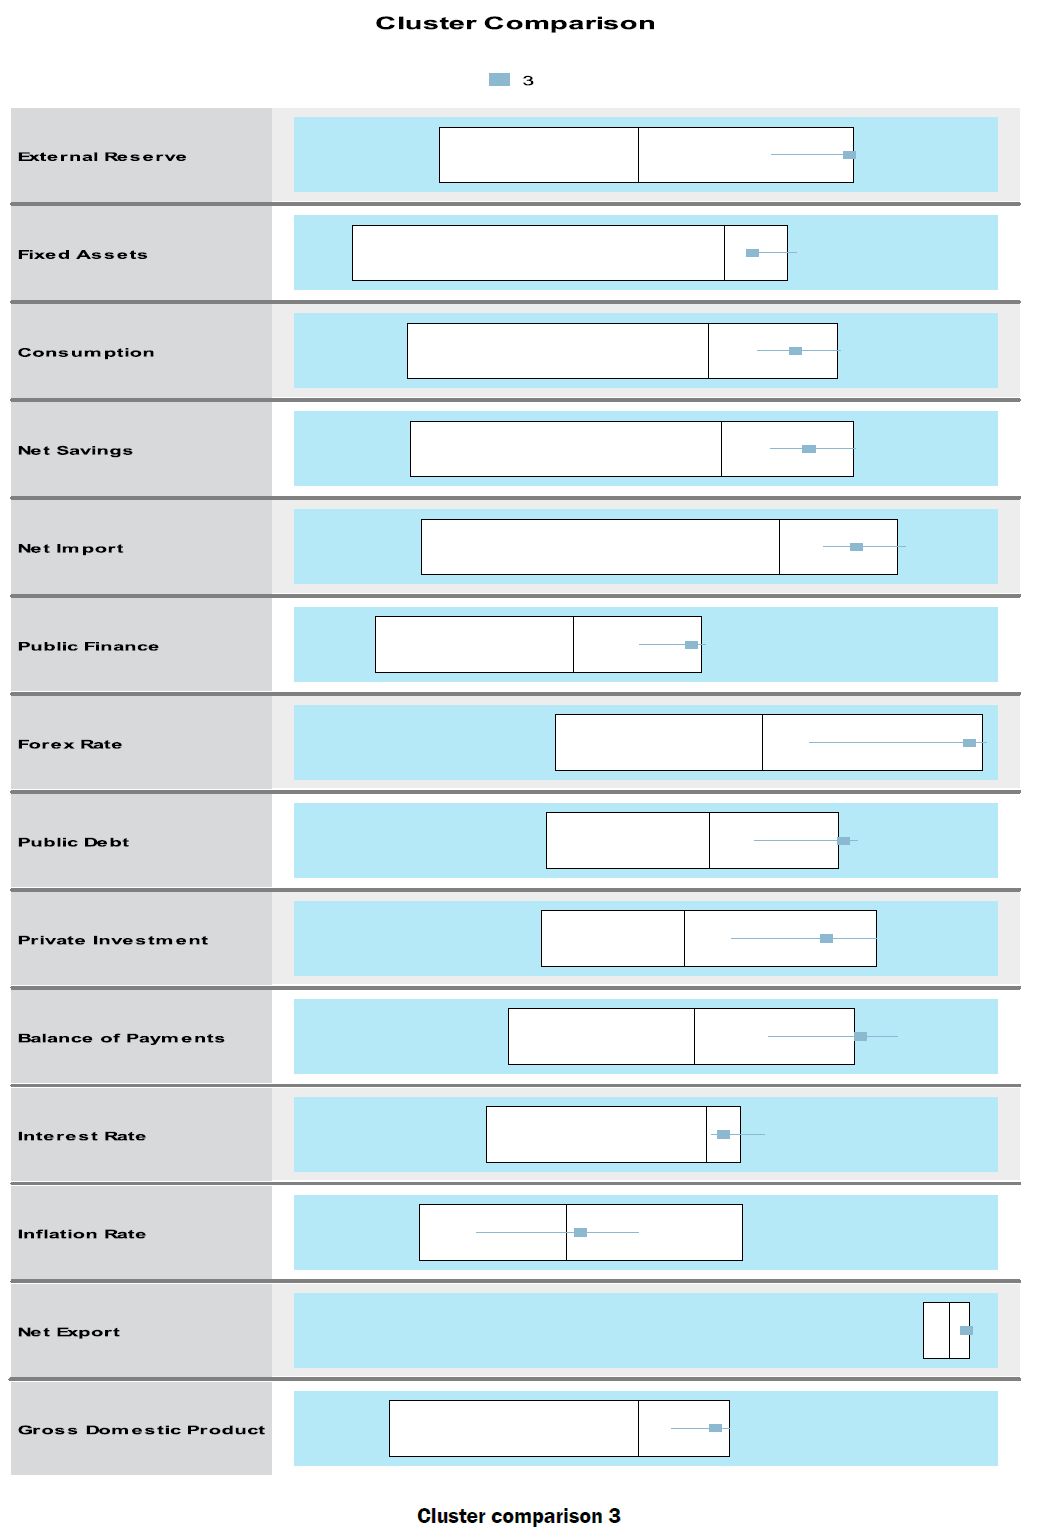
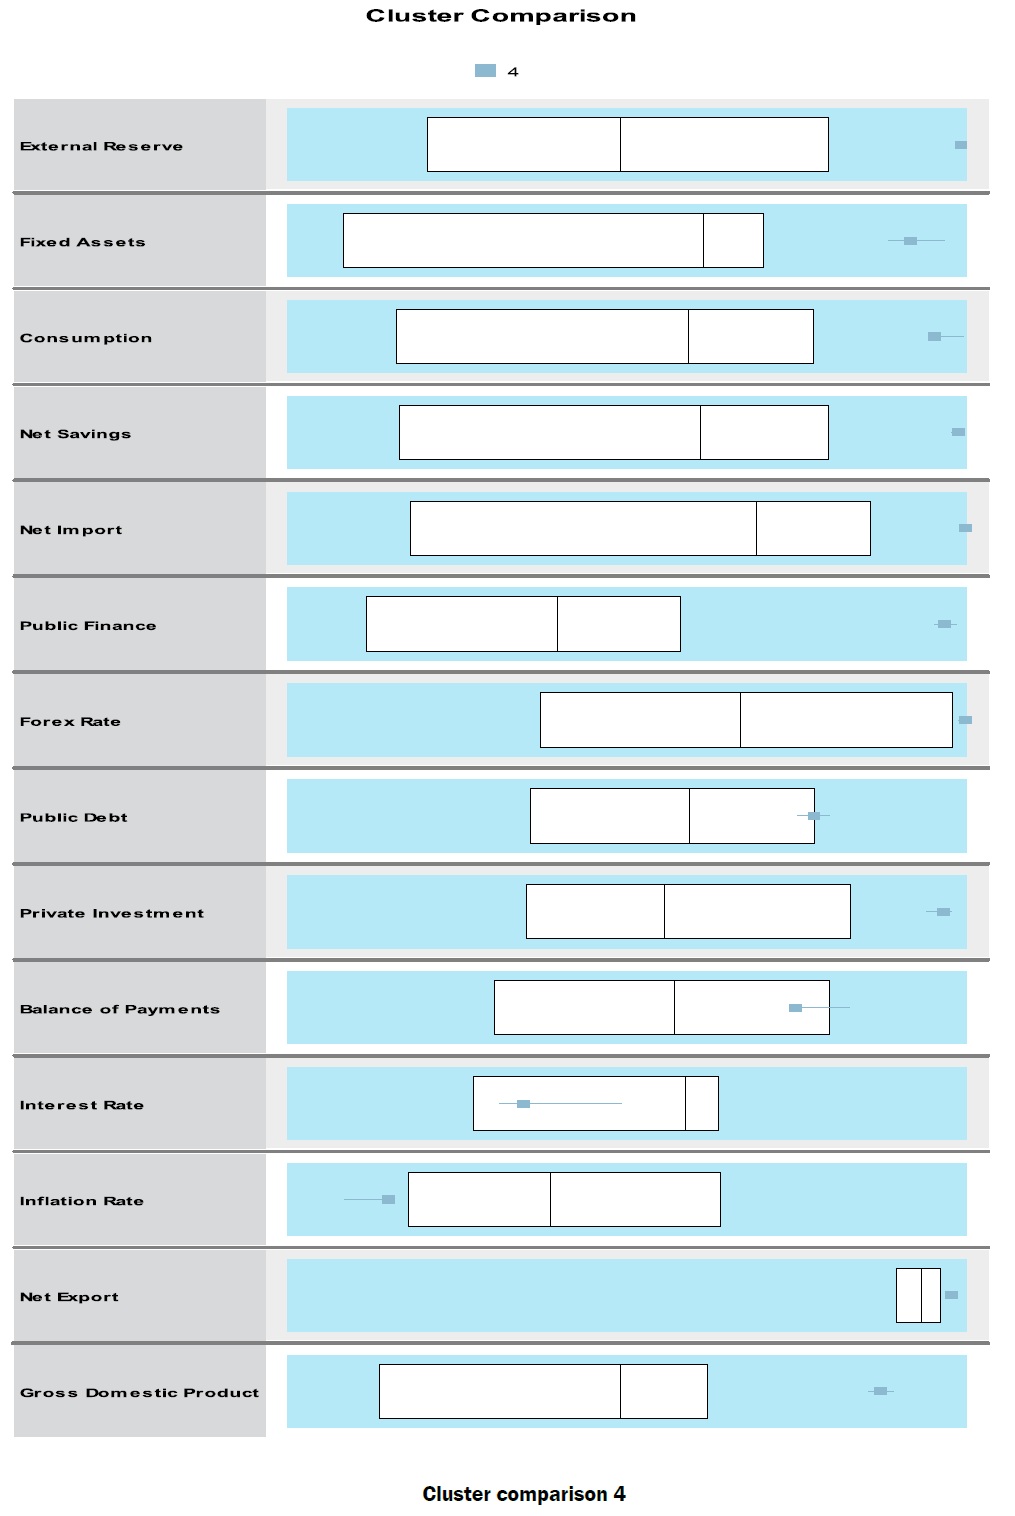
The Cluster Comparison graph is a box plot used in comparing the clusters in the cause of classifications. The line at the middle represents the median while the upper and lower part of the table represent the mean at one standard deviation. In cluster one; it can see that the External Reserve, Fixed Assets, Consumption, Net Savings, Public Finance, Forex Rate, Public Debt, Private Investment, Balance of Payments, Interest Rate are all indigent these have resulted to relatively inflation rate and a poor Gross Domestic Product. In Cluster two; External Reserve, Fixed Assets, Consumption, Net Savings, Public Finance, Forex Rate, Public Debt, Private Investment, and Balance of Payments, are all moderate compared to the first cluster. Interest Rate and Inflation Rate are high though there is an improvement on the Gross Domestic Product compare to the previous Cluster. In Cluster three; External Reserve, Fixed Assets, Consumption, Net Savings, Public Finance, Forex Rate, Public Debt, Private Investment, Balance of Payments, Interest Rate are all very high, and this have resulted in a high Inflation Rate and as well the Gross Domestic Product. In Cluster four the External Reserve, Fixed Assets, Consumption, Net Savings, Public Finance, Forex Rate, Public Debt, Private Investment, Balance of Payments, are all extremely high except for the Interest Rate which is moderate. This in-turn resulted in low Inflation Rate and high Net Export as well as the Gross Domestic Product. From the ANOVA Table above it can also be seen that p-value calculated is less than the p-value tabulated; that is p = 0.000 < 0.005, thus; reject the null hypothesis and conclude that there is a significant similarity between macroeconomic indices and the growth and development of the Nigerian economy (Table 1).
| Gross Domestic Product | |||||
|---|---|---|---|---|---|
| Variables | Sum of Squares | Df | Mean Square | F | Sig. |
| Between Groups | 33.419 | 3 | 11.140 | 88.605 | 0.000 |
| Within Groups | 3.395 | 27 | 0.126 | -- | -- |
| Total | 36.814 | 30 | -- | -- | -- |
Table 1. ANOVA table showing the gross domestic product between different groups.


The Cluster analysis results indicate that macroeconomic indicators via; External Reserves, Fixed Assets, Consumption, Net Savings, Net import, Public Finance, Forex Rate, Public Debt, Private Investment, Balance of Payments, Interest Rate, Inflation Rate, and Net Export have significant effects on the Nigerian economy. This result supported by Poon and Taylor and Tursoy, Gunsel and Rjoub, which found that when macroeconomic indicators classified; there is a significant relationship between the macroeconomic indices and the Gross Domestic Product of a country. However, each cluster may significantly affect different sector in a different manner. That is macroeconomic indices that classified into the same group may significantly affect one area positively, but may significantly influence the other area negatively. It is also worth noting from the ANOVA table that all the cluster membership when used as a factor and tested against the Gross Domestic Product, shows that it is significant (P = 0.000) which lead to the rejection of the null hypothesis. In recommendation; it is advisable that the Government of the day should pay more heels to our External Reserves, Fixed Assets, Consumption, and Net Savings than any other macroeconomic indicators in boosting a reliable Gross Domestic Product especially in the realization of the 2020 vision.