Research & Reviews: Journal of Food and Dairy Technology
ISSN: 2321-6204
ISSN: 2321-6204
Dairy Technology Section, National Dairy Research Institute (Southern Campus), Adugodi, Bangalore – 560 030, Karnataka, India.
Received date: 11/07/2013 Accepted date: 22/09/2013 Revised date: 18/08/2013
Visit for more related articles at Research & Reviews: Journal of Food and Dairy Technology
Colour is an important sensory attribute for acceptance of food products. For maintaining uniform colour and appearance of products, proper methods of colour measurement are essential. Some of the instruments commonly being used are colorimeters, spectrophotometers, comparator charts or colour discs which proved to be useful tools for colour measurement. However, objective colour measurement methods have undergone significant changes in recent years with advancements in computer hardware and software and digitization technology. Flatbed scanners, cameras, various software like Adobe Photoshop are finding increased applications for colour measurement and monitoring. Fundamentals of computer vision and applications in various food products are reviewed here.
Colour measurement, Computer vision, Scanner, Digital camera, Colour models, image analysis
Colour is an important sensory attribute of dairy and food products. In most cases, it is the added colour that appeals to consumers, but many food products also possess natural characteristic colour. Colour is also an important attribute in food industry, for example in flavoured drinks and frozen products, manufacturers follow an unspecified code for colours that match with certain flavours. Chocolates are always identified with light and dark shades of brown colour. Nuts and fruits have their own typical colours. In many food products, colour develops because of innate chemical reactions. An attractive glossy appearance may mask shortcomings in flavor or other attributes, whereas a dull and bad appearance may not support excellent flavor or other sensory attributes. It has been reported that colour has a boosting effect on the flavor of foods. The overall appearance of any object is a combination of its chromatic and geometric attributes. Both of these attributes should be accounted for when making visual or instrumental assessment of appearance. The colour is the first sensation that the consumer perceives and uses as a tool to accept or reject the product, because the colour observation allows the detection of certain anomalies or defects of a product [1]. Therefore, colour measurement is an important tool in the hands of food technologists for determining and monitoring quality of the food product. It could also act as a means of certain processing conditions. Colour measurement can be used to follow the advanced Maillard reactions in milk [2]. For food technologists, it is important to evaluate various food items in terms of colour and differentiate them in quantifiable terms. Colour in many cases also provides important clues to the innate reactions that are taking place in food items, especially processed foods. The other industries concerned with colour measurement include paints, photography, textiles, ceramics and plastics. In view of the importance of colour attribute, colour measurement methods also gain importance for monitoring the colour variations in food products. This is especially required in the studies where colour changes have to be quantified to know the treatment effects. In food related research projects, colour measurement is of special significance because often we need to quantify the colour changes, which will bear significant correlations with process parameters or sensory parameters.
As the colour varies with the amount or intensity of mixture of primary colours which form innumerable colour shades, colour measurement is somewhat complex. With increasing need of reliable colour measurement or colour quantification methods, it has remained the focus of several research works throughout the world. In 1931, the Commission International de l'Eclairage (International Commission on Illumination, CIE) was established. The CIE is the international authority on light, illumination, colour, and colour spaces. It recommended colour measurement in terms of L, a and b values. The CIE system of colour measurement forms the basis of any colour measurement system. The XYZ is the first colour space that is mathematically defined by the Commission Internationale d'Eclairage (CIE) in 1931. The L*a*b* colour space is perceptually uniform and the most complete model defined by the CIE in 1976 to serve as a device-independent, absolute model to be used as a reference. It is based on the XYZ colour space as an attempt to linearize the perceptibility of colour differences, using the colour difference matrix described by the Macadam ellipse. The non-linear relations for L*, a* and b* are intended to mimic the logarithmic response of the human eye. Here, L* is the luminance or lightness component, which ranges from 0 to 100, and parameters a* (from green to red) and b* (from blue to yellow) are the two chromatic components, which range from –120 to 120 [3, 4]. Before the advancements in computer field, this was a difficult task, but with leaps and bounds of computer advancements, suddenly there seems to be abundant ways of determining surface colour properties. And innovations in this direction seem to be endless, the beneficiaries being the entire humankind.
Image processing and image analysis are recognized as being the core of computer vision. Image processing involves a series of image operations that enhance the quality of an image [5]. Recently, automatic inspection systems, mainly based on camera - computer technology have been investigated for the sensory analysis of agricultural and food products. This system known as computer vision has proven to be successful for objective measurement of various agricultural and food products. Computer vision includes the capturing, processing and analyzing images, facilitating the objective and nondestructive assessment of visual quality characteristics in food products [6]. The potential of computer vision in the food industry has long been recognized and the food industry is now ranked among the top 10 industries using this technology [7]. Recent advances in hardware and software have aided in this expansion by providing low cost powerful solutions, leading to more studies on the development of computer vision systems in the food industry [8, 9].
Fundamentals Of Computer Vision
Computers are one of the greatest inventions of our times. Today there is no field in which computers do not find application. Coupled with world wide web, computers have forever changed the way of our living. In industries where colour is of significance, it has revolutionized the design and colour shades, especially in textiles, paints, photography and printing offering the customers a plethora of options to choose from. Amazing speeds and great accuracy without fatigue levels at which data is processed by silicone chip circuitry in computers has led to applications which are revolutionary in almost all fields where humans are involved. And colour measurement field is no exception. Softwares like Adobe Photoshop have been developed where mindboggling combinations could be created and quantified and used for specific applications. All this was possible because of sensing of primary colours by diodes.
Advancements in digital technology enabled use of scanner, camera and softwares for colour measurement purposes [10]. Following its origin in the 1960s, computer vision has experienced growth with its applications expanding in diverse fields not only for colour measurements but also for process automations, medical diagnostic imaging, factory automation, remote sensing, forensics, robot guidance etc. [7].
Computer vision and image analysis, are non-destructive and cost-effective techniques for sorting and grading of agricultural and food products during handling processes and commercial purposes [11].
Image acquisition
For colour measurement purpose, firstly, image of the sample has to be acquired. This is a very important step because a poorly acquired image cannot provide useful results even with best image processing infrastructure. Images can be acquired by scanners and cameras etc. Appropriate lighting and high-quality optics and electronic circuitry are critical in acquiring high quality images [7].
Scanners
In computing, an image scanner is a device that optically scans images (printed text, handwriting or an object) and converts it to a digital image which is then transferred to a computer. The scanner head (includes mirrors, lens, filter and Charge Coupled Device (CCD array) move over the document line by line by belt attached to steeper motor. Each line is broken down into "basic dots" which correspond to pixels. A captor analyses the colour of each pixel. The colour of each pixel is broken down into 3 components (red, green, blue). Each colour component is measured and represented by a value. For 8-bit quantification, each component will have a value between 0 and 255 (28-1=255). The high-intensity light emitted is reflected by the document and converges towards a series of captors via a system of lenses and mirrors. The captors convert the light intensities received into electrical signals, which are in turn converted into digital data by an analogue-digital converter.
Scanners typically read red-green-blue colour (RGB) data from the array. This data is then processed with some proprietary algorithm to correct for different exposure conditions, and sent to the computer via the device's input/output interface. Colour depth varies depending on the scanning array characteristics, but is usually at least 24 bits. The other qualifying parameter for a scanner is its resolution, measured in pixels per inch (ppi), sometimes more accurately referred to as samples per inch (spi) [12].
The scanned result is a non-compressed RGB image, which can be transferred to a computer's memory. Once on the computer, the image can be processed with a raster graphics program (such as Photoshop or the GIMP) and saved on a storage device (such as a hard disk). During digital image processing each pixel can be represented in the computer memory or interface hardware (for example, a graphics card) as binary values for the red, green and blue colour components. When properly managed, these values are converted into intensities or voltages via gamma correction to correct the inherent non-linearity of some devices, such that the intended intensities are reproduced on the display [12].
Digital cameras
Digital cameras have a built-in computer, and all of them record images electronically. Firstly, light bouncing off an object passes into the camera, through a set of lenses, and onto a mirror. From there, the light bounces up and into a pentaprism (five sided prism). Once light enters the pentaprism, it bounces around in a complicated way until it passes through the eyepiece and enters our eye. Just like a conventional camera, it has a series of lenses that focus light to create an image of an object. But instead of focusing this light onto a piece of film, it focuses it onto a semiconductor device that records light electronically. A computer then breaks this electronic information down into digital data [13].
The underlying technology of the digital camera is a light sensor and a programme. The light sensor is most often a Charge Coupled Device (CCD) and the programme is firmware that is embedded right into the circuit board of the camera. The CCD is like a grid of millions of little squares, each one kind of like a solar cell. Each of those little squares on the CCD takes light energy and converts it to electrical energy. Each condition of the light – like brightness and intensity – generates a very specific electrical charge. Those charges for each little square are then transported through an array of electronics to where it can be interpreted by the firmware. The firmware knows what each specific charge means and translates it to information that includes the colour and other qualities of the light that the CCD picked up. This process is done for each of the squares in the grid of the CCD. The next step is for the firmware to record the information it saw into digital code. That code can be used to accurately reproduce the picture time and again. Now, that code can be passed to the view screen on the camera, or to a monitor or printer for reproduction [14].
Essentially, a digital image is just a long string of 1s and 0s that represent all the tiny coloured dots - or pixels - that collectively make up the image. A digital camera with a minimum resolution of 1600 × 1200 pixels is recommended, which is equivalent to a 2.1 megapixel or higher camera. The camera should also have macro and zoom feature. A memory card of at least 32 Mb and a digital film reader are also useful for storing the image files and transferring them to the computer [4].
Flatbed scanning is fast, easy to use, cheap, robust, independent of external light conditions, and with good accuracy [15]. It was concluded that desktop flatbed scanner is a promising analytical instrument suitable for measurements of the colorimetric parameters of coloured substances adsorbed on polyurethane foam and for the automated estimation of analysis results [16]. As with the human eye, vision systems are affected by the level and quality of illumination. Therefore, the performance of the illumination system can greatly influence the quality of image and plays an important role in the overall efficiency and accuracy of the system.
Image analysis and processing
After acquiring image, the process of converting pictorial images into numerical form is called digitisation. In this process, an image is divided into a two dimensional grid of small regions containing picture elements defined as pixels by using a vision processor board called a digitiser or frame grabber. Selection of the frame grabber is based on the camera or scanner output, spatial and grey level resolutions required, and the processing capability of the processor board itself.
Many a standard software can be employed to analyze a displayed image file created after digital scanning or photography both for colour parameters and for the reflectance or luminosity [6, 17]. In 2004, Shishkin et al. [16] studied colorimetric parameters of coloured substances adsorbed on polyurethane foam using a desktop scanner and image-processing software. The method was based on scanning coloured samples of polyurethane foam using a desktop scanner, processing the colour images using Adobe Photoshop as a graphics editor, and building calibration plots of the luminosity of the selected channel (R, G, or B) as a function of the concentration of the test compound using the Origin software. They prepared and scanned different, coloured chemical solutions. The separation of colours of images and the determination of the luminosity of R, G, and B channels were made using Adobe (R) Photoshop 8.0 software. The calibration plots are described by a first-order exponential decay function. It has been found that substances adsorbed on polyurethane foam can be determined with the use of a scanner and the corresponding image-processing software with the same sensitivity as with the use of diffuse-reflectance spectroscopy [9].
Advances in digital photography, desktop scanners, and software for processing colour images provide a rapid, unbiased, and automated method for estimating the colorimetric parameters of coloured samples. With the developments in hardware and software for image analysis/processing, the applications of computer vision have been extended to the quality evaluation of diverse and processed foods, which has illustrated great advantages of using the technology for objective, rapid, non-contact and automated quality inspection and control. With these developments, computer vision is expected to replace human vision for the purpose of providing quantitative information and automating certain processes according to their visual appearance including colour. In recent years, computer vision has been attracting much R&D attention from the agri-food industry, and rapid development has been increasingly taking place on quality inspection, classification and evaluation of a wide range of agri-food products.
Colour models
Three colour models can be used to define colour; those are RGB (red, green, and blue) model, the CMYK (cyan, magenta, yellow and black) model, and the L*a*b* model. While these colour models are useful, their limitations should also be understood. For example, the spectrum of colours seen by the human eye is wider than the gamut (the range of colours that a colour system can display or print) available in any colour model [18].
RGB model
RGB model is an additive colour model that uses transmitted light to display colours in which red, green, and blue light are added together in various ways to reproduce a broad array of colours. The name of the model comes from the initials of the three additive primary colours, red (R), green (G) and blue (B). Various proportions and intensities of these three primary colours are used to create cyan, magenta, yellow, black and white. The model relates closely to the way human eye perceives colour on the retina. The model is device dependent, since its range of colours varies with the display device [19].
To form a colour with RGB, three coloured light beams (one red, one green and one blue) must be superimposed. Zero intensity for each component gives the darkest colour (no light, considered the black), and full intensity of each gives a white; the quality of this white depends on the nature of the primary light sources, but if they are properly balanced, the result is a neutral white matching the system's white point. When the intensities for all the components are the same, the result is a shade of gray, darker or lighter depending on the intensity. When the intensities are different, the result is a colourized hue, more or less saturated depending on the difference of the strongest and weakest of the intensities of the primary colours employed.
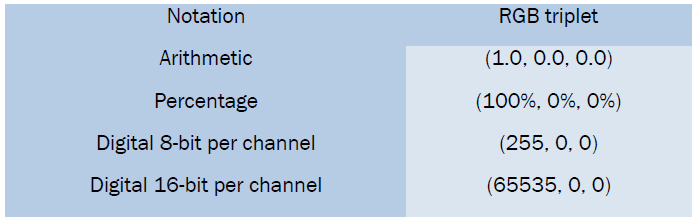
When one of the components has the strongest intensity, the colour is a hue near this primary colour (reddish, greenish, or bluish), and when two components have the same strongest intensity, then the colour is a hue of a secondary colour (a shade of cyan, magenta or yellow). A secondary colour is formed by the sum of two primary colours of equal intensity: cyan is green+blue, magenta is red+blue, and yellow is red+green. The colour is expressed as an RGB triplet (r, g, b), each component of which can vary from zero to a defined maximum value. The following table shows notations of RGB triplet [20].
CMYK model
CMYK refers to the four inks used in most colour printing: cyan (C), magenta (M), yellow (Y), and key black (K). The “K” in CMYK stands for key since in four-colour printing cyan, magenta, and yellow printing plates are carefully keyed or aligned with the key of the black key plate [21] (Some sources suggest that the “K” in CMYK comes from the last letter in "black" and was chosen to avoid confusion with blue [22]. Such a model is called subtractive because inks “subtract” brightness from white.
In additive colour models such as RGB, white is the “additive” combination of all primary coloured lights, while black is the absence of light. In the CMYK model, it is just the opposite: white is the natural colour of the paper or other background, while black results from a full combination of coloured inks. To save money on ink, and to produce deeper black tones, unsaturated and dark colours are produced by using black ink instead of the combination of cyan, magenta and yellow. Since RGB and CMYK spaces are both device-dependent spaces, there is no simple or general conversion formula that converts between them [22].
Lab model
The L*a*b* model is an international standard for colour measurement developed by the CIE in 1976. The L*a*b* colour consists of a luminance or lightness component (L*) along with two chromatic components: a* component (from green to red) and b* component (from blue to yellow). The L*a*b* colour is device independent, providing consistent colour regardless of the input or output device such as digital camera, scanner, monitor and printer [23]. Among the three models, the L*a*b* model has the largest gamut encompassing all colours in the RGB and CMYK gamuts [22]. The L*a*b* values are often used in food research studies.
The coordinates of the Hunter L, a, b colour space are L, a and b [24]. However, Lab is now more often used as an informal abbreviation for the CIE 1976 (L*, a*, b*) colour space (also called CIELAB, whose coordinates are actually L*, a* and b*). Thus, the initials Lab by themselves are somewhat ambiguous. The colour spaces are related in purpose, but differ in implementation.
Unlike the RGB and CMYK colour models, Lab colour is designed to approximate human vision. It aspires to perceptual uniformity, and its L component closely matches human perception of lightness. It can thus be used to make accurate colour balance corrections by modifying output curves in the a and b components, or to adjust the lightness contrast using the L component.
Computer vision methods have wide applications in food industry. Studies have been carried out to analyze visual characteristics of products like dairy, bakery, meat [25, 26], fruits and vegetables [27, 28, 29]. Image analysis techniques using computer vision systems have been increasingly adopted for variety classification and quality evaluation of food materials and products such as fruit, cheese and pizza etc. Researchers also used computer vision methods to analyse the colour of pork, beer and potato. Some of its applications are described below.
Bakery products
For bakery products, the superficial appearance and colour are the first parameters of quality evaluation by consumers. Abdullah et al. [30] developed an automated system for visual inspection of muffins. Using the system, muffins could be evaluated for colour by visual examination. The system consisted of a machine-reading mechanism coupled with discriminant analysis of the acquired data. It was possible to separate light coloured muffins from dark ones with about 96% accuracy compared with visual inspection. By computer vision system, physical features such as size, shape, bake dough colour and fraction of top surface area of chocolate chip cookies were also estimated by digital images [31]. Bread crust thickness can also be measured by colour difference between bread crust and crumb. The crust thickness has a negative relationship with each of the L, a, and b values and a positive correlation with the total colour difference of bread crust. Using this technique, the effect of baking temperature on crust thickness was studied [32].
Flatbed scanner was used for measuring crumb porosity by crumb brightness. Effect of kefir concentration on the quality of porous white bread was made by Esteller et al. [15].
Meat products
Quality attributes such as muscle colour, marbling, maturity and muscle texture are very important in consumer acceptance of meat. Hence, computer vision is a promising technology for objective meat quality grading. So, the technique has been recognized as the most promising approach to objective assessment of meat quality from fresh-meat characteristics [26]. O'Sullivan et al. [33] compared the instrumental colour measurements of a Minolta colorimeter and a digital camera to measure colour parameters. Instrumental Hunter L*, a* and b* values were measured on each day of analysis. In addition RGB (red, green and blue) and Hunter L*, a* and b* values were measured using a digital camera. The parameters measured by digital camera were found to be more useful in predicting the meat quality. This was due to the fact that the camera took measurements over the entire surface of samples and thus a more representative measurement was taken compared to colorimeter [34]. Computer vision was also used for assessment of fresh pork colour [25. 26, 34]. Computer vision has also been used to grade salmons replacing human labour [35]. Quevedo et al. [36] used computer vision system to adjudge quality of salmons based on colour score derived from RGB values of image taken by camera and L*a*b* colour space. In the fish industry, despite the slow uptake, computer vision is beginning to gain the necessary maturity for quality evaluation applications [37, 38].
Fruits and vegetables
It is well recognised that appearance of fruits and vegetables is the most important consumer attribute. In apples, consumers prefer a glossy, brightly coloured ones. Schrevens and Raeymaeckers [39] have done image analysis of surface colour of apples using digital image processing for comparing colour characteristics of apples, which also helped in colour ranking. It can also find versatile applications such as microwave sterilisation process. It is known that during microwave heating, the heat intensity may not be uniform in the products and there are chances of „cold spotsâÃâ¬ÃŸ which is one of the disadvantages of microwave heating. Computer vision can effectively track such cold spots helping to develop sterilisation process for industrial applications, for example mashed potatoes [40]. While comparing performance of pre-cooling methods for storage of mango, Ravindra and Goswami [41] did the image analysis of changes in surface colour of peel and pulp. Peel colour can indicate degree of ripening of fruit. Flatbed scanner coupled with Adobe Photoshop was used.
Dairy products
In several dairy products, Maillard browning and caramelisation play an important role in their colour and appearance [42, 43]. In heat desiccated milk products like kunda and kalakand these chemical reactions to varying extents are responsible for the typical brown colour. In both the products, the brown colour is a result of continuous heating of milk or high moisture khoa mixed with calculated amount of sugar. The products have rich characteristic milk fat taste with a nutty and caramelized cooked flavour. Kunda is prepared purely from milk and khoa, which is already a heat desiccated product. A correct quantity of khoa and sugar has to be mixed in milk before boiling it. Once the mixture starts boiling, it has to be continuously stirred until it takes a solid form. The process of heat desiccation is continued till typical brown colour and nutty flavor is developed in the product [44, 45]. Kalakand has granular texture in which presence of big grains with slightly brown colouration are desirable characteristics [46]. It is prepared by heating mixture of khoa and sugar with continuous stirring until characteristic grainy texture and caramelized flavor develops [47]. When prepared directly from milk, a small amount of citric acid is added to obtain grainy texture in the final product. Maillard reactions and caramelisation of sugar take place during heat desiccation though to a lesser extent than in kunda. Hence, the colour of kalakand is lighter than that of kunda. Vyawahare and Rao [48] and Vyawahare et al. [49] reported colour measurement of kunda and kalakand by using flatbed scanner and Adobe Photoshop.
It was reported that computer vision was used routinely in the quality assessment of yoghurt, cheese, and pizza [8, 9, 50, 51] and it was easy to analyse functional properties of Cheddar and Mozzarella cheeses with machine vision during cooking [52]. A browning factor (BF) was used to describe a reasonable index for cheese browning. Images were captured for each cheese slice before cooking and at periodic time intervals during cooking. It was found that, cooking for 2-4 min, the BF of Mozzarella cheese increased almost linearly with baking temperature. As for the Cheddar cheese, after heating for 8-12 min, a linear relationship between the BF and baking temperature was observed from 70 to 130°C. When heating at temperatures above 160°C, the colour of Cheddar cheese darkened dramatically due to scorching. The results also show that compared with conventional methods using colorimeters, the computer vision method is efficient and provides more information on the colour change of cheese by making continuous measurement possible. It also has the advantage of handling surfaces with uneven colour distributions such as cooked Mozzarella cheese. Additionally, the computer vision system could be multi-functional to evaluate cheese browning and melting. This could be applicable to other cheese varieties also [52].
In cheese industry, syneresis also influences protein and fat losses in whey, which in turn affects cheese yield. At present, in the cheese industry worldwide, syneresis is empirically controlled, and there are no technologies available for online monitoring of curd syneresis to assist the cheese maker. Various empirical techniques have been developed to study the kinetics of syneresis. Everard et al., [53] used the computer vision and a colorimeter for monitoring curd syneresis in a double-O cheese vat. A computer vision system was coupled to a cheese vat, to measure colour changes in the curd/whey mixture during syneresis. Decreased white/yellow area ratio and increased RGB metric and Lab metric were caused by 3 factors: (a) the shrinkage of curd particles during syneresis, (b) the expulsion of whey from the curd during syneresis, and (c) the sinking of curd particles to the bottom of the vat during constant stirring. All 3 factors were intrinsic to curd syneresis. The results showed that computer vision and colorimeter measurements have potential for monitoring syneresis. One limitation of this study was that optical measurements were taken at the surface, and it was found that low stirring speeds were not effective in re-suspending sinking curd and this confounded the prediction of curd moisture. This suggests that the use of submerged optical probes, installed on the vat wall, may be worthy of investigation for this application.
With the objective to determine colour changes during storage of set-type whole-fat and low-fat yoghurts using a machine vision system (MVS) during storage, image processing of yoghurt was digitized with digital colour video camera, computer, and corresponding software and the obtained data were modeled with an artificial neural network (ANN) for prediction of shelf life. The input variables of the network were pH; total aerobic, yeast, mold, and coliform counts; and colour analysis values measured by the machine vision system. The output variable was the storage time of the yoghurt. The modeling results showed that there was excellent agreement between the experimental data and predicted values, with a high determination coefficient (R2 = 0.9996) showing that the developed model was able to analyze non-linear multivariant data with very good performance, fewer parameters and shorter calculation time. The model might be an alternative method to control the expiration date of yoghurt shown in labeling and provide consumers with a safer food supply [54]. Ni and Gunasekaran [55] developed an image-processing algorithm to recognise individual cheese shred and automatically measure the shred length.
Rajbhandari and Kindstedt [56, 57] developed and evaluated an objective method to measure the area occupied by calcium lactate crystals on the surface of naturally smoked Cheddar cheese samples using digital photography and image analysis. They captured photographs of samples of cheese and analysed them using the Metamorph Offline program. Statistically, it was found that method have good repeatability. It was concluded that image analysis was well suited for evaluating changes in crystal coverage during cheese ageing because measurements were of non-destructive type with minimal rupture of cheese. Image analysis may serve as a useful tool to quantitatively evaluate the effects of factors such as cheese composition, packaging conditions and storage temperature on rate of crystal growth and time of crystal appearance during storage. Digital imaging technology may offer a means for quantitative measurement of surface crystals it unaffected by size, shape and temperature of sample.
Borin et al. [58] quantified Lactobaccillus spp. in fermented milks grown in MRS agar by use of digital colour images obtained by scanning agar under flatbed scanner. For this, they used glass petri plate as container for containing product while scanning.
Yam and Papadakis [4] analyzed the colour of microwaved pizza by using simple digital imaging method. A high-resolution digital camera (2 mega-pixel or above) was used to measure colour by capturing the colour image of the food sample under proper lighting. Once the colour images of the pizza samples were captured, the colour was analyzed qualitatively and quantitatively using Photoshop. It was concluded that, the digital imaging method allows measurements and analyses of the colour of food surfaces that are adequate for food engineering research. While it is not yet a replacement for sophisticated colour measurement instruments, it is an attractive alternative due to its simplicity, versatility and low cost. Photoshop has been shown to be able to analyze the colour for food samples, although the software was not originally designed for this purpose. However, it is already one of the most powerful software for colour analysis, and the manufacturer and users are regularly making enhancements [59].
Nawale et al. [60] used flatbed scanner and Adobe Photoshop method for the comparing colours of espresso drinks prepared with and without whey as a base ingredient. Fresh coffee samples were scanned at a constant scanning resolution, the scanned images were then transferred to Adobe Photoshop and colour values in terms of R, G and B value were recorded. It was found that colour of whey coffee was almost similar to colour of milk coffee. It was suggested in the study that this method for comparison of colours of product was safe and reliable. The similar method was used by Magdaline et al. [61] for the study of colour changes of gulabjamuns during frying. Fried gulabjamuns were scanned and using Adobe Photoshop software chroma, hue L, a and b values were computed. The study established the utility of computer vision system in measuring colours of heterogeneous products like gulabjamun. Vyawahare [62] also described colour measurement of dairy products by using Digital Camera and Adobe Photoshop.
Chocolate
Briones and Aguilera [63] have done image analysis of changes in surface colour of chocolate and development of non-uniform colour patterns caused due to blooming or the migration of fat to the surface. It is concluded that the computer vision system is an appropriate method to quantify overall changes as well as particular features over the whole chocolate surface thus enabling customization and standardization for quality assessment. Chocolate blooming was analysed by measuring L*, a*, b* values, chroma (C*) values, whitening index (WI), hue (h0) percentage bloom and energy of Fourier using computer vision system and image analysis.
Colour measurement by computer vision systems offers enormous opportunity because it is applicable in both food industry and in research field. It is the upcoming field with lot of scope for improvements with advancements in the computer hardware and software. On-line measurements of colour of food products during production stage itself coupled with visual inspection for defects in appearance provides great scope for their use in industry. Computer vision also helps in maintaining uniform appearance of products in beer, fruit juice, jam and jelly factories.