ISSN ONLINE(2319-8753)PRINT(2347-6710)
ISSN ONLINE(2319-8753)PRINT(2347-6710)
C.Nageswara Rao 1 , S.Sreehari Sastry 2, K.Mallika 3, Ha Sie Tiong 4 and K.B.Mahalakshmi 5
|
| Related article at Pubmed, Scholar Google |
Visit for more related articles at International Journal of Innovative Research in Science, Engineering and Technology
Statistical features extracted from the Gray Level Co-occurrence Matrix (GLCM) of liquid crystal textures are used to investigate the phase transition temperatures of nematic liquid crystals p – n Alkyl benzoic acids (nBA) where n = 8,9 and10. Textures of compounds are recorded as a function of temperature using Polarizing Optical Microscope attached to the hot stage and high resolution camera. In this method, second order statistical parameters – contrast, energy, homogeneity and correlation of the sample textures are computed using MATLAB software. The changes associated in the values of computed statistical features as a function of temperature is a helpful process to identify the phase transition temperatures of the samples. Results obtained from this method are compared with literature values of Differential Scanning Calorimetry (DSC) and are in agreement
Keywords |
| Alkyl benzoic acids; Optical Polarizing Microscope; phase transitions; textures; Gray Level Co-occurrence Matrix. |
INTRODUCTION |
| Gray Level Co-occurrence Matrix (GLCM) is a widely used texture descriptor and it is proven that results obtained from the co-occurrence matrices are better than the other texture discriminations methods [1, 2]. GLCM computes the statistical features based on gray level intensities of the image. Such features of the GLCM is useful in texture recognition [3], image segmentation [4], [5], image retrieval [6], color image analysis [7], image classification [8, 9], object recognition [10, 11] and texture analysis methods [12, 13] etc. Based on the good acceptance of GLCM in texture analysis, present work deals with the analysis of microscopic liquid crystal textures using GLCM. Statistical features derived from the GLCM of microscopic textures are useful to identify the transition temperatures of the liquid crystals. Firstly, in 1998 liquid crystal texture analysis is proposed to investigate the transition temperatures and defects in liquid crystals [14 - 19]. They used the different statistical approaches to identify the transition temperatures of liquid crystals, such as first statistical moments or parameters: mean, variance, skew ness, kurtosis are used to identify the transition temperatures and coherence length diagrams for characterizing the textural patterns, defects in textures. In addition to these parameters, the second order statistical parameters from the Gray level co-occurrence matrix of the texture [20]: contrast, energy, homogeneity and correlation; Legendre moments etc [21] are used to identify the transition temperatures of liquid crystals. First order statistical parameters are calculated from the image intensity values with out considering the pixel neighbor relation ship. Computation of Coherence length diagrams and Legendre moments of the liquid crystal textures involves the more number of pixels which carries the information relative to the spatial position of pixels, but coherence length analysis ignores the boundaries of the textures and complexity of coherence length analysis and Legendre moments methods is high. Therefore to obtain spatial dependence relationship, second order statistical parameters which consider the spatial relationship between groups of neighboring pixel intensity values are used. The investigation based on statistical parameters of the second kind called Gray Level Cooccurrence Matrix (GLCM) which extracts textural features based on two pixel intensity values which are in different directions (00, 450, 900, 1350) and distances (commonly preferred distance is equal to one). GLCM is created from the original gray scale image and the parameters calculated from this matrix is a more helpful to understand the details about the overall texture content [22, 23]. This kind of work was done for different liquid crystals by considering the displacement vector d i.e distance from pixel to its neighbor is equal to one at an angle of 00 such liquid crystals are discotic, cholesteric and ferroelectric liquid crystals. In the present work, with the consideration of different offsets (00, d (=1)), (450, d (=1)), ( 900, d (=1)), (1350 , d (=1)) of GLCM, transition temperatures of nematic liquid crystals p – n Alkyl benzoic acids (nBA) where n = 8,9 and10 are identified. Regardless of different offset combinations, features extracted from the GLCM identify the transition temperatures of the samples. |
| Polarizing Optical Microscope (POM) is one of the essential tools for phase identification of newly synthesized mesogenic materials, together with Differential Scanning Calorimetry (DSC), Differential Thermal Analysis (DTA) , X-ray Diffraction, Electron Spin Resonance (ESR) spectoscopy, Birefringence measurememnts, Ultrasonic studies, dialatometry and dielectric techniques etc [24, 25]. Precise phase identification could not easily be made by DSC, DTA and X-ray investigation approaches [26, 27]. On the other hand Polarizing microscopy determines the both phase type and phase transition temperatures basing on the changes in the characteristics of textural patterns which are recorded in an image as a function of temperature between crossed polarizers . However, results obtained from this methodology are compared with literature values of Differential Scanning Calorimetry (DSC) and are in agreement. |
EXPERIMENTAL & THEORITICAL CONSIDERATIONS |
| The structural phases and phase transitions are fundamentally determined in this experiment basing on the changes in the characteristics of textural patterns which are recorded in an image as a function of temperature. A commercially available glass slide is used for sample preparation [20]. Recording the textural images of the samples p, n - alkyl benzoic acids (nBA, n = 8, 9 and 10) being supplied by Frinton laboratories, USA has been done by Meopta polarizing microscope with attached hot stage described by Gray [28] and camera. The camera, a Canon made, having high resolution representing the image with 1936x1288 pixel size depicting 24 bit tonal levels in a true color production within the range of 0 to 255 gray levels in each three primary spectral frequency of red, green and blue separately. The analysis of liquid crystal textural phases and phase transitions has been carried out on MATLAB platform upon gray scale image through different statistical procedures [29]. |
| A. Texture features extraction from the Gray Level Co-occurrence Matrix (GLCM) |
| The co-occurrence matrix which is created from the gray scale image of the liquid crystal textures is used here for second order texture feature calculations. |
| B. Gray Level Co-occurrence Matrixes (GLCM): |
| The Gray Level Co-occurrence Matrix (GLCM) is a widely used texture analysis method especially for stochastic textures [23,30]. It enhances the details of image and gives the interpretation. The GLCM is a tabulation of how often different combinations of pixel brightness values (gray levels) occur in an image. The advantage of the co-occurrence matrix calculations is that the co-occurring pairs of pixels can be spatially related in various orientations with reference to distance and angular spatial relationships, as on considering the relationship between two pixels at a time. As a result the combination of grey levels and their positions are exhibited apparently. Therefore it is defined as “A two dimensional histogram of gray levels for pair of pixels, which are separated by a fixed spatial relationship”. However the matrix is sensitive to rotation. With the change of different offsets define pixel relationships by varying directions (rotation angle of an offset: 00, 450, 900, 1350) and displacement vectors (distance to the neighbor pixel: 1, 2, 3 …), different co-occurrence distributions are resulted from the same image of reference [30]. GLCM of an image is computed using displacement vector d defined by its radius, (distance or count to the next adjacent neighbor preferably is equal to one) and rotational angles (00, 450, 900, 1350). This was explained with example given below. For an image shown in Fig. 1(a), intensity values are given in the form of matrix Fig. 1(b), generalized GLCM of the image shown in Fig. 1(c) and the GLCM of the images with two angle of rotations are shown in Fig. 1(e & f). Where (i, j) represents the number of times a point having gray level j occurs relative to a point having gray level i satisfying the condition satisfied by the displacement vector d. In this paper we have considered the displacement vector d defined by its radius is equal to one. |
| Example: |
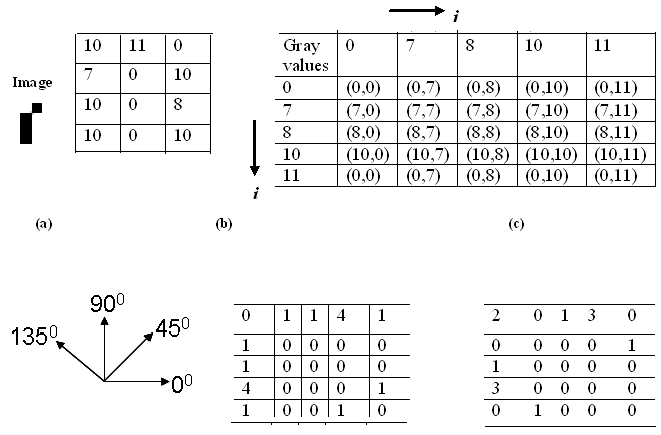 |
| Fig. 1 (a) test image; (b) test image intensity values in matrix form; (c) generalized fromof GLCM of test image; (d) roation offsets defines the pixel spatial relationships;(e) and (f) GLCMs of the image at an angle of 00 and 450. |
| In above example, each element of Gray level co occurrence matrix represents the probability of occurrence of pixel pair. From the spatial domain GLCM image being an output of second order statistics, again further statistical parameters like contrast, energy, homogeneity and correlation are determined by applying respective equations as mentioned in the following sections. |
| C. Feature extraction from the GLCM: |
 |
| Correlation that brings out how correlated a reference pixel to its neighbor over an image, is uncorrelated to energy, contrast and homogeneity. The equation for correlation measurement considers the mean and standard deviation for row and column in the matrix as shown. |
 |
RESULTS AND DISCUSSION |
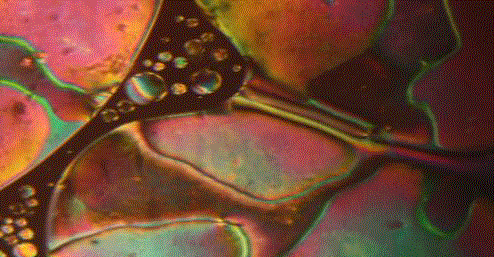
| The textural features and patterns formed during the course of transition from solid phase to isotropic phase in response to temperature are belonged to nematic phase shown in Fig. 2. |
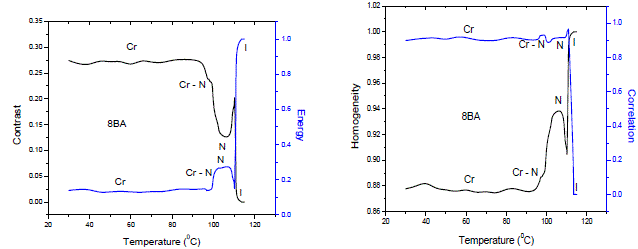 |
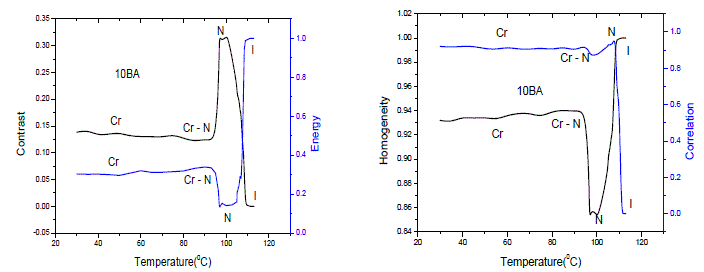
| GLCMs for the each temperature recording of the textures are computed by considering the different offsets (00, d (=1)), (45°, d (=1)), ( 90°, d (=1)), (135° , d (=1)). The phase transition temperatures for the liquid crystals, derived from the parameters of textures are presented in Figs. 3-5. The statistical parameters are related through the plotted curves. As a representative case the plots are drawn for heating cycles only. The behavior of the parameters, though different for different compounds which depend on the phase transformation and thermal stability of the phase [14, 20]. For the Figs. 3-5, the parameter values remained approximately constant as long as there is no change in the textural features like isotropic phase or solid phase. Once the phase transformation has taken place, either from isotropic phase to the liquid crystal phase or vice-versa, the re-appearance of textures or changes in the textural features at specific temperatures would bring abrupt variations in the parameter curves. |
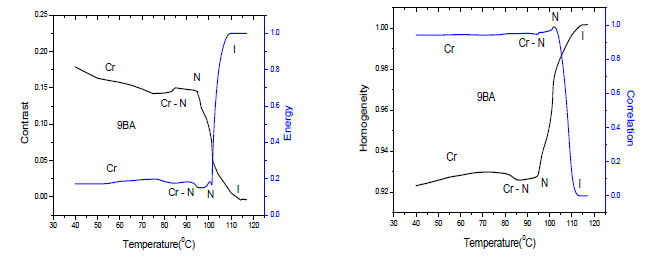 |
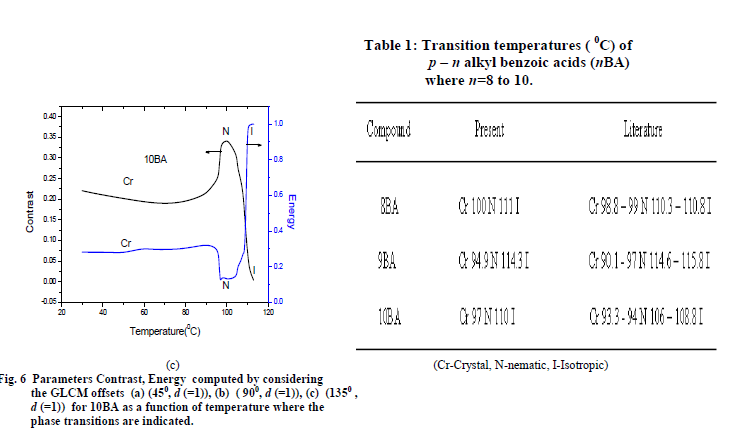
| In general, in response to temperature the changes in the characteristics of the textures would occur while passing through a phase transition [32]. Therefore, the temperature corresponding to abrupt changes in the plotted curves indicates the transition temperature of the sample. Hence, the methodology following statistical procedures is an efficient technique for investigating the phase transition of liquid crystals. Transition temperatures of the sample observed here are compared with literature [33] as shown in table 1. To show that, parameters computed from the different offsets of GLCMs textures yields the similar results, the plots are drawn for the compound of 10BA and are shown in Fig 6. It reveals that whatever be the offset angle of rotation, GLCM of the liquid crystal textures are useful to identify the textural features and their changes efficiently in order to investigate the phase transitions of the samples. |
 |
 |
| In DSC, the abrupt changes in the enthalpy and heat flow values are useful parameters to identify the transition temperatures of the samples. Liquid crystal texture analysis in conjunction with POM is a process in which the abrupt changes in textural feature values computed from the textures as a function of temperatures are useful to identify the transition temperatures of the samples. Both processes are correlated to each other in abrupt changes of their measured parameter values. |
 |
CONCLUSION |
| Present method is successful in identifying the phase transition temperatures of p,n alkyl benzoic acids using statistical analysis called Gray Level Co-occurrence Matrix (GLCM). Computational complexity of this method is very less. On the other hand method has some disadvantages; it ignores the spatial relationship between the texture patterns and sensitive towards image noise. |
ACKNOWLEDGEMENT |
| The authors gratefully acknowledge UGC DRS LEVEL III program No.F.530/1/DRS/2009 (SAP-1), dated 09-02-2009 and DST FIST program No DST/FIST/PSI – 002/2011 dated 20-12-2011, New Delhi, to the department of Physics, ANU for providing financial assistance. |
References |
|