ISSN ONLINE(2319-8753)PRINT(2347-6710)
ISSN ONLINE(2319-8753)PRINT(2347-6710)
M. Reshma1, A. Sachindra Babu2
|
| Related article at Pubmed, Scholar Google |
Visit for more related articles at International Journal of Innovative Research in Science, Engineering and Technology
Analysis of the house hold demand for milk in the year 2021 was estimated and juxtaposed with the production to identify the gap in production. The consequent per capita consumption of milk in Karnataka was derived. The result of the study reveals that Karnataka which has a marginal surplus of milk in 2010 - 11 may fall short by 2016 and 2021. It appears that there will be an acute shortage of milk with total consumption increasing to 54.04 lakh tonnes and 81.29 lakh tonnes, respectively. The corresponding increase in production in the state will be 50.4 lakh tonnes and 52.4 lakh tonnes respectively, due to the slow growth of output of milk in relation to consumption growth.
Keywords |
| Per capita household consumption, Karnataka State- Rural and Urban, Income elasticity, Population – 2011, 2016, 2021. |
INTRODUCTION |
| Currently, livestock is one of the fastest growing agricultural subsectors in developing countries. Its share to total GDP is around 3.9 per cent and is largest segment of the agricultural sector. This growth is driven by rapidly increasing demand for livestock products, driven by population growth, urbanization and increasing incomes. The Net Domestic Product from agriculture and allied activities is Rs. 1179341 crores out of which livestock sector contributes Rs. 4,59,051 crores of value of output (Basic Animal Husbandry Statistics (2013), Department of animal Husbandry, Dairying and Fisheries, GOI). In livestock sector, dairy has emerged as an important sub sector as it contributes Rs. 305484 crores of value of output to livestock sector in the year 2011-12 and milk production is 127.9 million tonnes in the same year. Karnataka stands 11th in milk production producing 54 lakh tonnes of milk in 2011-12. Hence dairying has become an important source of income for millions of rural families and has assumed an important role in providing employment and income generating opportunities. The bovine population in milk in both in the country and the state for the year 2011-12 is shown in Table I which reveals that the country had 12.294 million exotic / cross bred cows in milk; 32.007 indigenous / non descript cows in milk and 38.193 million buffaloes in milk. Perusal of milch animal population in the state vis a vis nation implied that Karnataka state comprised about 8.69 percent, 5.08 percent and 4.58 percent of exotic/ cross bred cow, indigenous / non descript cows and buffaloes in milk respectively, (Basic Animal Husbandry Statistics (2013), Department of animal Husbandry, Dairying and Fisheries, GOI). |
 |
| (Figures in parenthesis indicate percentages to total) Source: Basic Animal Husbandry Statistics (2013), Department of animal Husbandry, Dairying and Fisheries, GOI”. |
| A. MILK PRODUCTION SCENARIO |
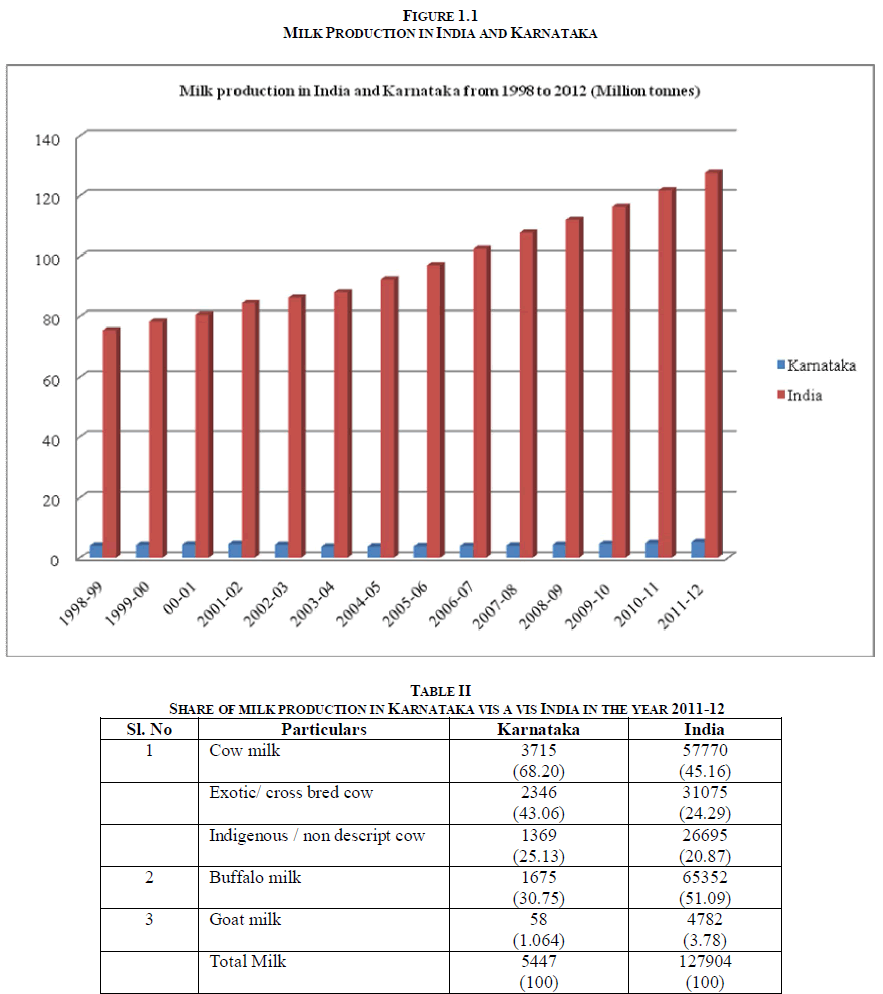
| The estimates of milk production over the year in the nation as well as the state are depicted in Figure1.1 and Figure 1.2. The milk production in India crossed 100 million tonnes by the year 2006-07 and reached 127.9 million tonnes in the year 2011-12. It is clear that the milk production in India had increased slowly during 1950s to 1970s and thereafter it increased sturdily. The milk production in Karnataka also progressed steadily with a dip during the year 2003-04. |
 |
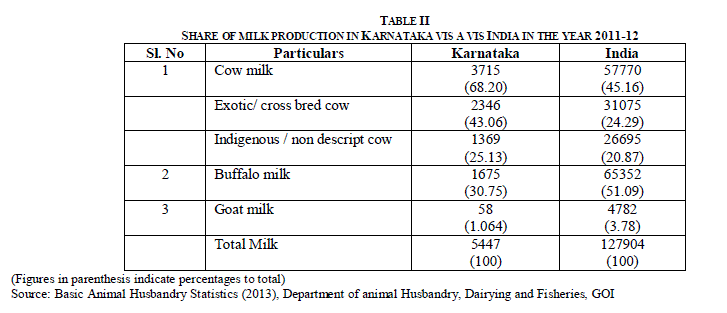
| (Figures in parenthesis indicate percentages to total) Source: Basic Animal Husbandry Statistics (2013), Department of animal Husbandry, Dairying and Fisheries, GOI |
| The share of milk production by different categories of animals in the year 2011-12 in India and Karnataka are shown in Table II. Among various species, buffalo contribute about 51 percent of the total national milk production, followed by cow (45 percent) and goat (about 4 percent). However, in Karnataka, about 88 percent of milk was contributed by the cows and rest by buffaloes. Among cow milk, contribution of exotic/ cross bred was immense (76.81 percent) than Indigenous / non descript cows (11.33 percent). |
| B. ANIMAL PRODUCTIVITY |
| Among various categories of dairy animals, the productivity was higher in cross bred cows, followed by buffaloes, non descript cows and goat both in nation and state as shown in Table III. The milk productivity of exotic / cross bred cow was slightly lower in Karnataka (6.00 kg per day) when compared to the nation average (6.97 kg per day). The scenario was similar in case of buffalo and goat productivity with 2.61 kg per day and 0.02 kg per day for the state respectively and 4.71 kg per day and 0.42 kg per day for the nation respectively. However, the state average productivity for indigenous / non descript cows was slightly higher (2.30 kg per day) than the national average (2.27 kg per day). |
 |
| C. PER CAPITA AVAILABILITY OF MILK |
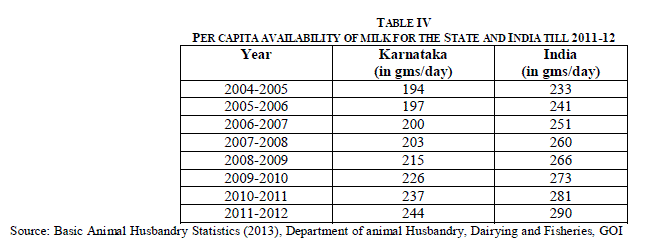
| According to National Dairy Development Board, per capita availability of milk has increased from 149 gms/day in 1991-92 to 290 gms/day in 2011-12. However, its world average is 284 gms/day in 2009-10 compared to 273 gms per day for India. For Karnataka, the per capita availability of milk reached 200 gms/day in 2006-07 and reached 244 gms/day in 2011-12 |
 |
| Source: Basic Animal Husbandry Statistics (2013), Department of animal Husbandry, Dairying and Fisheries, GOI |
LITERATURE SURVEY |
| There are a limited number of earlier attempts that looked into animal product consumption in India. These include Sinha and Giri (1989), examining the consumption of livestock products for three states of Gujarat, Punjab and Tripura; Gandhi and Mani (1995), discussing the importance of livestock product demand in India till the late 1980s; and Dastagiri (2004), addressing some general aspects of livestock product demand using data only up to 1993. However, none of these studies offer a comprehensive picture of animal product consumption in India and they are also quite dated. Today, although economically not a major global player, the livestock sector is socially and politically very significant. It accounts for 40 percent of the agricultural gross domestic product. It employs 1.3 billion people and creates livelihoods for one billion of the worlds poor. Livestock products provide one third of humanity’s protein supply, and are a contribution cause of obesity and a potential remedy for undernourishment (Seré et al., 1996; Steinfeld et al., 2006) Demand for livestock products is forecasted to outpace the growth in population numbers, in continuation of the trends observable over recent decades. During recent decades, the share of animal products in human diets drastically increased, in particular in the developing world. The drivers of these trajectories are multiple, resulting from an intimate interplay of a large number of socioeconomic drivers, such as urbanisation, income growth, the liberalization of trade and capital and the global expansion of Western lifestyles (Steinfeld et al., 2010). A vast number of studies analysed the consumption pattern of rice and other food grains in India and has employed different methodologies. Acknowledging the rising demand for livestock products with rising income among the population; Bhalla et al. (1999)assume high income elasticity’s for livestock demand accompanied by a shift towards cereal intensive livestock feeding systems. Hence they predict higher excess demand for cereals for the year 2020. Radhakrishna and Murty (1980) adopted piece wise expenditure system to find out income and price elasticity for different income groups. Murty (1999) finds that the parameter estimates of the Linear Expenditure System (LES) differ a good deal across the expenditure groups and between rural and urban areas, indicating the existence of non-linearity’s in consumption pattern. Although rural –urban dichotomy exists, the variations across the expenditure groups are more striking than rural-urban variations for the corresponding expenditure groups. As one moves from the lower to higher expenditure groups, the marginal budget share of cereals declines sharply in both rural and urban areas. The fall in marginal share is compensated by other non food items. Among cross price elasticity’s cereal cross price effect dominates. It is sizeable and negative. For non-food items it is large and negative. |
DATA AND METHODOLOGY |
| A. DATA SET: Two data sets was used for the study |
| 1. Quantity consumed or Per capita consumption |
| 2. District wise population of Karnataka from the Census |
| Quantity consumed or per capita household consumption used for the study consists of the estimates of district wise average of monthly per capita consumption separately for rural and urban household. This has been worked out from the data of National Sample Survey Organization (NSSO) for its 66th round from July 2009 to June 2010 of primary survey of Household Consumer Expenditure and Employment and Unemployment, it is the eighth quinquennial survey in the series. |
| Population data set is taken from census report 2011. For 2016, 2021 population is projected considering 1991 and 2001 population growth rate and extrapolating the population according to its growth rate. |
| Household Consumption of 2016 is calculated using the formula Consumption_2011*((1+Income growth rate *income elasticity of that commodity))^no. of years. |
| Household Consumption of 2021 is calculated using the formula Consumption_2016*((1+Income growth rate *income elasticity of that commodity))^no. of years. |
| B. ASSUMPTIONS |
| Certain assumptions have been made in the study which are outlined below |
| 35% of the population lives in urban areas, whereas 65% of the population lives in rural areas. |
| For Bangalore urban district 100% of the population lives in urban area, hence 90% weightage is given to urban area for household consumption, whereas non of them lives in rural area, so 10% weightage is given for Bangalore rural area. |
| Income is projected to grow at rate of 7% per annum. |
| House hold consumption is 65% of total consumption. |
| Income elasticity of milk and Production of milk forecast is derived from authors previous unpublished study |
 |
| By dividing total house hold consumption by total production we get a factor of 0.65, this is then used to calculate total consumption which includes indirect consumption and direct household consumption. |
RESULTS |
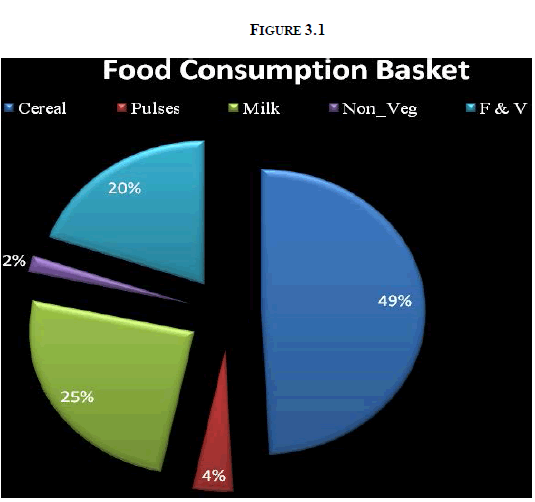
| A study of consumption is important as it gives an idea of the magnitude and the rate at which it is growing. It is useful for planning as it gives the policy makers the magnitude of the problem. Milk is a critical item of daily consumption and has implication of nutrition and welfare. The direct casuality of a shortage is on prices which is very delicate issue. According to ICMR guidelines 300 gms of milk should be consumed per day by an individual. Milk is an important item in the diet of household it constitutes 25% in the food consumption basket preceded by cereals (49%). |
 |
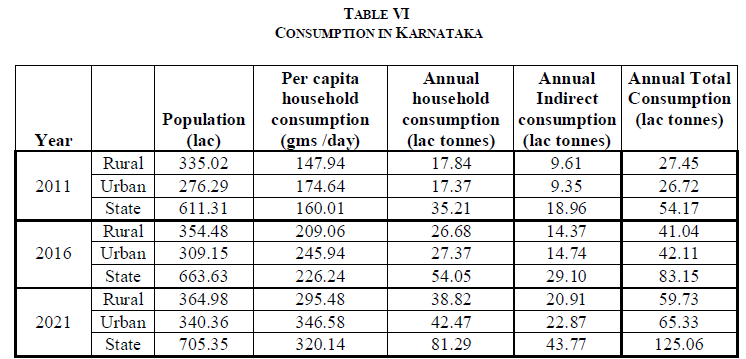
| The milk production in Karnataka is 54 lac tonnes for 2011, which translates into per capita household consumption of 160.01 gms/ day, this constitute rural and urban per capita household consumption of 147.94 gms/day and 174.64 gms/day respectively with population of 335.02 lakhs and 276.29 lakhs respectively. Household Consumption of Karnataka urban areas is more when compared to Karnataka rural areas. Data taken for the study includes only household consumption, but most of the time we consume more of milk and milk products from restaurants, fast foods, cafeteria, wastage etc, (indirect consumption) and this indirect consumption is not considered in NSSO data. Hence we assume that 35% of this consumption is from outside and per capita consumption will be 246.16gms /day for state and in rural area it is 227.60 gms/day and urban area consumption is 268.67 gms / day. In 2016, the trend in consumption growth continues to be the same as 2011. Per capita consumption of milk is 226.24 gms/day (household consumption); it is more in urban area (245.94gms/day) of Karnataka. State population is projected to be 663.63 lakhs, urban area population to be 309.15 lakhs and rural area population is 354.48 lakhs. By assuming that, indirect consumption of milk and milk products remains the same, then per capita consumption of milk in the state will be 348.05 gms/day this includes an average per capita consumption of milk in rural and urban area to be 321.62 gms/day and 378.36 gms per/day respectively. In 2021, per capita household consumption is likely to grow to 295.48gms/day and 342.5gms/day in rural and urban areas, while the population projected to be 364.98 lakhs and 340.36 lakhs respectively; this does not include indirect consumption of milk and milk products. Assuming 35% of milk and milk products is consumed indirectly, then per capita consumption of milk in the state will be 492.51 gms/day this includes an average per capita consumption of milk in rural and urban area to be 454.58 gms/day and 533.19 gms per/day respectively. |
 |
CONCLUSION |
| Demand for milk is increasing due to its nutritive value. It has increased almost one and a half time more than the previous year. In 2010 – 11 there is a marginal surplus of milk which may fall short by 2016 and 2021. It appears that there will be an acute shortage of milk with total consumption increasing to 83.15 lakh tonnes and 125.06 lakh tonnes, respectively. The corresponding increase in production in the state will be 50.4 lakh tonnes and 52.4 lakh tonnes respectively, due to the slow growth of output of milk in relation to consumption growth. Dairy sector has made significant achievement in production in the state. However, there are lacunae in the form of productivity, production potential, efficiency, regional disparities, marketing infrastructure and cold storage. |
References |
|