ISSN ONLINE(2278-8875) PRINT (2320-3765)
ISSN ONLINE(2278-8875) PRINT (2320-3765)
| Patterson Casmir D’Mello1, Sandra D’Souza2 Department of Instrumentation & Control Engineering, M.I.T, Manipal1,2 |
| Corresponding Author: Patterson Casmir D’Mello,E-mail: Sandra.dsouza@manipal.edu , pattersoncasmir@gmail.com |
| Related article at Pubmed, Scholar Google |
Visit for more related articles at International Journal of Advanced Research in Electrical, Electronics and Instrumentation Engineering
The increased performance of personal computers and their reduced cost has made it possible for development of PC based signal processing systems.Hospitals need several measurement systems that can measure physiological parameters of the patients. Although diagnostic medical instruments have been widely used, combining virtual instrument technology to achieve the purpose of physiological measurement has several benefits. These systems are efficient and cost-effective for acquiring and analyzing biomedical signals. Utilizing virtual instrumentation to achieve physiological measurement will largely decrease the cost and increase the flexibility of the instruments.This workaims at designing a virtual instrument for acquiring and processing of Electrooculogram signal. Electrooculography (EOG) is a technique for measuring the resting potential of the retina.
Keywords |
| Data acquisition, signal processing, LabVIEW, Virtual Instrument, EOGmeasurement |
INTRODUCTION |
| Hospitals need several measurement systems that can measure physiological parameters of the patient. Measurement systems should be able to measure accurately the vitals of patient like heart conditions, body temperature, electrical activity of the heart, electrical activity of the brain etc. This information should be readily available to the doctors for diagnosis and proper treatment. PCbased signal acquisition, and analysis is an efficient and cost effective method forbiomedical signal acquisition and monitoring. Isolation of the subject from the electronic circuitry is very important. Also, since the bio signal level is very low, amplification of signals is important.Hence, a PC based system consists of additional circuits for isolation and amplification of the signals. Combining virtual instrumentation technology for physiological measurements is an upcoming technology that is currently rising up at a faster rate. The cost can be drastically brought down and the flexibility can be increased by use of virtual instrumentation.National Instrument’s LabVIEWis a platform and development environment for a visual programming. The purpose of such programming is automating the usage of processing and measuring equipment in any laboratory setup. Controls and indicators on the front panel allow an operator to input data into or extract data from a running virtual instrument. A key benefit of LabVIEW over other development environments is the extensive support for accessing instrumentation hardware. The paper is organized as follows: Section I, gives introduction to virtual instrumentation and need of the current work,Section II, explains the bio signal details, Section III discusses the challenges in the design, Section IV explains the performance and results,and the last Section V concludes the paper followed by references used. |
BIOELECTRIC SIGNAL-.ELECTOOCULOGRAM |
| Electric potentials are generated as a result of movement of the eyeballs within the conductive environmentof the skull. Electrodes placed on either sideof the eyes or above and below them pick up the potentials generated by the motion of the eyeball. This potential varies approximately in proportion to the movement of the eyeballs. This signal is small separately. This requires five electrodes which are placedabove and below the eye for vertical movements,and on the sides of the eye (canthi) for horizontal movements. A reference electrode is placed on the forehead of the subject. Considering the cost and reliability makes Silver (Ag)-Silver Chloride (AgCl) electrodes ideal for EOG. An electrolytic gel based on sodium chloride is applied to the skin since the upper layers of the skin are poor conductors of electricity. Several methods have been proposed in literature that use Electrooculograms (EOGs) occurring as a result of eye movements [3]-[5]. An electric wheelchair controlled by eye movements using EOG has been developed as a movement support device. An EOG based hospital alarm system has been successfully tested. An eye gazing system for detecting any point where the eye gazes on the screen has been developed for communication assistance purposes [4], [5]. |
Noise Reduction |
| EOG signals have a range of 0.5Hz to 30Hz. Thus, a low pass filter with 30Hz cutoff could remove most of the high frequency noises. And a high pass filter of 0.5 Hz is required, which together form a band pass of 50 Hz. Other noise artifacts are mostly transients caused, for example, by the turning of an electrical switch on/off in the vicinity of the electrodes, contraction of the facial or neck muscles, slippage of the electrode due to sweat and eye blinking.However, the signals produced by eye blinks are, in fact, quite regular. They appear as sudden spikes with distinguishing amplitudes. Hence it is possible to easily recognize. |
| changedwhen the eye is moved and the movement of theeye is translated into electrical change ofpotential. This potential can be noninvasively recorded by using surface electrodes. provides anoninvasive method for recording full range ofeye movements. The resting potential is A pair of electrodes is required for measuringthe resting potential of the retina. It Hz). Electrooculography is a technique for (10 to 100microV) and has low frequencies (dc to 30 |
CONSTRUCTION AND CHALLENGES |
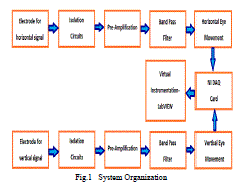
| The main objective of the current work carried on is to develop a virtual instrument which can acquire the EOG signal, perform noise elimination and amplification. Acquiring the signal using NI DAQ, designing the suitable low cost amplifier for amplification and designing of low pass and high pass filters was done. The acquired signal was displayed using LabVIEW front panel. The front panel and block diagram have been designed. The basic block diagram is shown is fig 1. |
 |
| filter of bandwidth 0.5Hz to 30 Hz. Power line frequency can be easily removed, using a notch filter |
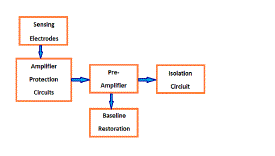 |
| Protection circuit: This circuit includes protection devices so that the high voltages that may appear across the input to the electrooculography under certain conditions do not damage it. |
| Preamplifier: The input preamplifier stage carries out the initial amplification of the EOG. This stage should have very high input impedance and a high common-mode-rejection ratio (CMRR). |
| Isolation circuit: The circuitry of this block contains a barrier to the passage of current from the power line (50 Hz). This barrier would prevent dangerous currents from flowing from the patient through the amplifier to the ground of the recorder or microcomputer. |
| Driver amplifier: Circuitry in this block amplifies the EOG to a level at which it can appropriately record the signal on the recorder. This stage also carries out the bandpass filtering of the electrocardiograph to give the frequency characteristics of the signal. |
A. Signal Acquisition and processing |
| Data acquisition cards for multiple channels for analog input and outputs are available. Using the libraries, programs for the data acquisition are quickly and easily made. Additional noise is filtered using the choice of filters like Butterworth, Bessel, Chebyshev I, and Chebyshev II provided in the LabVIEWsoftware.The installation of the DAQ card includes: |
| 1. Installation of the application software |
| 2. Installation of the DAQ card driver first, before assembling DAQ card into the desktopcomputer. This process can ensure WINDOWS to detect the DAQ card. |
| 3. Installing the necessary devices, accessories and cables. |
| 4. Power on the computer. |
| 5. Confirm that the device is recognized. |
| 6. Run the test Panel. |
| In the current work, M Series USB-6221 is used as data acquisition interface. |
B. Design of front panel |
| Different blocks used in the front panel are: |
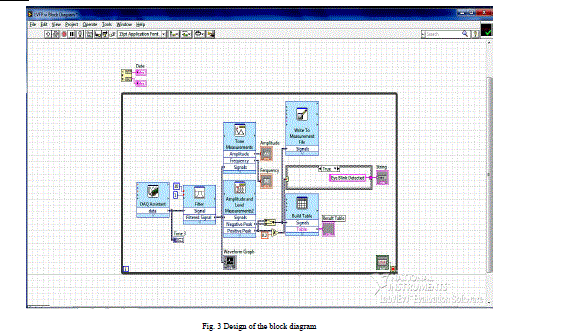
| 1. Case structure:Only one subdiagram is visible at a time, and the structure executes only one case at a time. An input value determines which subdiagram executes. |
| 2. Time delay: The Wait (ms) function waits until the millisecond counter counts to an amount equal to the input you specify. This function guarantees that the loop execution rate is at least the amount of the input you specify. |
| 3. Filter: The Filter Express VI processes a signal through filters and windows. Filters used include the following: Highpass, Lowpass, Bandpass, Bandstop, and Smoothing. Windows used include Butterworth, Chebyshev, Inverse Chebyshev, Elliptical, and Bessel. |
| 4. Waveform graph: The waveform graph displays one or more plots of evenly sampled measurements. |
| 5. Amplitude and level measurements:he Amplitude and Level Measurements Express VI performs voltage measurements on a signal. These include DC, rms, maximum peak, minimum peak, peak to peak, cycle average, and cycle rms measurements. |
| 6. Tone measurements:The Tone Measurements Express VI searches for a single tone with the highest frequency or highest amplitude. It also finds the frequency and amplitude of a single tone. |
| 7. Write to measurement file:The Write to Measurement File Express VI writes a file in LVM or TDM file format. |
| 8. Build table: Converts a signal or signals into a table of data that lists the amplitude of each signal and the time data for each point in the signal. |
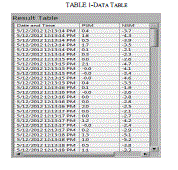
| 9. Result table:Use the table control to create a table on the front panel. Each cell in a table is a string, and each cell resides in a column and a row. Therefore, a table is a display for a 2D array of strings. |
| 10. String:A string is a sequence of displayable or non-displayable ASCII characters. Strings provide a platformindependent format for information and data. |
| 11. While loop:Repeats the sub-diagram inside it until the conditional terminal, an input terminal, receives a particular Boolean value. |
| 12. Merge signal:Merges two or more signals into a single output. Resize the function to add inputs. This function appears on the block diagram automatically when you wire a signal output to the wire branch of another signal. |
| 13. Simulate signal: The Simulate Signal Express VI generates simulated data such as a sine wave. |
| 14. Numeric control & indicator:The numeric data type can represent numbers of various types, such as integer or real. The two common numeric objects are the numeric control and the numeric indicator. (courtesy: National Instruments, LabVIEW) |
RESULTS AND DISCUSSIONS |
| The biomedical signals acquired from the human body are frequently very small, often in the millivolt/microvolt range, and each has its own processing needs. Electrooculography signals are in the microvolt range and have many frequency components. |
| These biomedical signals require processing before they can be analyzed. LabVIEW contains the tools, from fast Fourier transforms to digital filters to realize complex analysis. In order to do frequency analysis, a complex signal must first be broken down into its frequency components. One of the most common way to do this is with an FFT. |
| In order to facilitate this type of analysis, LabVIEW comes with built in FFTs that make the process of component separation quick and easy. Digital filters are provided with the choice of Butterworth, Bessel, Chebyshev and digital filters. With a few adjustments these filters can be configured for almost any design that is needed. |
| The Fast Fourier Transform (FFT) and the power spectrum are powerful tools for analyzing and measuring signals from plug-in data acquisition (DAQ) devices. |
| We can effectively acquire time-domain signals, measure the frequency content, and convert the results to real-world units and displays as shown on traditional bench top spectrum and network analyzers. Since the signal of interest is continuously varying non stationary signal, Wavelet transform block has been included. |
| The wavelet transform is a mathematical tool that decomposes a signal into a representation that shows signal details and trends as a function of time. |
| The main advantages of wavelet methods over traditional Fourier methods are the use of localized basis functions and the faster computation speed. |
A. Design Considerations |
| The work undertaken involves 4 stages which are discussed as below.The first stage is selection of the electrodes. The electrodes were chosen with the concern of protecting the eyes from hazardous elements. Silver/Silver-Chloride electrodes were chosen because the half-cell potential was the closest to zero. Electrodes with the smallest amount of halfcell potential are desirable because they cause the |
 |
B. Design Considerations |
| The work undertaken involves 4 stages which are discussed as below.The first stage is selection of the electrodes. The electrodes were chosen with the concern of protecting the eyes from hazardous elements. Silver/Silver-Chloride electrodes were chosen because the half-cell potential was the closest to zero. Electrodes with the smallest amount of halfcell potential are desirable because they cause the |
| Stages 2 and 3 encompass the detection of horizontal and vertical movements of the eye, respectively. The second stage (for horizontal discrimination) detects lateral movements at the periphery of each eye. The hardware in this stage consists of the EOG biopotential amplifier. Similarly, the third stage (for vertical discrimination) consists of another EOG biopotential amplifier. Location of the electrodes is shown in figure 3. When the eyes look straight ahead, a steady dipole is created between the two electrodes. When the gaze is shifted to the left, the positive cornea becomes closer to the left electrode, which becomes more positive. The following performance least amount of offset. By definition, the hydrogen electrode has a zero half-cell potential, but due to the gaseous nature, they cannot be feasibly used. Although lead electrodes have a lower half-cell potential than the Ag/Ag-Cl electrodes, lead is hazardous to the health and thus is avoided. Thus my choice of electrodes takes into account an optimal level of safety regulations and precision (least offset). |
| specifications were chosen based on the voltage and frequency ranges of the EOG signal. |
| Frequency Range DC – 50 Hz |
| Input Voltage Range 50 – 2500 μVolts |
| Voltage Gain ~3,828 |
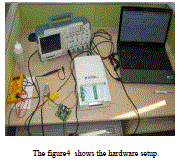 |
| Therefore by placing electrodes to the left and right and above and below the eye, horizontal and vertical movements can be obtained. The output of the second and third stage is inputted into the final stage, the LabVIEW data acquisition software tool and the personal computer. The selection of LabVIEW over another popular data acquisition tool, due to its more extensive graphical capabilities along with its availability. LabVIEW is necessary to convert the signal obtained by the EOG into interpretable data for directional discrimination. Moreover, a graphical display will be implemented in LabVIEW to simulate the movement of an icon on the computer screen. |
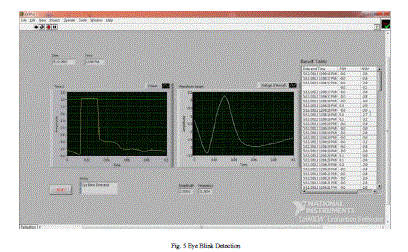
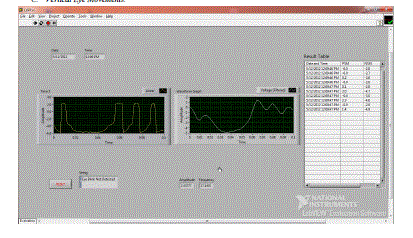
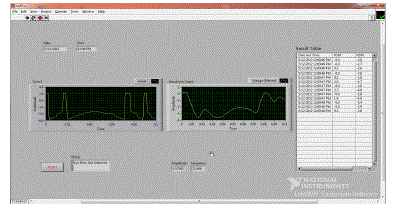
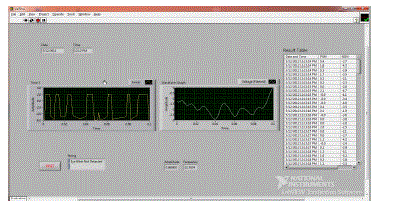
| Figures 5 shows the blinks, figures 6 and 7 displays the vertical movements and figure 8 displays the horizontal movement of the eyes captured by the designed data acquisition system and displayed by the front panel. |
 |
C. Vertical Eye Movements: |
 |
 |
D. Horizontal Eye Movements: |
 |
| Extraction of the information from the experiment for future use is obtained from the result table which is visible at the right side of the front panel which is shown below is table 1. |
 |
CONCLUSION |
| The performance of personal computers has been continuously increasing and the cost has been decreasing. This has facilitated the development PC based signal acquisition and analysis systems. These systems can replace costly stand-alone systems that are currently in use. Thecomponents necessary for a LabVIEW based acquisition and analysis system areinexpensive, and readily available. Here, the initial requirements of a PC based biosignal acquisition and processing systems have been studied and reviewed. Developing PC based systems using LabVIEW is an efficient alternative to stand alone systems. EOG amplifier was designed. The data acquired was amplified, filtered and observed on the front panel. Both the horizontal and vertical movement of the eyes and eye blinks were visualized. The authors wish to conclude that the system developed has certain limitations in terms of accuracy and features. There is lot of scope for future improvement of the developed system. |
ACKNOWLEDGMENT |
| The authors wish to thank the department head, laboratory staff, Institutional LabVIEW Academy, at college Innovation Centre for permitting to conduct the experiment and also grateful to all the subjects who have cooperated in the experiment. |
References |
|