ISSN ONLINE(2278-8875) PRINT (2320-3765)
ISSN ONLINE(2278-8875) PRINT (2320-3765)
R.Nivethika1, N.Kirthika2
|
| Related article at Pubmed, Scholar Google |
Visit for more related articles at International Journal of Advanced Research in Electrical, Electronics and Instrumentation Engineering
This paper presents real time heart defect monitoring and heart sound hearing system. The purpose of this work is to design and implement a digital stethoscope which acts as a platform to detect cardiac murmurs. Digital stethoscope is used to help doctor in analyzing the heart condition and to reduce the risk of not discovering certain abnormal heart conditions. The system design comprises of a traditional stethoscope with an electrets condenser microphone, pre-processing circuit and TMS320C5515 Digital Signal Processor kit. The heart sound signal from the pre-processing circuit is acquired and sent to TMS320C5515 using the audio codec input. The heart sound signal acquired is subjected to signal processing methods such as acoustic noise cancellation algorithm and heart defect detection algorithm. Noise cancellation algorithm is used to remove the noise from the heart sound signal acquired. Finally using the heart defect detection algorithm heart sounds can be classified as normal or abnormal heart sound.
Keywords |
| Heart sounds, TMS320C5515, Heart defect detection algorithm, Noise cancellation algorithm, Heart murmurs. |
I. INTRODUCTION |
| Heart sounds are produced as a result of cardiac activities taking place in each heart cycle. This heart sounds consists of two basic components S1 and S2, sometimes S3 and S4 heart sounds may be present along with the basic heart sounds. The heart sound S1 is produced due to the closure of mitral valve followed by the tricuspid valve and S2 is produced due to the closure of aortic valve followed by the pulmonary valve [3]. Heart murmurs are produced due to the turbulence flow of blood during each cardiac cycle. Heart murmurs may be pathological or innocent. Pathological heart murmurs are the symptoms of heart disease [2]. Phonocardiogram is the visual representation of heart sounds as a function of time. The heart sounds can be heard using auscultation device named as stethoscope. To detect the heart abnormalities from the heart sounds requires long years of experience and there are chances that sometimes the heart abnormalities may not be detected in the earlier stage which leads to the severity of the heart disease. Digital stethoscope assists the doctor in detecting the heart abnormalities by using heart defect detection algorithm to differentiate the normal and abnormal heart sounds and providing the treatment to the patient as early as possible. People without any medical knowledge can also check their heart conditions using digital stethoscope. |
II. LITERATURE SURVEY |
| Ying-Wen Bai and Chao-Lin Lu developed a digital stethoscope for removing disturbances in the heart sounds using adaptive chebyshev IIR band pass filter of type 1[1]. Haibin Wang, Jian Chen and Yuliang Hu developed a heart sound monitoring and analysis system in which heart state can be monitored in home to find out whether the heart murmurs are innocent or pathological [2]. Ms.Kadam Patil D.D and Mr.Shastri R.K developed a system in which patients can record their heart sound at any moment and the heart sounds are transmitted to the doctor wirelessly using zigbee module [5]. Yuan-Hsiang Lin, Chih-Fong Lin, Chien-Chih Chan and He-Zhong You suggested digital stethoscope based on ARM to filter, play back and transmit the heart sounds to the PC through USB interface [7]. Ashish Harsola, Sushil Thale and M.S.Panse proposed PIC based stethoscope in which the heart sounds acquired are processed using Peripheral Interface controller (PIC) and recorded using serial EEPROM which can be heard and plotted as a graph called phonocardiogram (PCG) [3]. Wang Haibin, Hu Yuliang, Liu Lihan, Wang Yan and Zhang Jinbao used autoregressive power spectral density to differentiate normal and abnormal heart sounds [4].Jinqun Liu, Wuchang Liu suggested envelope extraction methods like homomorphic filtering, Shannon entropy to find the abnormal heart murmurs [8], [9]. Digital signal based (TMS320C6713) of low cost was developed by D.Mandal, M.Chattopadhyay and I.Saha Mishra to find out symptoms of heart disease using end point detection method [6].TMS320C6711 Digital Signal Processor based digital stethoscope was developed by D.Balasubramaniam and D. Nedumaran to detect the heart malfunction using STFT method and wavelet transform method[11]. |
| The paper is organized as follow section III deals with the system description. Hardware signal acquisition unit is explained in section IV. In section V and VI algorithms such as noise cancellation and heart abnormality detection are elucidated. Results obtained using different feature extraction methods are presented in section VII. Conclusion and future work is dealt in section VIII. |
III.SYSTEM ARCHITECTURE |
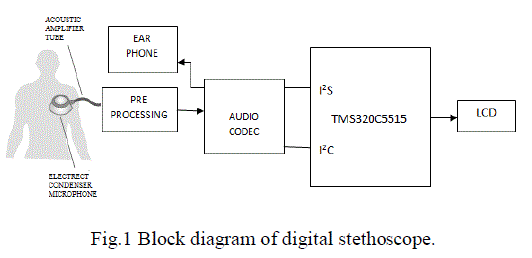
| The proposed system comprises of two sections signal acquisition module and signal processing module. Fig.1 shows the schematic diagram of the digital stethoscope. For acquisition of heart sound signal a traditional stethoscope is fitted with an electrets condenser microphone [4]. The signal acquired is given to the pre-processing circuit for amplification. Amplified heart sound signal acquired is in the analog form. For performing any analysis the signal needs to be in the digital format. Analog to digital conversion of the signal is the main function of signal processing and it is done in audio codec of TMS320C5515 Digital Signal Processor kit. The digital data is sent to the processor through I2C bus. The signal noise is removed using noise cancellation algorithm programmed in the processor. The denoised heart sound signal is given to the audio codec using I2S bus which is again converted in to analog signal and can be heard using the head phone connected to the headphone pin in TMS320C5515. The noise cancelled heart sound signals are analysed using heart defect detection algorithm implemented in the processor and based on this normal and abnormal heart sounds are found out and displayed. The algorithms are implemented using MATLAB 2010a. |
 |
IV.SIGNAL ACQUISITION UNIT |
| Signal acquisition unit consists of sensor and the pre-processing circuit. Block diagram of signal acquisition unit is shown in Fig.2. Heart sounds are picked up using sensor. Here the sensor used is the traditional stethoscope with an electrets condenser microphone. Microphone is fitted in the head of the traditional stethoscope by removing one of the ear tubes of the stethoscope. The electrets condenser microphone is powered with 5V. The signal from the microphone is then passed to the high pass filter. First order high pass filter with cut off frequency 10Hz (equation (1)). |
 |
 |
| where fc (cut off frequency) is in hertz, R (resistance) is in ohms, C (capacitance) is in farads. The signal from high pass filter is then passed to the low pass filter. Two pole Sallen key low pass filter is used with cut off frequency 1 KHz (equation (2)). |
 |
| The signal from the low pas filter is passed to the notch filter . Notch filter which is also called as anti hum filter is used to filter out main hum. Twin T notch filter is used which has large degree of rejection at 50Hz (equation 3). |
 |
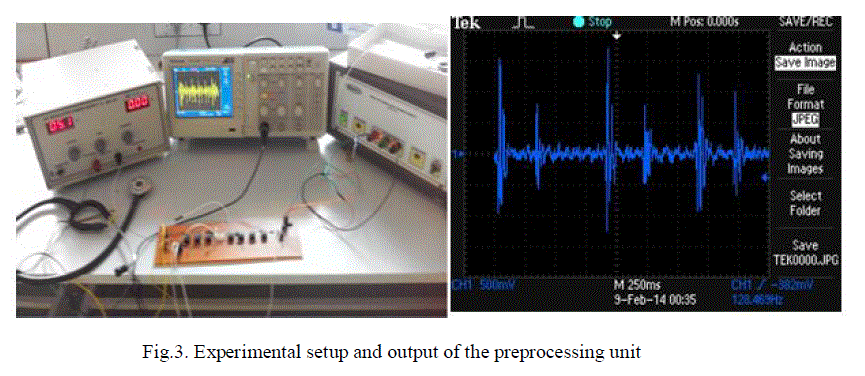
| The signal from the notch filter is of very small amplitude and to amplify the signal, it is sent to the instrumentation amplifier of gain 21. The heart sound signal acquired is viewed in digital storage oscilloscope which is shown in Fig.3.The gain of the instrumentation amplifier is given by the formula, |
 |
 |
V. ACOUSTIC NOISE CANCELLATION ALGORITHM |
| The signal from the pre-processing circuit consists of some amount of noise. So in order to remove the noise acoustic noise cancellation algorithm is used. Least mean square (LMS) algorithm is used for noise cancellation. It is a type of adaptive filter which produces least mean square of the error signal. |
| Linear model of an unknown plant is provided using adaptive filter by monitoring the environment and accordingly varying the filter transfer function. LMS algorithm consists of two steps |
| Filtering process |
| Adaption process |
| In filtering process, the output of FIR filter is calculated by convolving the taps of filter with the input signal and then the error is calculated by comparing the output of FIR filter and the desired signal. Adaption process includes calculation of the filter coefficients based on the least mean square error. |
VI. HEART DEFECT DETECTION ALGORITHM |
| Heart defect detection using heart sounds are crucial since heart sounds are non-stationary and complex. Thus for the analysis of heart sounds, the PCG signal acquired from the signal acquisition unit has to be segmented. Therefore for the detection of heart malfunctions, Heart Defect Detection Algorithm (HDDA) is developed. HDDA algorithm comprises of five steps. They are, |
| i. Extraction of first two heart cycle |
| ii. Pre processing |
| iii. Feature extraction |
| iv. Smoothing |
| v. Threshold setting |
| i. Extraction of first two heart cycle: |
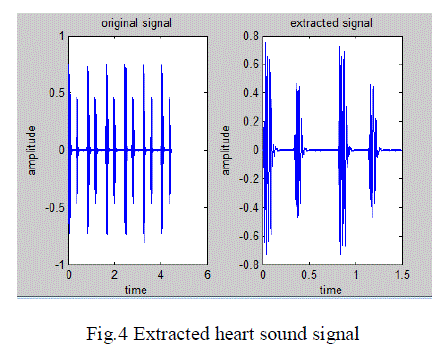
| PCG signal comprises of events such as S1, S2, S3, S4 and murmurs in each cycle, like wise each PCG signal consists of many cycles. As this cycle repeats and for easy analysis only the first two heart cycles are considered as shown in the Fig.4 |
| ii. Preprocessing |
| After extraction of first two heart cycle the extracted signal is filtered using chebychev high pass filter of fourth order with cut off frequency of 10Hz and 0.5 dB ripple in order to remove low frequency noise [10]. Heart sound intensities vary among patients so the filtered signal y (t) is normalized. |
 |
 |
| iii. Feature extraction |
| Feature extraction deals with extraction of information that is relevant from the normalized signal. Different feature extraction methods are available. Most commonly used methods are frequency analysis and envelope extraction methods. |
| 1) Frequency analysis method |
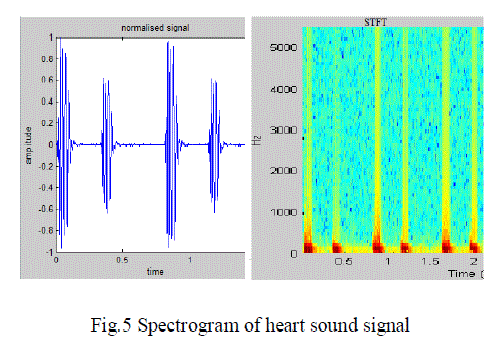
| In order to identify the normal and abnormal heart sound signals frequency analysis is performed using short time Fourier transform (STFT) [11]. The phase and frequency of local section of the signal which changes over time is calculated using STFT in equation (6). |
 |
| where t1 is the time parameter, u is the frequency parameter, xnorm(t) is the normalized signal to be analysed, w(t-t 1)is the windowing function, STFT of xnorm is computed for each window centered at t=t1.Using 1024 point STFT the frequency components of normalized PCG signal can be analysed. The normalized signal is made in to segments of eight with overlap of 50% and using hamming window and each segment is windowed. Number of frequency points is 128 points. The spectrum of frequencies is represented visually using spectrogram. |
| 2) Envelope extraction method |
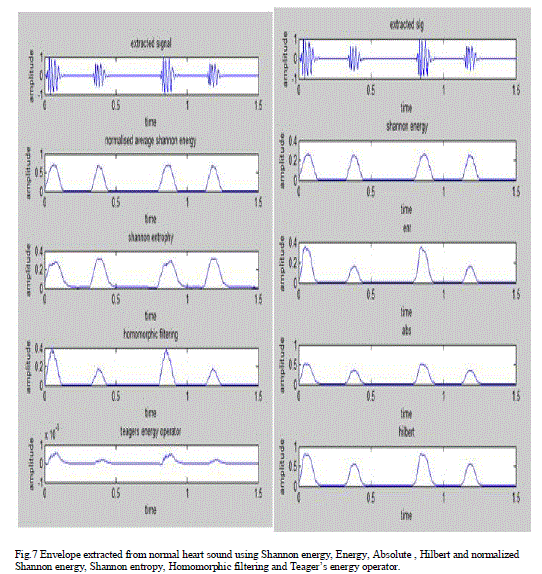
| Envelope of the heart sounds represents the amplitude deviations and durations of heart sounds. It consists of information for the diagnosis of abnormal heart condition. There are different techniques used to extract the envelope of the heart sound signal. Some of them are explained below. |
| 2.1 Energy |
| The sample of the normalized signal is squared to evaluate its energy [12]; equation (7) represents the energy of the signal. |
 |
| where E (t) is the energy of the signal, xnorm(t) is the normalized heart sound signal. |
| 2.2 Absolute |
| The amplitude of the normalized signal represents the absolute of the signal [12]. Equation (8) represents the absolute of the heart sound signal. |
 |
| where A (t) is the absolute of the signal, xnorm (t) is the normalized heart sound signal. |
| 2.3 Shannon energy |
| Shannon energy method is the median approach that attenuates low intensity signal and emphasizes medium intensity signal and therefore the medium intensity signal has increased chance to be detected [12]. Shannon energy is represented in equation (9). |
 |
| where S (t) is the Shannon energy of the signal, xnorm(t) is the normalized heart sound signal. |
| 2.4 Hilbert transform |
| Hilbert transform represents the real signal as a complex analytic signal without changing the power and energy, the phase of the signal is changed [8]. The hilbert transform is represented in equation (10) as follows, |
 |
| where ‘*’ indicates convolution operation. |
| 2.5 Normalized average Shannon energy (NASE) |
| The NASE method also named as Shannon envelope method also emphasizes the medium intensity signal [8]. The average Shannon energy is calculated for each segments of 0.02 s throughout the normalized signal with overlap of 0.01s. It is represented as in equation (11). |
 |
| where N (t) is the normalized average Shannon energy of the signal. |
| 2.6 Shannon entropy |
| Shannon entropy method gives more importance to the low intensity signal and it attenuates high intensity signal [12]. It is represented by the formula in equation (12) |
 |
| where SE(t) is the Shannon entropy of the signal, xnorm(t) is the normalized heart sound signal |
| 2.7 Homomorphic filtering |
| Smooth envelope can be extracted using the homomorphic filtering method which is used to localize the heart sounds and murmurs. Frequency Alterable Homomorphic Filtering (FAHF) is an improved envelope extraction method [9]. The procedure of FAHF is as follows, |
| The heart sound signal can be expressed as in equation (13) |
 |
| where xnorm (n) is the normalized heart sound signal, s (n) is the part of the signal which varies slowly and f(n) is the part which varies fastly. |
| 1. Logarithmic transformation is applied to the signal in order to convert the multiplication operation to addition, |
 |
| 2. Low pass filter is applied to the signal. The high frequency component vary with time rapidly |
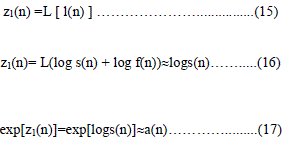 |
| 3. Applying exponentiation to the signal z1(n). |
| 2.8 Teager’s energy operator |
| Teager’s energy operator is a non linear operator which is used to improve high energy area. Teager’s energy operator is represented in equation (18), |
 |
| where T (t) represents the teager’s energy. x norm (t),x norm (t-1), x norm (t+1) are the signals at time t, t+1, t-1. |
| 2.9 Normalized lag-1 autocorrelation function |
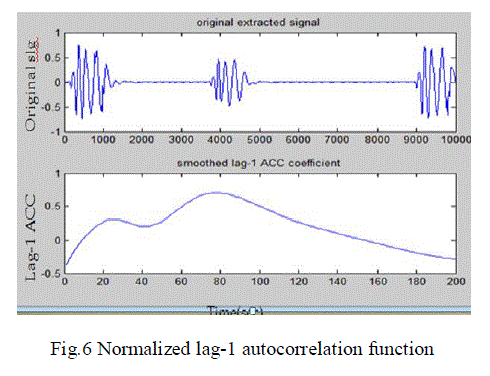
| The randomness of the signal is measured using autocorrelation function [10]. The autocorrelation function of a signal of N samples is defined as, |
 |
| where K represents the number of lags. Normalized auto correlation coefficient at lag-1 can be computed as, |
 |
| iv. Smoothing |
| Linear filter with rectangular impulse response is used for smoothing the signal [10]. Smoothing is done not only to smooth the ripples but also to reduce the problem of heart murmurs of different level. |
| v. Threshold setting |
| For all envelope extraction methods based on the peak detected a threshold value is set in order to find out whether it is normal or abnormal heart sound. Here two threshold values are set. One threshold value is set such that the events S1,S2,S3,S4 peaks are detected above that threshold and second threshold is set to detect the murmur such that the murmurs lies between the first and second threshold. |
VII. COMPARISON AND ANALYSIS OF DIFFERENT FEATURE EXTRACTION METHOD |
| Sixty four heart sound signals are collected from the database and they are classified based on the shape, location of the murmur and the segments present in the signal. The feature extraction techniques and STFT method were tested for all 64 heart sound signals. |
| 1) STFT method |
| STFT can only represent the frequency components of the signal in time interval, but not at particular time instant. Thus, the STFT is not a suitable method because the patient’s heart condition is indicated by frequency components at any time instant. Frequency components of the signal are represented using spectrogram as shown in Fig.8. |
| 2) Envelope extraction method |
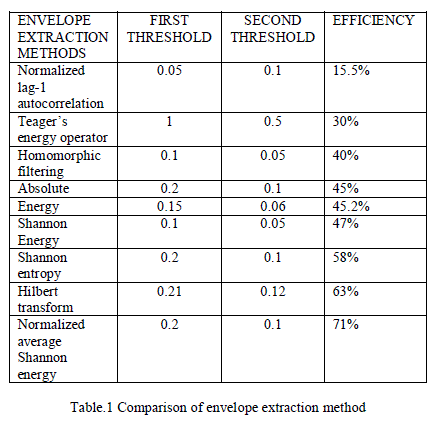
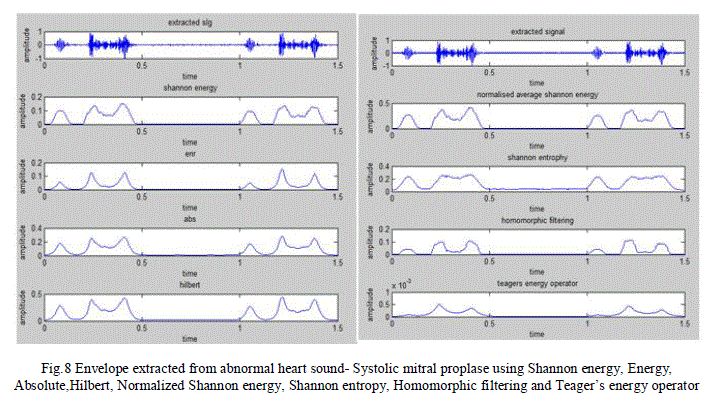
| Using eight feature extraction methods the results obtained are shown in the Fig 5, 6, 7 and 8. Fig.5, Fig.6 and Fig.7 shows the result obtained for normal heart sound which consists of fundamental components of heart sounds S1 and S2. Fig.8 shows the result obtained for abnormal heart sound- systolic mitral proplase which consists of S1, S2 & mid-systolic click, followed by a late systolic murmur. Efficiency and threshold of different envelope extraction method is tabulated Table.1 |
VIII. CONCLUSION AND FUTURE WORK |
| The heart sound signal is thus acquired using signal acquisition unit which consists of filters and amplifiers. Noise in the cancelled using Least Mean Square algorithm then using heart defect detection algorithm the signal is analysed and found out whether it is normal or abnormal heart sound signal by applying threshold condition to the feature extracted signal. From the different feature extraction method tried Hilbert transform method and normalized average Shannon energy method proves to be efficient. Future work is implementing the algorithms in the digital signal processor TMS320C5515 and displaying whether the heart sound signal is normal or abnormal. |
 |
 |
 |
 |
 |
References |
|