ISSN ONLINE(2278-8875) PRINT (2320-3765)
ISSN ONLINE(2278-8875) PRINT (2320-3765)
Anjali Sharma1, Rameshwar Singh2
|
| Related article at Pubmed, Scholar Google |
Visit for more related articles at International Journal of Advanced Research in Electrical, Electronics and Instrumentation Engineering
Proteins perform their functions by interaction with other molecules known as target. Protein-target interactions are very specific in nature and occurs at pre defined locations in proteins known as hotspots. For successful protein-target interaction both protein and target must share common spectral component known as characteristic frequency. Characteristic frequency is of utmost importance since it forms basis for protein-target interactions, thus an approach for determination of characteristic frequency in proteins using chirp Z-transform is illustrated in this paper.
Keywords |
| proteins, characteristic frequency, chirp Z-transform, consensus spectrum, electron ion interaction potential (EIIP), resonant recognition model (RRM) |
I. INTRODUCTION |
| Proteins are the probably the most important class of biochemical molecules. Proteins forms the basis for major structural component of animal & human tissue. Proteins are the building blocks of life and are essential for growth of cells and tissue repair. Protein is natural polymer molecule consisting of amino acid unit. All proteins are made up of different combination of 20 compound called amino acids. Depending upon which amino acid link together proteins molecules form enzymes, hormones, muscles, organs and many tissues in the body. |
| Proteins are polymers of amino acid joined together by peptide bond. There are 20 different amino acids that make up essentially all the proteins on earth. An amino acid consists of a carboxylic acid group, an amino group and a variable side chain all attached to central carbon atom (also called α carbon). The side chain is the only component that varies from one amino acid to another. Thus the characteristic that distinguish one amino acid from another is its unique side chain that dictates an amino acid chemical property[1]. |
| Biologists distinguish four level of organization in structure of proteins [2]. Primary structure is linear arrangement of amino acids in a protein and the location of covalent linkages such as disulfide bond between amino acid. Secondary structure consists of area of folding or coiling within a protein, examples include alpha helices and pleated sheets, which are stabilised by hydrogen bonding. The final three dimensional (3-D) structure of proteins which results from a large number of non-covalent interaction between amino acids. The quaternary structure arises from non-covalent interaction that binds multiple polypeptide into a single larger protein. Even though proteins can be imagined to be linear chain of amino acid, they are not present as linear chains in reality. They fold into complex three dimensional (3-D) structures forming weak non-covalent bond between their own atoms. It is this folding ability that enable them to perform extreme specific functions. The information necessary to specify the three dimensional (3-D) shape of proteins is contained in its amino acid sequence. [2] |
II. CHIRP Z-TRANSFORM |
| The chirp Z transform algorithm has been one of the most popular algorithm in domain of digital signal processing. Chirp Z-transform is a computational algorithm for numerical evaluation of Z transform of N samples. This algorithm has been named chirp Z-transform (CZT) algorithm. Using CZT algorithm one can efficiently evaluate the Z transform at M points in z plane which lie on circular or spiral counter beginning at any arbitrary point in z plane. The angular spacing of points is an arbitrary constants, M & N are arbitrary integers. |
| The evaluation is based on the facts that the values of Z transform on circular spiral contour can be expressed as discrete convolution. |
 |
III. RESONANT RECOGNITION MODEL |
| Proteins perform their biological function by interacting with other molecule known as target. These interactions are very selective in nature. The specificity of the interaction is by unique three dimensional (3-D) structure of protein molecules. These locations are known as active sites. For a successful protein-target interaction both protein and target must share the same characteristic frequency but have opposite phase. This corresponds to the fact that a peak in energy distribution periodicity of protein molecule must be matched with a corresponding trough in energy distribution periodicity of target molecule and vice-versa. This matching of energy distribution periodicity resembles resonance and hence characteristic frequency is said to provide resonant recognition model (RRM) [4]. Based on resonant recognition model we can predict whether a particular protein will interact with arbitrary target molecule by examining whether or not the protein and target share a common characteristic frequency. |
IV. ELECTRON ION INTERACTION POTENTIAL |
| Proteins are made of 20 amino acids and each amino acid is represented by a distinct alphabet, thus proteins can be represented by a character sequence. For the application of digital signal processing (DSP) to proteins, the protein character sequence needed to be mapped onto numerical sequences. The choice of numerals is base on some physical property that is relevant to biological function of amino acid. A successful attempt to assign numerical values to amino acid was made [12], where each amino acid is assigned a numerical value called its electron-ion interaction potential (EIIP). The electron-ion interaction potential of amino acid is physical property denoting the average energy of valence electrons in the amino acids and is known to co-relate well with proteins biological properties |
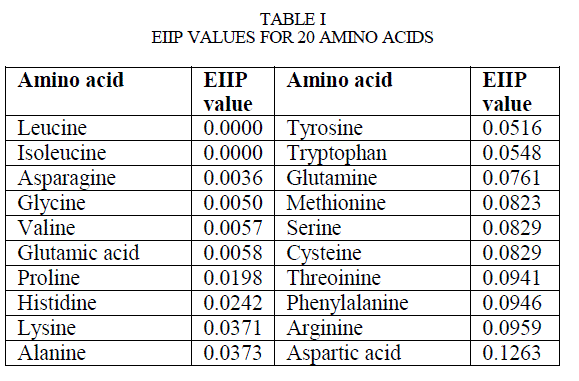 |
| The EIIP value for 20 different amino acid is listed in Table 1.Thus each and every amino acid in sequence can be represented by a unique number. Now digital signal processing algorithms or tools can be applied to the obtained numerical series. |
V. DETERMINATION OF CHARACTERISTIC FREQUENCY |
| Previous successful attempts have been made for determination of characteristic frequency using Discrete Fourier transform (DFT) [4-7] & Power spectral Density (PSD) [8-10]; here we propose a similar approach using chirp Z-transform. |
| The first step for determination of characteristic frequency is selecting a protein functional group of interest. The number of proteins in a functional group may vary from case to case, suppose that we have M number of protein sequence in a functional group. The common characteristic frequency of a functional group of M proteins can be determined by first calculating the chirp Z-transform of all M proteins individually and then multiplying them in order to obtain consensus spectrum of group. The consensus spectrum of group has a peak at characteristic frequency. The number of protein sequence M required for a typical consensus spectrum varies from case to case. A sufficient number of protein sequences should be used to achieve a distinct peak at characteristic frequency in the consensus spectrum. Initially a set of two proteins sequence may be tried. If there is an ambiguity (there are several similar peaks in consensus spectrum), then one or more protein sequence from functional group of interest may be included in computation of consensus spectrum. |
VI. ILLUSTRATIVE EXAMPLES |
| To demonstrate the power of proposed approach we show three distinct examples. We have chosen following protein sequences[13-14]: |
| (1) Cytochrome C proteins. |
| (2) Lysozyme proteins |
| Cytochrome C is a small heme protein found loosely associated with the inner membrane of mitochondrion. Cytochrome C is primarily known as electron carrying mitochondrial protein. The transition of cytochrome C between the ferrous and ferric state within the cell makes i t an efficient biological electrontransporter and it plays avital role in cellular oxidation in both plants and animals. It is generally regarded as universal catalyst of respiration forming an essential electron-bridge between the respirable substance and oxygen. |
| Lysozyme, enzyme found in secretions (tears) of lacrimal gland of animals and in nasal mucus, gastricsecretions, and egg white. Discovered in 1921 by SirAlaxander Fleming, lysozyme catalyze the breakdown of certain carbohydrates found in cell wall of certain bacteria (eg. colic). |
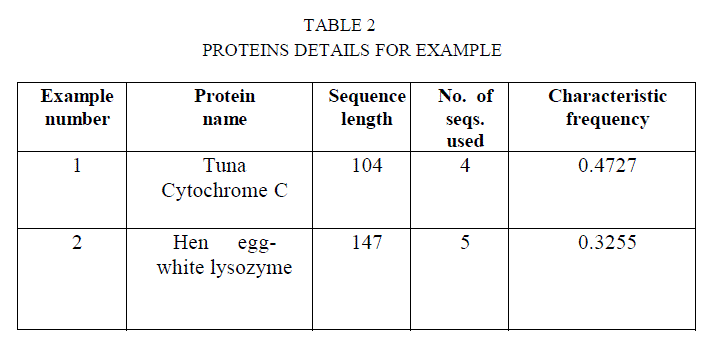
| We have used four protein sequences for cytochrome C and five proteins sequence for lysozyme. The preliminary details pertaining to protein examples are shown in table 2. |
VII. RESULTS & DISCUSSIONS |
| For each examples, the characteristic frequency was determined from the consensus spectrum of sufficiently large set of protein sequences belonging to same functional group as the protein sequence of interest. The number of proteins sequences used to determine characteristic frequency is shown in table 2. |
| A. Tuna Cytochrome C |
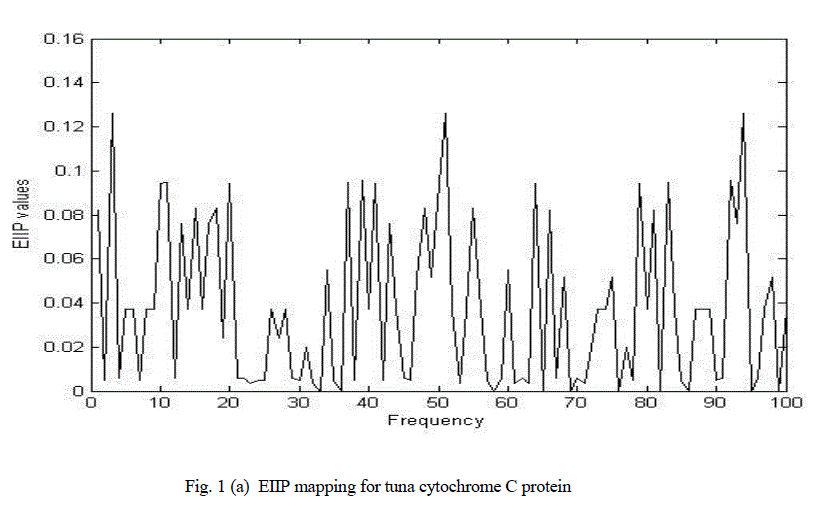
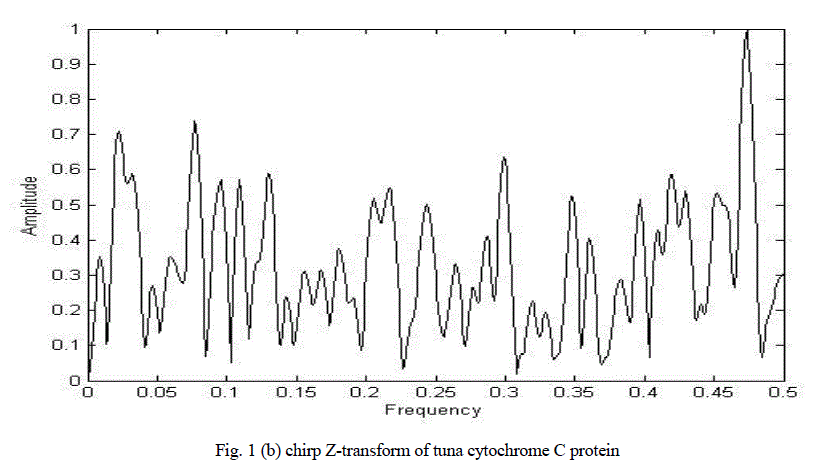
| Figure 1(a) shows the graphical representation of corresponding numerical sequences obtained by replacing each amino acid with its EIIP values for cytochrome C tuna heart protein. Figure 1(b) shows the chirp Z-transform of cytochrome C tuna heart protein. There are many peaks hence it is impossible to clearly determine characteristic frequency. |
| Figure 1(c) shows the consensus spectrum for cytochrome C functional group using chirp Z-transform approach (CZT). The distinct peak corresponds to characteristic frequency. |
 |
 |
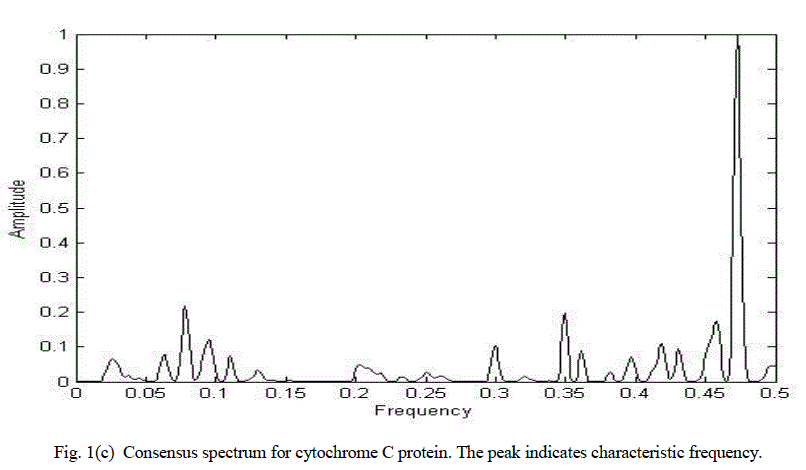 |
| Consensus spectrum of cytochrome C using chirp Z-transform. The distinct peak ccorresponds to characteristic frequency. |
 |
| B. Hen egg-white lysozyme |
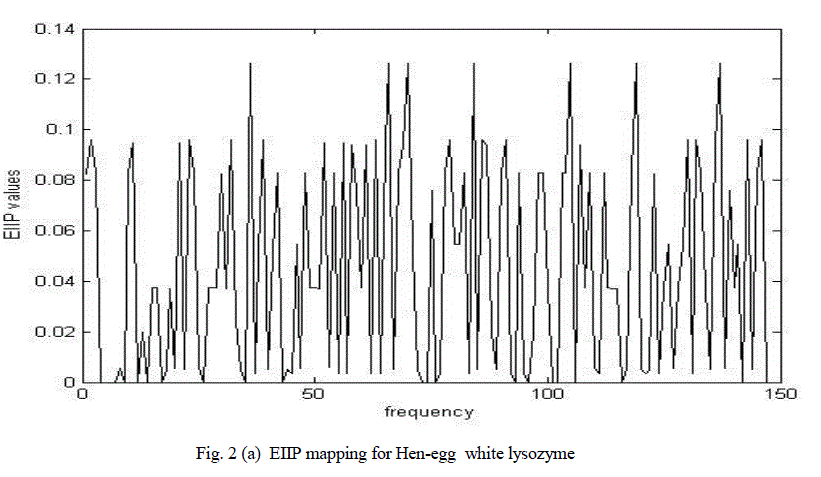
| Figure 2(a) shows the graphical representation of corresponding numerical sequences obtained by replacing each amino acid with its EIIP values for hen egg-white lysozyme. |
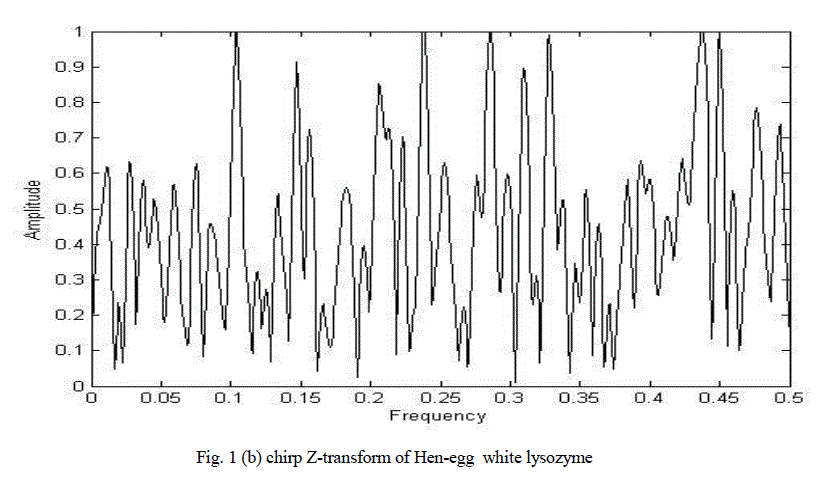
| Figure 2(b) shows the chirp Z-transform of hen egg-white lysozyme. There are many peaks hence it is impossible to clearly determine characteristic frequency. |
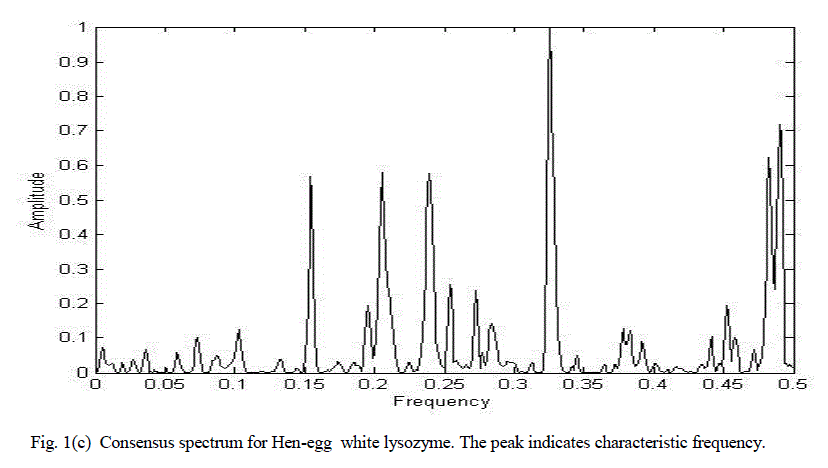
| Figure 2(c) shows the consensus spectrum for lysozyme functional group using chirp Z-transform. The distinct peak corresponds to characteristic frequency. |
 |
 |
 |
VIII. CONCLUSION |
| An approach for determination of characteristic frequency has been proposed using chirp Z-transform. A significant peak exists at characteristic frequency for biologically related protein sequence which can be obtained from consensus spectrum using a number of proteins sequences from same functional group. The peak corresponds to characteristic frequency and only one peak exists for a group of protein sequences sharing same biological functions. |
References |
|