ISSN ONLINE(2319-8753)PRINT(2347-6710)
ISSN ONLINE(2319-8753)PRINT(2347-6710)
Mithlesh Rajput1, Hinna Hamid2, Manjeet Aggarwal3, Rakesh Kumar Khandal4
|
| Related article at Pubmed, Scholar Google |
Visit for more related articles at International Journal of Innovative Research in Science, Engineering and Technology
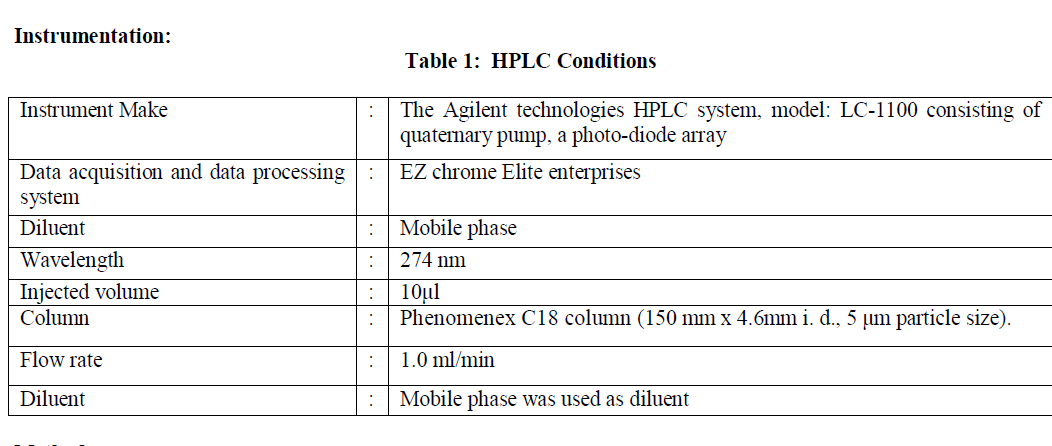
A simple, sensitive, accurate, HPLC-UV method has been developed for the simultaneous determination of etodolac and paracetamol in presence of their degradation products in tablet combined dosage formulation. Chromatographic separation was achieved successfully by using phenomenex C18 column (150 mm x 4.6 mm, i.d. 5 m particale size) with an optimized mobile phase of ACN:H2O:H3PO4 in the ratio of 500:500:0.25 (v/v/v) pH 3.0 with triethyamine. The mobile phase was run at a flow rate of 1 ml / minute under isocratic conditions with injection volume 10μl and the quantification of etodolac and paracetamol was carried out by UV detector at 274 nm based on peak area maeasurment. The reliability and performance of the proposed method were statistically validated with respect to system suitability, linearity, accuracy, precision (inter-day and intra-day), specificity, and robustness, limit of detection and limit of quantification. The method was found to be linear in the wide working range of 2 to 80μg/ml and 2.5-100μg/ml for both the analyte of interest with correlation coefficient 0.999 and 0.999 for etodolac and paracetamol respectively. The proposed method proved to be selective and suitable for indicating stability study for both etodolac and paracetamol in presence of any degradation product formed under different forced stress conditions (acidic, alkaline, oxidation, thermal and photolytic). The proposed validated method was successfully applied to the analysis of etodolac and paracetamol in their combined dosage form and thus can be routinely used for the simultaneous determination of etodolac and paracetamol when present in combined formulation.
Keywords |
| Etodolac, Paracetamol, UV-HPLC, Stability indicating method. |
INTRODUCTION |
| Etodolac is chemically (R, S) -2- (1, 8-Diethyl-4, 9-dihydro-3H-pyrano [3, 4-b] indol-1-yl) acetic acid. Its molecular weight and formula are C17H21NO3 and 287.35g/mol respectively [1]. Etodolac works by reducing the levels of prostaglandins, responsible for pain, fever and tenderness that occur with inflammation. Etodolac blocks the enzyme that makes prostaglandins (cyclooxygenase) thereby resulting into lower concentrations of prostaglandins. As a consequence, inflammation, pain and fever are reduced [2] [3].Various methods have been reported for determination of etodolac drug formulations and in biological samples. Reported methods are based on spectrophotometry method [4] [5] HPLC with UV detection [6], HPLC with mass spectrometric detection [7] for the determination of etodolac. |
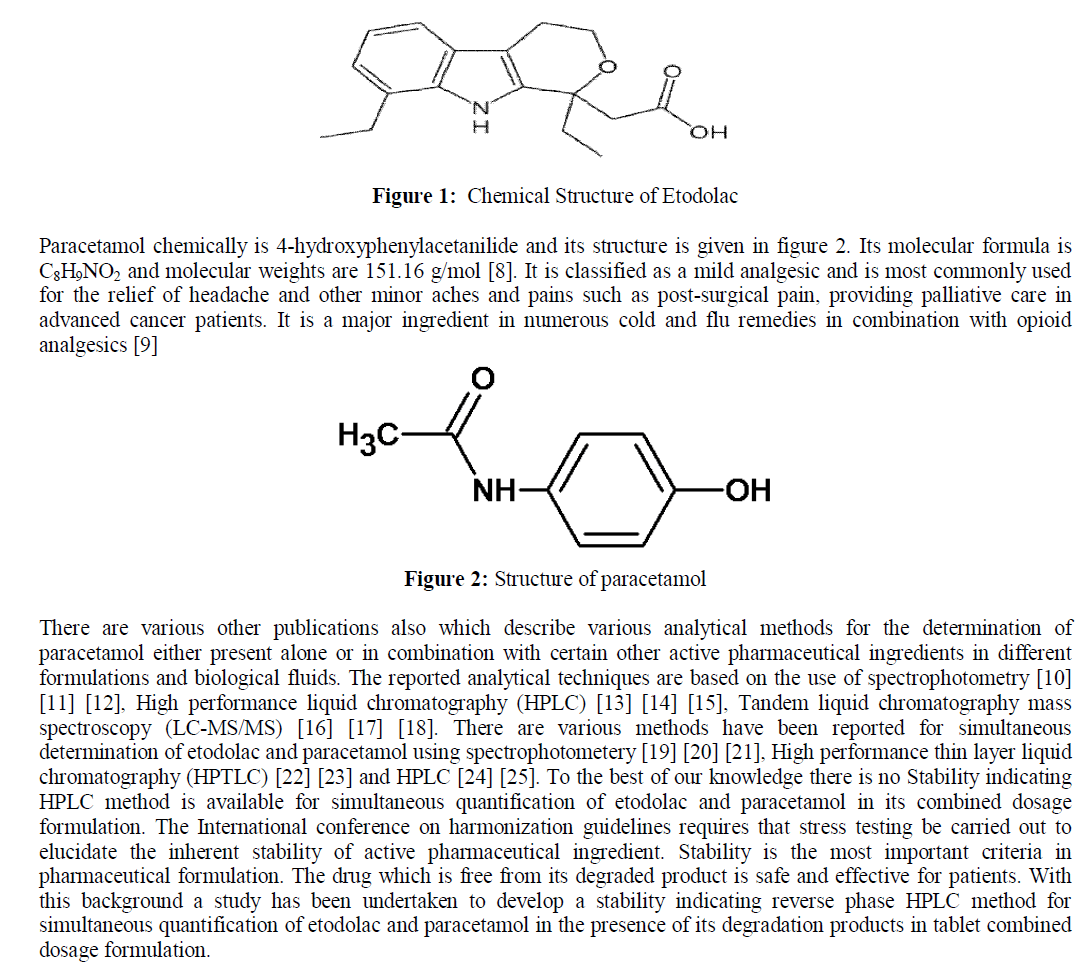 |
MATERIALS & METHODS |
| Chemical and reagents: |
| Etodolac (Make:Fluka), Paracetamol (Make:Fluka), Marketed formulation of tablet containing 400 mg etodolac and 500 mg paracetamol (Make:orthokind), Acetonitrile (HPLC-grade, Make:Rankem),Water (HPLC-grade, Make:Rankem), Methanol (HPLC-grade, Make:Spectrochem), Orthophosphoric acid (AR-grade, Make:Rankem), Hydrochloric acid, (AR-grade, Make:Rankem), Sodium hydroxide pellets (AR-grade, Make:Rankem) and Hydrogen peroxide solution (AR-grade, Make:Rankem). |
 |
| Methods: |
| (A) Preparation of Mobile Phase: The mobile phase was prepared by mixing of acetonitrile, water and orthophosphoric acid in the ratio of 500:500:0.25 (v/v/v). The pH of the mobile phase was set to 3.0 by using triethylmine. Mobile phase was filtered through a 0.45μm nylon membrane filter. |
| (B) Standard solution preparation: |
| Solution –A: Etodolac standard stock solution containing 400 μg/ml was prepared in a 100 ml volumetric flask taking 40.7 mg of etodolac in 20 ml of mobile phase in the flask. This solution was shaken for 10 minutes and made to volume with mobile phase (final concentration is of 400.7 μg/ml). |
| Solution –B: Paracetamol stock solution containing 500 μg/ml was prepared in a 100 ml volumetric flask taking 50.7 mg of paracetamol in 20 ml of mobile phase in the flask. This solution was shaken for 10 minutes and made to volume with mobile phase (final concentration is of 500.7 μg/ml). |
| Solution –C: 10 ml of each of solution A and solution B were pipetted in 100 ml volumetric flask and made to the volume using mobile phase. This gave combined standard working solution of etodolac and paracetamol each having concentration of 40μg/ml of etodolac and 50 μg/ml of paracetamol respectively. 10 μL of the standard solution C was injected in to the HPLC. |
| (C) Sample analysis: |
| Twenty tablets of sample were weighed in order to calculate average weight of the tablet and then finely powdered. An accurate weight of the powder equivalent to 40 mg of etodolac and 50 mg of paracetamol was weighed and transferred to 100 ml volumetric flask to which 20 ml of diluents was added. This solution was shaken and sonicated for 15 minutes, and made to volume with diluent to 100 ml (sample stock solution). A 10 ml aliquot of this solution was further accurately pipette into 100 ml volumetric flask and diluted to volume with mobile phase. This gave combined test solution of etodolac and paracetamol each having concentration of approximately 40 μg/ml of etodolac and 50 μg/ml of paracetamol respectively. |
| (D) Forced degradation study of the sample was carried out under following conditions: |
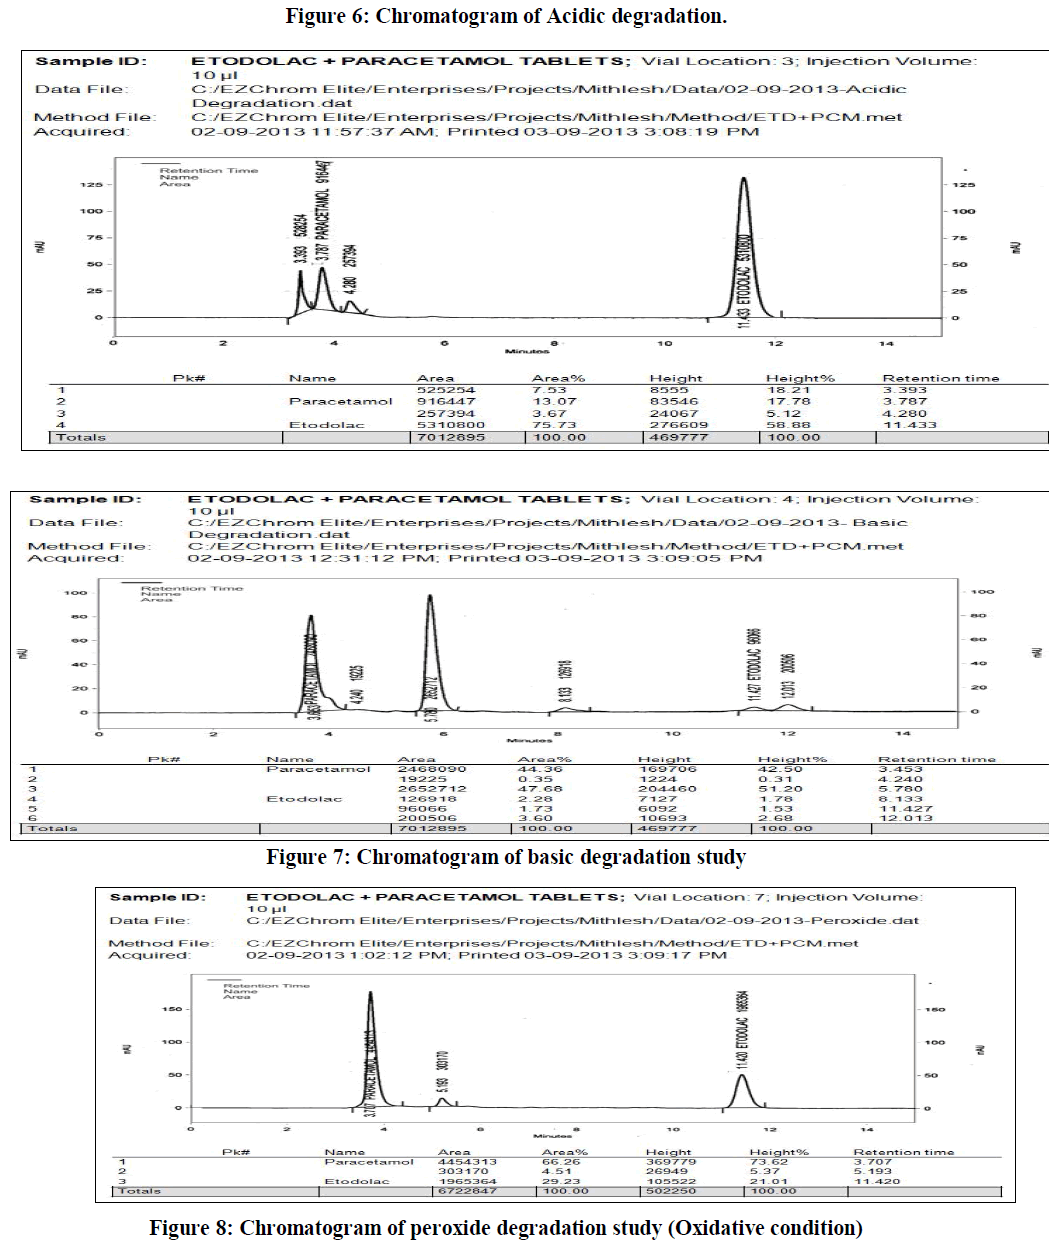
| a) Acidic conditions: To study the effect of acidic degradation 5 ml of sample stock solution was taken into 50 ml empty volumetric flask and 5 ml 0.1M HCl solution to this flask and heating on a water bath at temperature 600C for approximately six hours. This solution was left to reach ambient temperature, neutralized to pH 7 by addition of 5 ml of 0.1 M NaOH, further diluted to 100 ml with diluent. The final concentration of this resulted test solution was 40 μg/ml of etodolac and 50 μg/ml of paracetamol respectively. |
| b) Alkaline conditions: To study the effect of basic degradation 5 ml of sample stock solution was taken into 50 ml empty volumetric flask and 5 ml 0.1M NaOH solution to this flask and heating on water bath at a temperature 600C for approximately six hours. This solution was left to reach ambient temperature, neutralized to pH 7 by addition of 5 ml of 0.1 M HCL, further diluted to 100 ml with diluents. The final concentration of this resulted test solution is 40 μg/ml of etodolac and 50 μg/ml of paracetamol respectively |
| c) Oxidative condition : : Oxidative degradation study was performed by refluxing the 5 ml of sample stock solution with 10 % hydrogen peroxide at 600 C for 1 hr. Solution was allowed to cool at room temperature and further diluted with dilutent to 50 ml. The final concentration of this resulted test solution was 40 μg/ml of etodolac and 50 μg/ml of paracetamol respectively. |
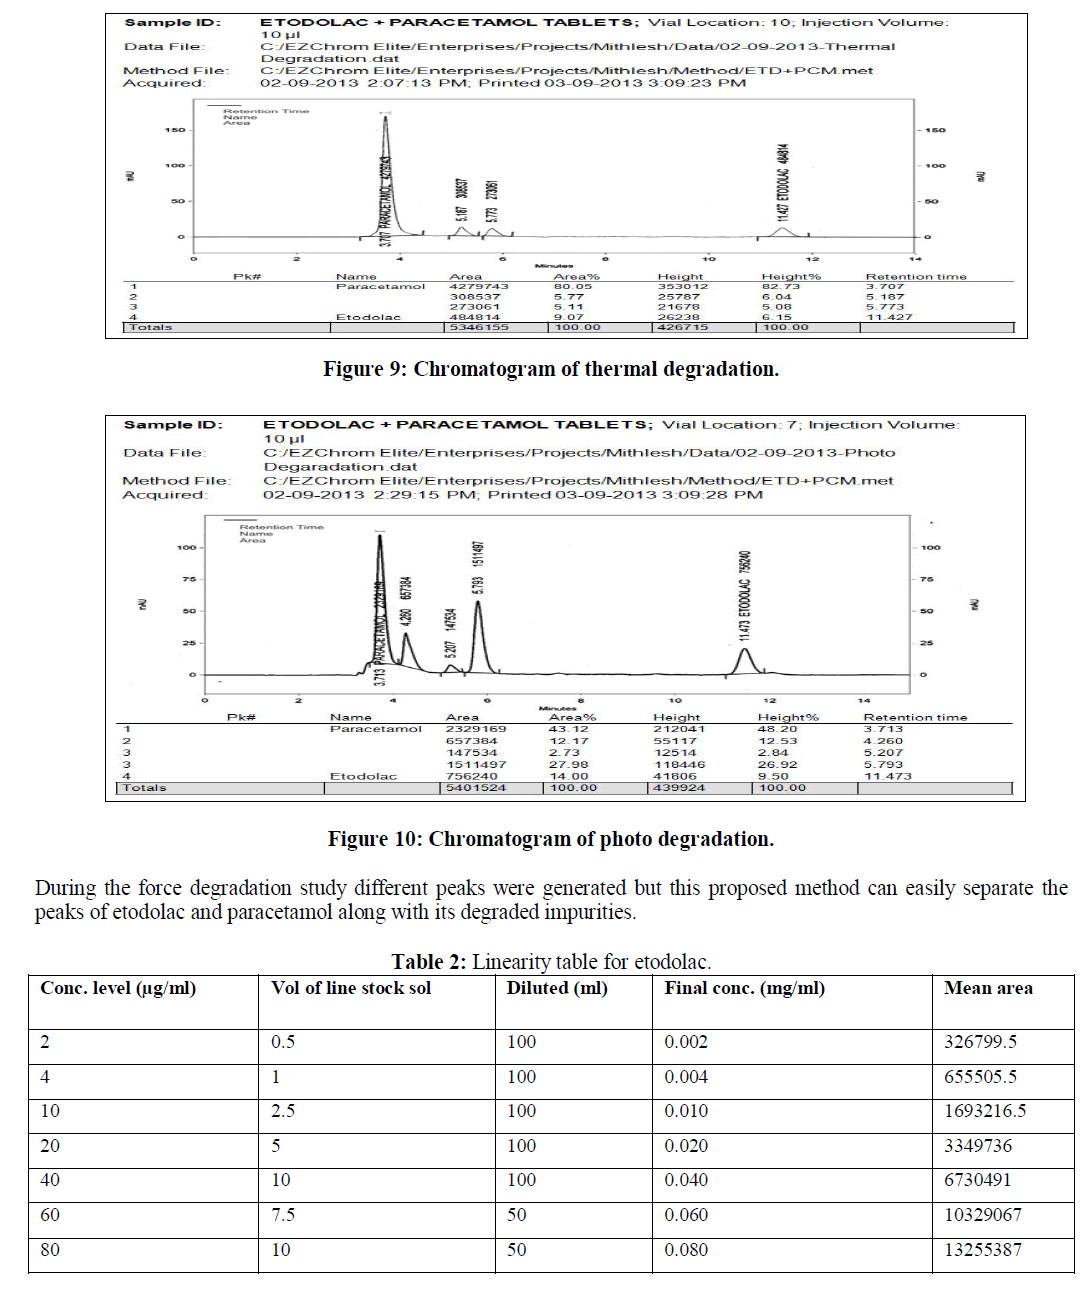
| d) Thermal condition: Thermal degradation was performed by exposing the intact tablet formulations at 80 °C for 72 hours. Then tablets were crushed in order to obtain fine powder and weight equivalent to 40 mg of etodolac and 50 mg of paracetamol was taken in to 100 ml of volumetric flask. 10 ml of diluent was added in to flask and sonicated for 15 minutes and further diluted with diluents this sample solution gave final concentration of 400 μg/ml and 500 μg/ml etodolac and paracetamol. This sample was further diluted to obtain final concentration of 40 μg/ml and 50 μg/ml etodolac and paracetamol. |
| e) Photolytic condition: Photolytic degradation was performed by exposing the intact tablet formulations to UV –light for 48 hours and these tablets were crushed in order to obtain fine powder. Then the weight equivalent to 40 mg of etodolac was weighed and taken into 100 ml of volumetric flask. 10 ml of diluent was added into flask and sonicated for 15 minutes and then further diluted with diluents this solution gave final concentration of 400 μg/ml and 500 μg/ml etodolac and paracetamol. This sample was further diluted to obtain final concentration of 40 μg/ml and 50 μg/ml etodolac and paracetamol. The sample solution and degradation sample solution was then filtered through syringe using 0.45 mm membrane filter. 10μL of this sample solution was injected in to the HPLC. Calculation was based on the peak area ratio in the standard chromatogram and peak area in test chromatogram |
CALCULATIONS |
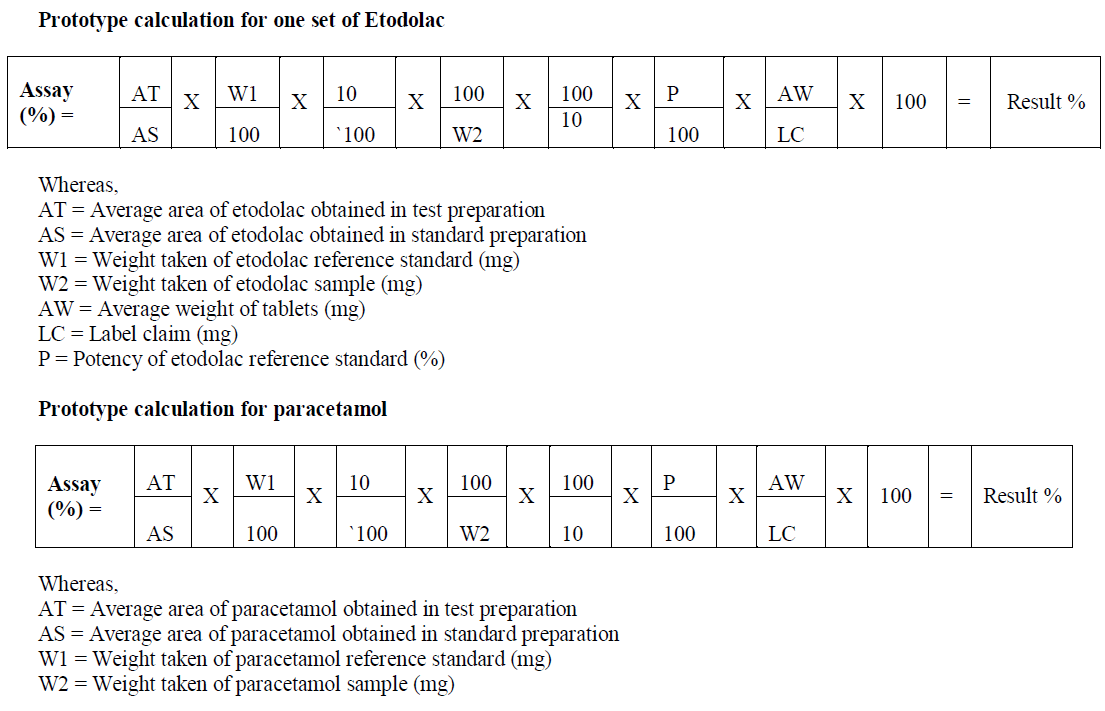 |
| AW = Average weight of tablets (mg) |
| LC = Label claim (mg) |
| P = Potency of paracetamol reference standard (%) |
METHOD VALIDATION |
| Specificity and Selectivity: The specificity of the method was checked by injecting blank solution and sample Solution There was no interference from blank on the retention time of analyte peak. To prove this method a stability indicating, force degradation study was also performed. |
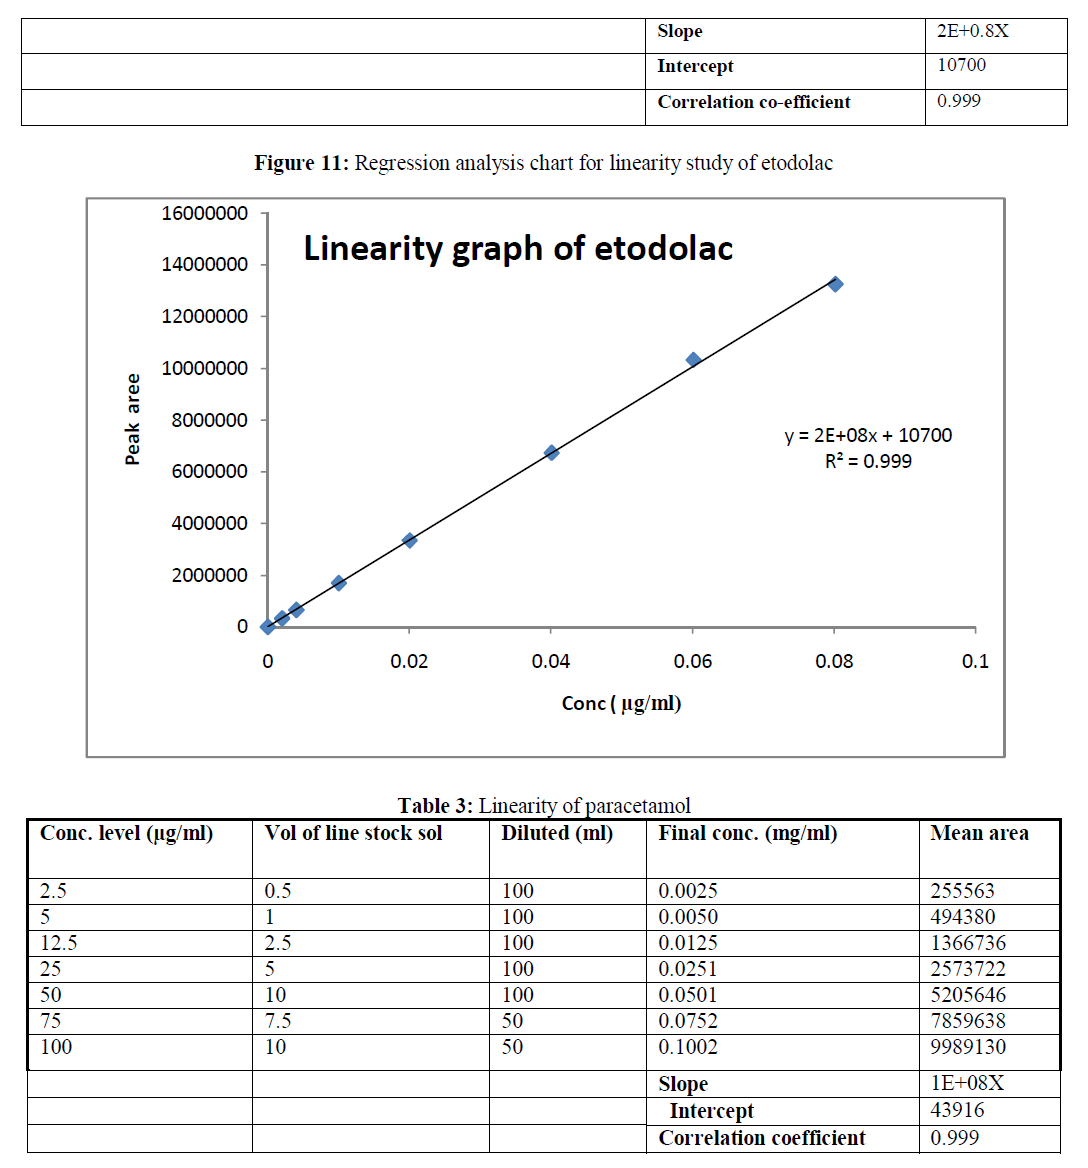
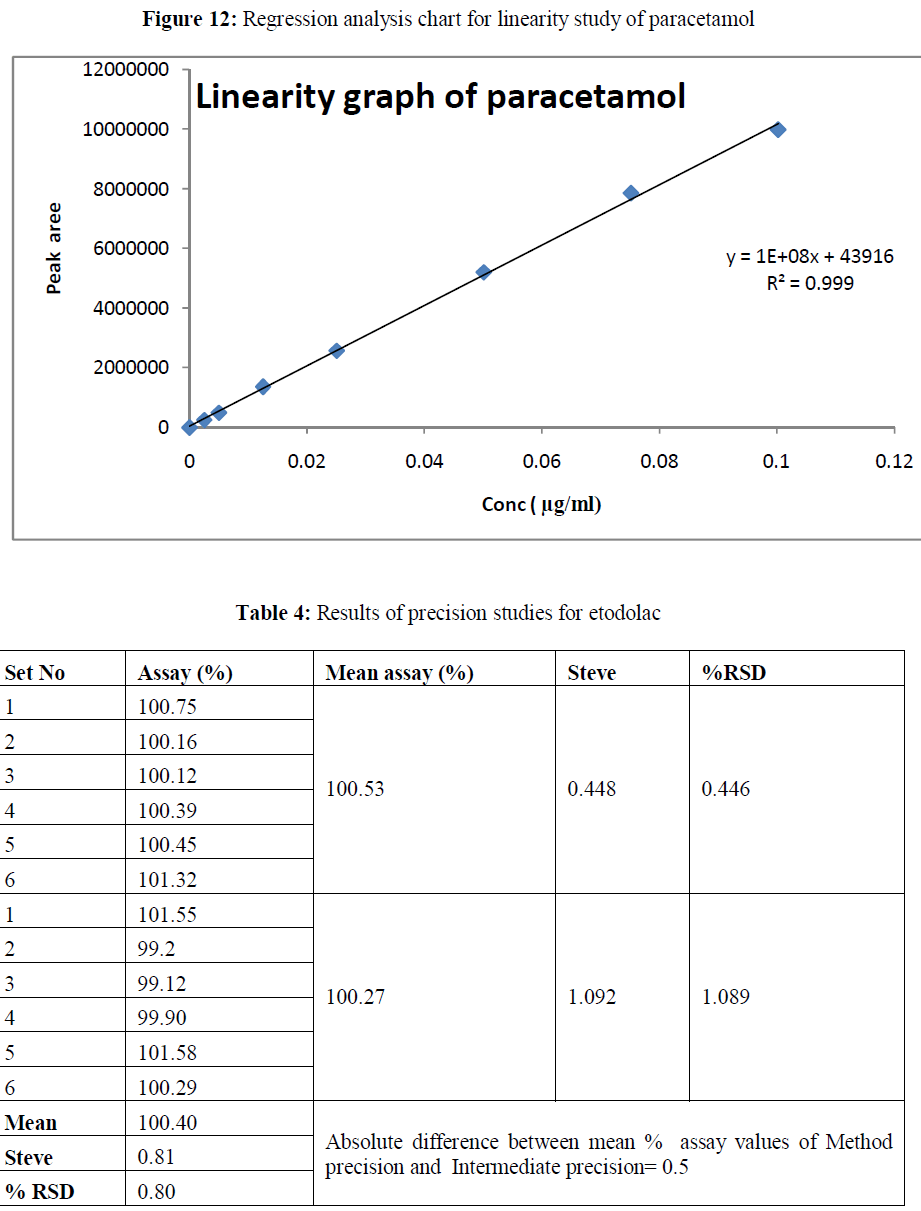
| Linearity: The method showed linear in the concentration range of 2 μg/ml to 80 μg/ml and 2.5-100 μg/ml for etodolac and paracetamol respectively. The correlation coefficient was found 0.999 for the drugs. The results are shown in table 2-3. |
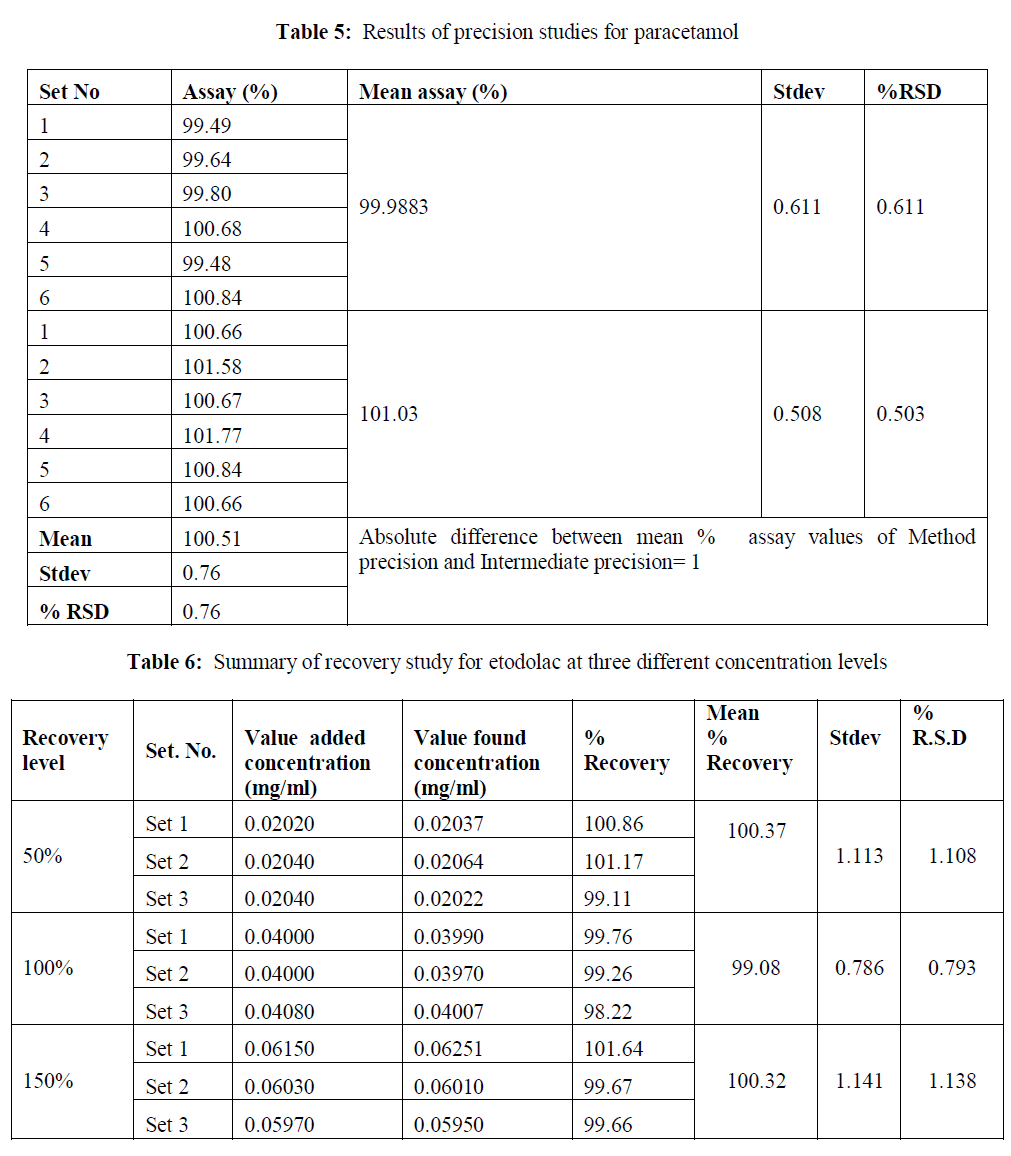
| Precision: The method precision and intermediated precession were calculated. The results were within the limits. The results of the method precision and intermediate precision were shown in table 4-5. |
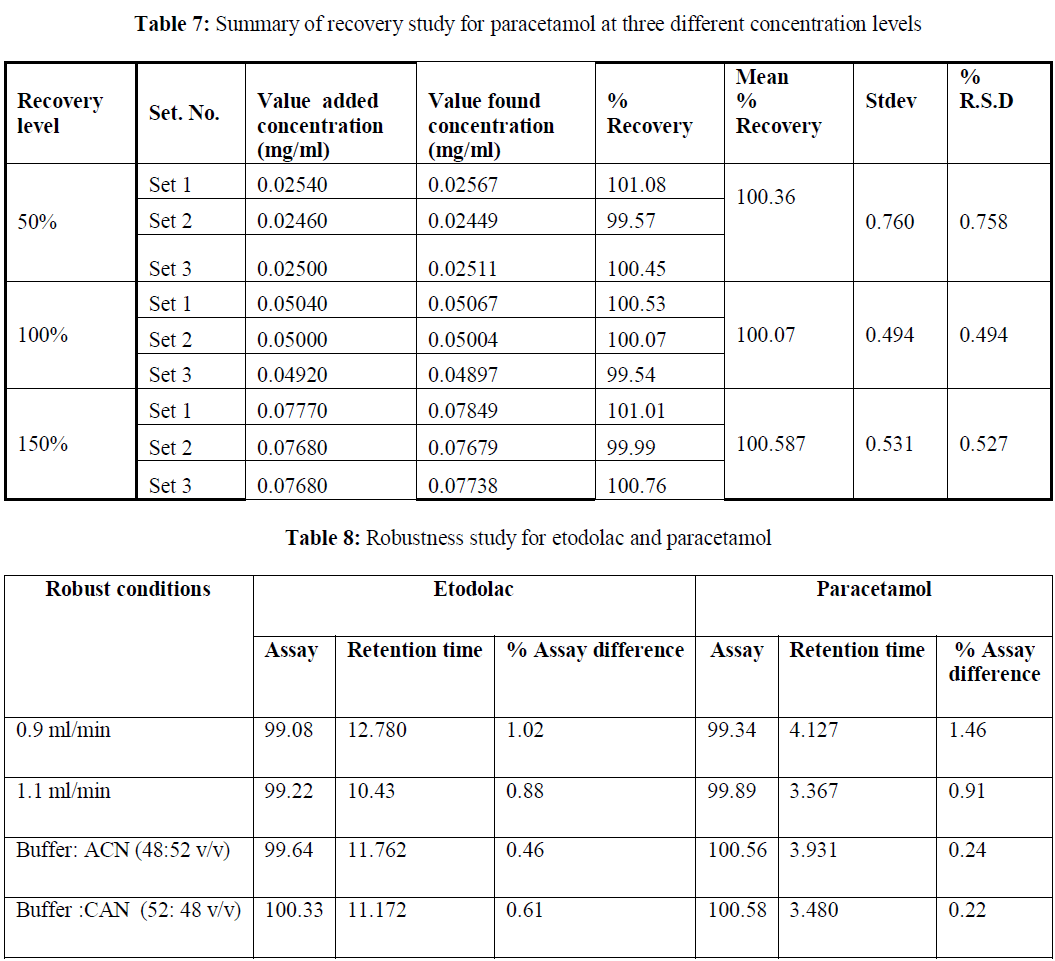
| Accuracy: The accuracy of the method was determined by adding known amount of etodolac and paracetamol corresponding to three concentration levels of 50%, 100%, and 200% of analytes concentration. The accuracy was calculated by amount of analytes added and amount of analytes found. This gives the percentage of analyte recovered by the assay method. Based on our results that the method is highly accurate. The accuracy results are shown in table6- 7. |
| Robustness of the method: Changing with the flow rate (±0.1mL/min), and mobile phase composition. No change in assay result % was observed. The results of the robustness results are shown in table 8. |
| LOD and LOQ: Limit of detection of method is 0.2 μg/ml and 0.25 μg/ml for etodolac and paracetamol respectively and limit of quantification is 0.4 μg/ml for etodolac and for paracetamol 0.5 μg/ml. |
EXPERIMENTAL RESULTS |
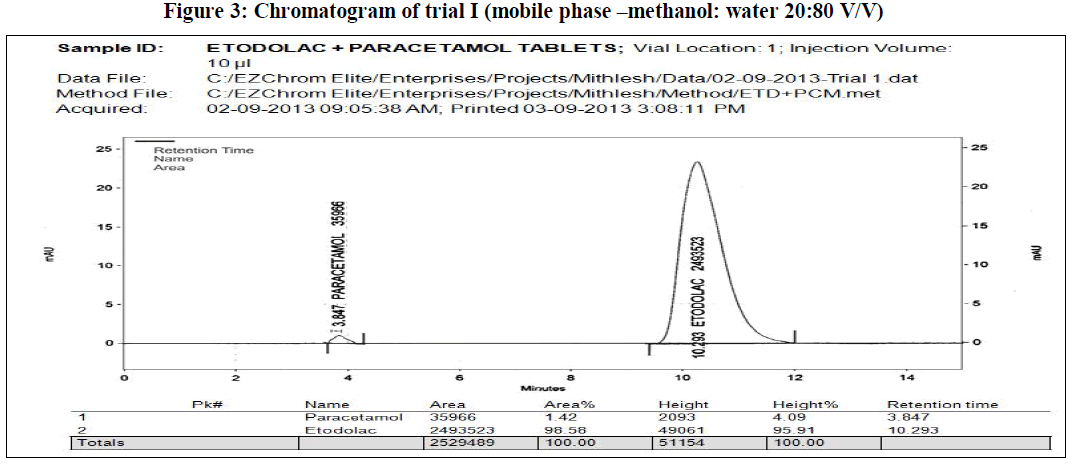
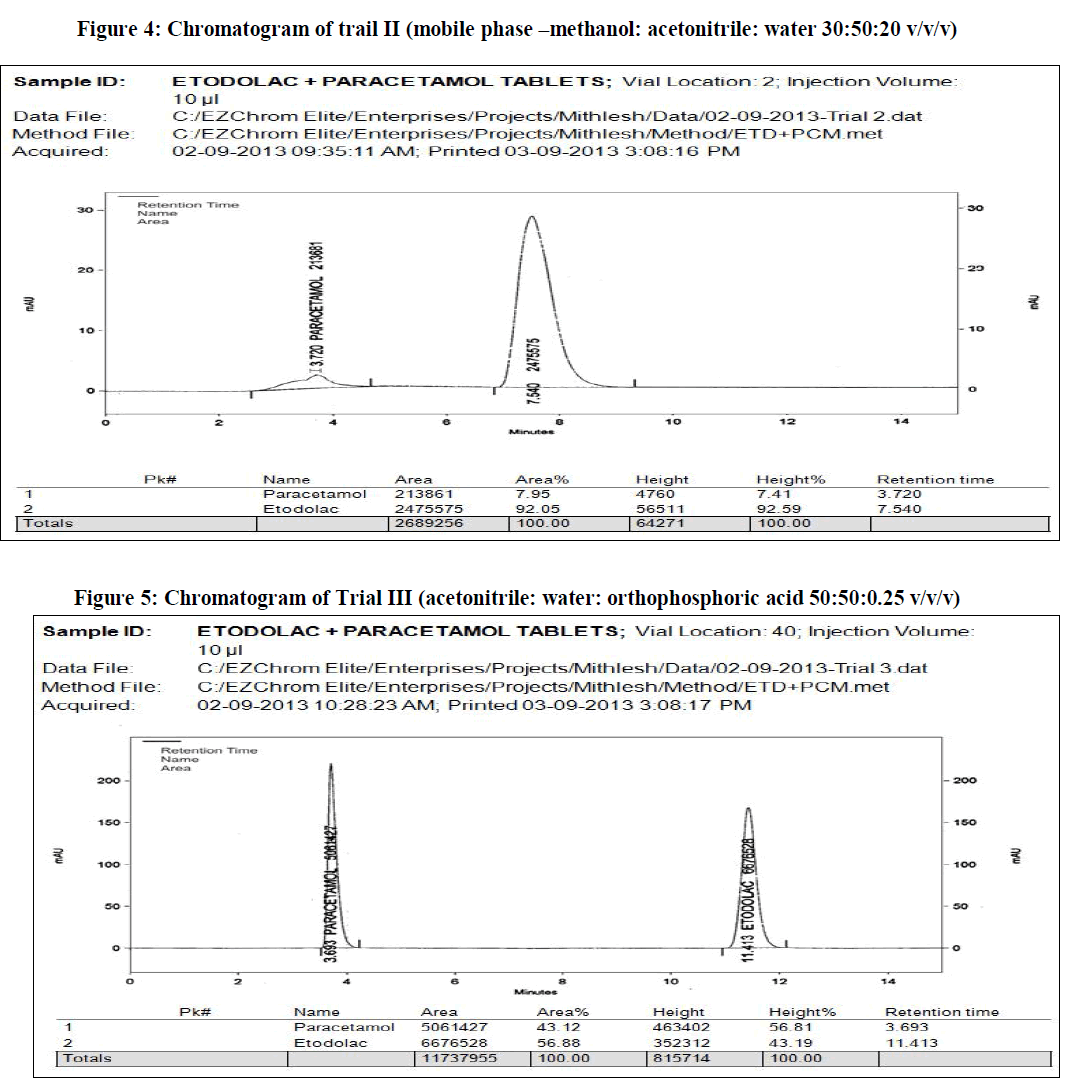
| In the present work, an analytical method is based on LC method using UV detector, the analytical conditions were selected, keeping in mind the different chemical nature of etodolac and paracetamol. The development trials were performed by using original standard preparation with different mobile phases. Trial 3 is final mobile phase for validation study. |
 |
 |
 |
 |
 |
 |
 |
 |
CONCLUSION |
| The reverse phase HPLC has been developed and validated for simultaneous quantification of etodolac and paracetamol in its tablet formulation. Accuracy of the method was confirmed from the results obtained at different concentration levels. Reliability and precision of the proposed method was also confirmed from method precision and intraday studies. The results obtained from various validation studies conclude that the developed reverse phase HPLC method is simple, accurate, precise, selective and reliable for the simultaneous determination of assay of etodolac and paracetamol in their combined pharmaceutical dosage form. Significant advantage concluded from the study that reported method can not only separate paracetamol and etodolac but also peaks with its major degraded impurities generated during five different types of force degradation conditions. Thus, the proposed method can be used for the routine analysis, quality control check and for checking the quality of etodolac and paracetamol during stability in their preparation in combined dosage formulation |
References |
|