ISSN ONLINE(2319-8753)PRINT(2347-6710)
ISSN ONLINE(2319-8753)PRINT(2347-6710)
Valanarasi Antony Santiagu Vaz
|
| Related article at Pubmed, Scholar Google |
Visit for more related articles at International Journal of Innovative Research in Science, Engineering and Technology
Disorder in thyroid gland is one of the most common diseases. More than one third of population even children is found to have at least one thyroid nodule disorder during their lifetime. Thyroid detection test is usually done by two methods; invasive and non-invasive. Invasive methods like Thyroid Function Tests (TFTs), biopsy is traumatic methods and non-invasive methods like ultrasound and x-rays should not be used many times. TFTs are a collective term for blood tests used to check the function of the thyroid. TFTs may be requested if a patient is thought to suffer from hyperthyroidism or hypothyroidism. Thermal Imaging is a technology that creates and analyses image by detecting the heat radiating from an object. A hyperactive thyroid gland is a centre of increased blood flow and chemical activity, so it is a center of heat production that can be detected by thermal sensing. Temperature can be sensed using thermal camera with thermal sensitivity of 0.10C with temperature range -200C to +1200C. This paper gives a survey of the methods used for the diagnosis of thyroid disorder and classification using MLPN.
Keywords |
| Thermography, Thermal imaging, thyroid gland, Thyroid Function Tests(TFT), hyperactive, MLPN |
I. INTRODUCTION |
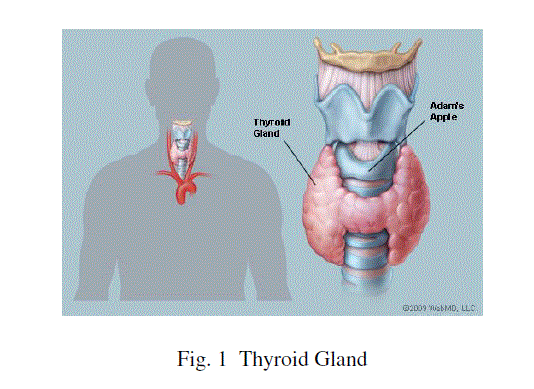
| The thyroid is a butterfly-shaped gland that sits low on the front of the neck. The thyroid has two side lobes, connected by a bridge (isthmus) in the middle, shown in Fig 1. When the thyroid is its normal size, it is Brownish-red in color, rich with blood vessels. Nerves important for voice quality also pass through the thyroid. A normal adult thyroid gland weighs 10 to 20 g and receives blood from bilateral superior and inferior thyroid arteries and a small artery called the thyroidima. The thyroid secretes two hormones. Thyroxine (T4) makes about 90% of hormone production, and triiodothyronine (T3) produces the other 10%. Peripheral tissues convert T4 to T3, and most of T3 is derived from T4. Thyroid hormone secretion is regulated by the hypothalamo-pituitary-thyroid axis through stimulatory actions of TRH and TSH. |
 |
| Thyroid hormones are transported in serum bound to carrier proteins (0.03%-0.04% of T4 and 0.3%-0.4% of T3 are free hormone). Thyroid hormone binding globulin (TBG) is the main carrier, accounting for 75% of bound T4 and almost all of bound T3. Thyroxin binding pre-albumin and albumin are responsible for the rest. Most thyroid hormone actions (metabolic and developmental) are mediated via nuclear receptors through gene expression regulation. Thyroid hormone receptors are found in most of the body tissues. T3 is biologically much more active than T4. Thyroid hormones increase the basal metabolic rate by stimulating catabolic and anabolic reactions in the metabolism of carbohydrates, fat, and proteins and by stimulating thermogenesis. Thyroid hormone deficiency during embryonic development leads to cretinism and dwarfism (congenital myxedema). |
| There are four main types of thyroid disease: hyperthyroidism ( too much thyroid hormone ), hypothyroidism (too little thyroid hormone ), benign (noncancerous) thyroid disease and thyroid cancer(malignant). The signs and symptoms of hypothyroidism includes tiredness, mental fogginess and absent-mindedness, feeling unreasonably cold, constipation, dry skin, fluid retention, nonspecific aches and stiffness in muscles and joints, excessive or prolonged menstrual bleeding (menorrhagia), and depression. Hyperthyroidism is suggested by a number of signs and symptoms. People with mild hyperthyroidism or those older than 70 years of age usually experience no symptoms. Common signs of hyperthyroidism include excessive sweltering, heat intolerance, increased bowel movements, tremor (usually a fine shake), uneasiness; agitation, rapid heart rate, weight loss, weariness, decreased focus, and irregular and scant menstrual flow. The two most important thyroid hormones are thyroxine (T4) and triidothyronine(T3), representing 99.9% and 0.1% of thyroid hormones respectively. The hormone with the most biological power is actually T3. Once released from the thyroid gland into the blood, a large amount of T4 is converted to T3 - the active hormone that affects the metabolism of cells throughout our body. The thyroid itself is regulated by another gland located in the brain, called the pituitary. The pituitary is regulated in part by the thyroid by another gland called the hypothalamus. The hypothalamus releases a hormone called thyrotropin releasing hormone (TRH), which sends a signal to the pituitary to release thyroid stimulating hormone (TSH). In turn, TSH sends a signal to the thyroid to release thyroid hormones. If over activity of any of these three glands occurs, an extreme amount of thyroid hormones can be produced, thereby resulting in hyperthyroidism. Similarly, if under activity of any of these glands occurs, a insufficiency of thyroid hormones can result, causing hypothyroidism. The hormone chain is represented as Hypothalamus – TRH, Pituitary- TSH, Thyroid - T4 and T3. |
| The measurement of thyroid hormone levels is often used by doctors as a screening test. If TSH is abnormal, decreased levels of thyroid hormones T4 and T3 may be present. To differentiate between different types of hypothyroidism, a specific test may be used. Thyroid-releasing hormone (TRH) is injected into the body through a vein. This hormone is naturally secreted by the hypothalamus and stimulates the pituitary gland. The pituitary responds by releasing thyroid - stimulating hormone (TSH ). Nodules of the thyroid may or may not be cancer. Medical ultrasonography can help determine their nature because some of the characteristics of benign and malignant nodules differ. Ultrasonography is not always able to separate benign from malignant nodules with complete certainty. In suspicious cases, a tissue sample is often obtained by biopsy for microscopic examination. Thyroid scintigraphy, imaging of the thyroid with the aid of radioactive iodine, usually iodine -123, is performed in the nuclear medicine department of a hospital or clinic. Radioiodine collects in the thyroid gland before being excreted in the urine. While in the thyroid the radioactive emissions can be detected by a camera, producing a rough image of the shape (a radiodine scan) and tissue activity (a radioiodine uptake) of the thyroid gland. A normal radioiodine scan shows even uptake and activity throughout the gland. Irregularity can reflect an abnormally shaped or abnormally located gland, or it can indicate that a portion of the gland is overactive or under active, different from the rest. |
| In contrast, finding that a substantial section of the thyroid is inactive ("cold") may indicate an area of non-functioning tissue such as thyroid cancer. The amount of radioactivity can be counted as an indicator of the metabolic activity of the gland. A normal quantitation of radioiodine uptake demonstrates that about 8 to 35% of the administered dose can be detected in the thyroid 24 hours later. Over activity or under activity of the gland as may occur with hypothyroidism or hyperthyroidism is usually reflected in decreased or increased radioiodine uptake. Different patterns may occur with different causes of hypo- or hyperthyroidism. Thyroid tissue may be obtained for biopsy by fine needle aspiration or by surgery.. The accuracy of the diagnosis depends on obtaining tissue from all of the suspicious areas of an abnormal thyroid gland. |
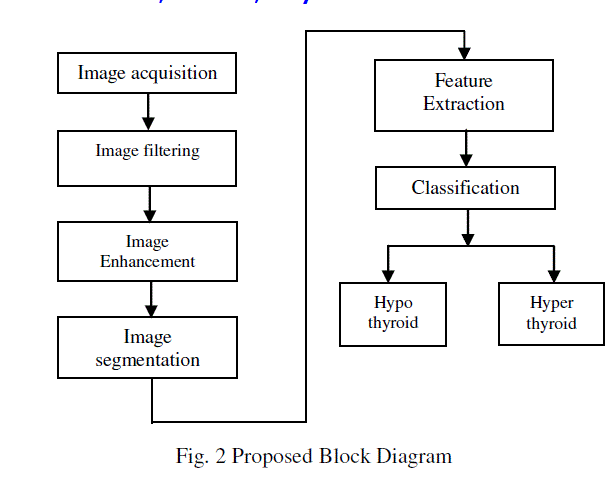
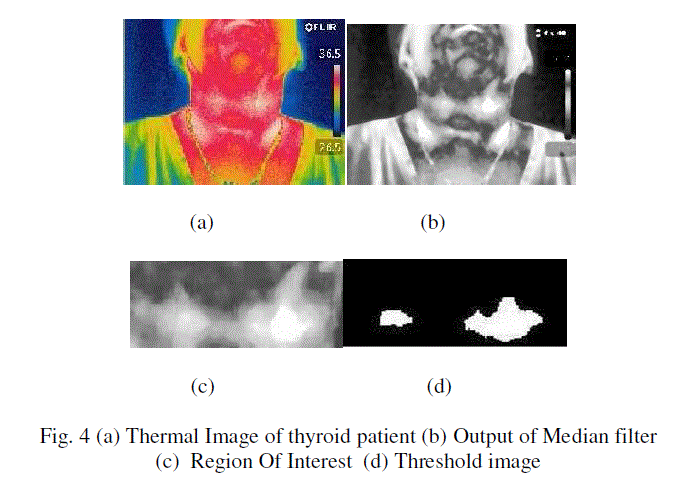
| In this paper the colored thermal images of neck of thyroid and normal persons are used as training and testing images. The images can be captured by using thermal camera FLIR-E30. In this paper the images used are publically available. Noise is removed using median filter and enhanced by using histogram equalization. Then its segmented using modified Otsu thresholding technique. ROI is extracted manually wiith a size of M x M from the probable thyroid region. Gabor filters and GLCM is used to extract the features from the selected ROI and these features are applied to MLPN Classifier to classify as hypo and hyper thyroid. The rest of this paper is structured as follows. Section II gives block illustration of proposed system. Section III gives the experiment results and conclusions are given in Section IV. Section V presents conclusion |
II. RELATED WORKS |
| In recent years, various works are done for the diagnosis of Hypo and Hyper thyroid diseases using image processing. These algorithms use various kinds of images such as USG, SPECT images and planar scintigraphy. |
| Nikita Singh et al. [10] have proposed classification using SVM, KNN and Bayesian and also provide a lot of information about segmentation and classification methods that are very important for medical image processing. They provide features of malignant nodules in thyroid gland and a comparative study was done. The results show that SVM gives much better accuracy than KNN and Bayesian classifiers |
| NasrulHumaimiMahmood and Akmal [11] had presented a simple guide of determine the thyroid lobes in the thyroid ultrasound image using a MATLAB. The image is done contrast enhancement to suppress speckle noise. The enhancement image is used for further processing of segmentation the thyroid region by local region-based active contour. The thyroid region is segmented into two parts, which are right and left with the active contour method separately. Thyroid ultrasound image of transverse view is used in this study. Therefore, the measurements only involve the width, depth and area of the thyroid region. The result of thyroid measurement is successfully calculated in pixel unit. The proposed method is benefited to enhance the image and segmentation the thyroid lobe. |
| AnupamShukla et al. [12], in 2009, had presented the diagnosis of thyroid disorders using Artificial Neural Networks (ANN). Feed forward neural network had been trained using Back propagation algorithm (BPA), RBF neural network and Learning Vector Quantization (LVQ) neural network. Authors concluded that LVQ network have the best accuracy which is λ8% because it doesn’t have a problem of getting trapped in local minima like BP network and doesn’t require a very good coverage of input space , as required by Radial Basis functions used in RBF networks. |
| Chang et al. [13], in their investigation devised a novel algorithm for automatic diagnosis of Graves’ disease in USG images. In this method, automatic segmentation of thyroid USG image had been done. Compensation is used to enhance the image. Haar wavelet, homogeneity, blocks difference of inverse probability and normalized multi-scale intensity difference features are extracted. Block classification using RBFNN had been applied to classify the block as thyroid region and non-thyroid region. Segmented thyroid is further inspected for Graves’ disease using artifact compensation and mid-point filtering. Blood test results take weeks to obtain inspection results. |
III. PROPOSED METHOD |
| Fig. 2 shows the proposed method followed in this paper. First the coloured images of neck of thyroid patients are taken by using thermal camer, filtered those images by median filter, enhanced using Histogram equalization. Then segmentation of the images is done by using modified Otsu Thresholding technique. Features were then extracted and classified by MLPN Classifier. |
 |
| A. THERMOGRAPHIC CAMERA SYSTEM |
| Thermal Imaging system forms an image using Infrared radiation and operates in wavelengths as long as 14,000 nm (14 μm). This kind of image formation has been a very successful diagnostic tool in the field of medicine. The entry of infrared imaging has led to reduction of more invasive procedures for diagnosis. This has been a boon to both patients and doctors in diagnosing diseases well in advance. |
| The principle on which Infrared Imaging works is very simple. As the temperature increases, the amount of radiation emitted by an object also increases. This imaging helps us to see the variations in temperature. Warm areas appear prominent against cooler backgrounds. Generally, any disease in human body is accompanied by inflammation which is actually the protective mechanism of the body. During inflammation vascular increases in the affected area and this in turn leads to increase in temperature. The increased temperature is utilized by Infrared Imaging for identifying the disturbance in the normal physiological process. |
| The Digital Infrared camera produces high-resolution thermal images that are very essential for diagnosis. Correct and early diagnosis of diseases helps in early and perfect treatment. Infrared Imaging helps a practitioner in curbing a disease in its early stage and also helps in preventing the spread of the same to other parts of the body and to the lymph nodes. To take maximum advantage from Infrared Imaging we must be aware that it is safe and accurate. It involves no radiation or invasive procedures. It can diagnose diseases earlier than other diagnostic tools. |
| B. IMAGE FILTERING |
| Normally filters are used to remove noise from images. Filters are classified into two types, Linear Filters and Nonlinear Filters. Linear filters too tend to blur sharp edges, destroy lines and other fine image details, and perform poorly in the presence of signal-dependent noise. With non-linear filters, the noise is removed without any attempts to explicitly identify it. The median filter was one of the most popular nonlinear filters for removing Salt & Pepper noise. The noise is removed by replacing the window center value by the median value of centerneighborhood. The pattern of neighbors is called the window, which slides, pixel by pixel over the entire image. The median is calculated by first sorting all the pixel values from the window into numerical order, and then replacing the pixel being considered with the middle (median) pixel value. The input pixel is replaced by the median of the pixels contained in a window around the pixel. |
| V (m, n) = median(y (m-k, n-l), (k, l) W) (1) |
| Where, W is suitably chosen window. The algorithm for median filtering requires arranging the pixel values in the window in increasing or decreasing order and picking the middle value. |
| C. IMAGE ENHANCEMENT |
| Image enhancement refers to accentuation, or sharpening, of image feature such as edge boundaries or contrast to make a graphic display more useful for display and analysis [4]. Histogram modeling techniques provide a sophisticated method for modifying the dynamic range and contrast of an image by altering that image such that its intensity histogram has a desired shape. Unlike contraststretching, histogram modeling operators may employ nonlinear and non-monotonic transfer functions to map between pixelintensityvalues in the input and output images. Histogram equalization employs a monotonic, non-linear mapping which re-assigns the intensity values of pixels in the input image such that the output image contains a uniform distribution of intensities. This technique is used in image comparison processes (because it is effective in detail enhancement) and in the correction of non-linear effects introduced by a digitizer or display system. |
| Histogram modeling is usually introduced using continuous, rather than discrete, process functions. Therefore, the images of interest contain continuous intensity levels (in the interval [0,1]) and that the transformation function f which maps an input image A(x,y) onto an output image B(x,y) is continuous within this interval. Further, it will be assumed that the transfer law is single-valued and monotonically increasing (as is the case in histogram equalization) so that it is possible to define the inverse law DA =f -1(DB). |
| All pixels in the input image with densities in the region DA to DA+d DA will have their pixel values re-assigned such that they assume an output pixel density value in the range from DB to DB+d DB . The surface areas hA(DA)dDA and hB(DB)dDB will therefore be equal, yielding: |
| hB(DB) = hA(DA) / dDA (2) |
| where .d(x) = df(x)/d(x).This result can be written in the language of probability theory if the histogram h is regarded as a continuous probability density function p describing the distribution of the (assumed random) intensity levels: |
| PB(DB) = pA(DA) /d (DA) (3) |
| In the case of histogram equalization, the output probability densities should all be an equal fraction of the maximum number of intensity levels in the input image DM. The transfer function necessary to achieve this result is simply d (DA) = DM * pA(DA). |
| Therefore, |
| f(DA) = DM∫ = DM * FA (DA) (4) |
| Where FA (DA) is simply the cumulative probability distribution of the original image. Thus, an image which is transformed using its cumulative histogram yields an output histogram which is flat. |
| D. IMAGE SEGMENTATION |
| Otsu's thresholding method [1, 2] involves iterating through all the possible threshold values and calculating a measure of spread for the pixel levels each side of the threshold, i.e. the pixels that either fall in foreground or background. The aim is to find the threshold value where the sum of foreground and background is at its minimum. In image processing, Otsu’s method is used to automatically compute the threshold and to convert a gray scale image in to a binary image. The algorithm assumes that the image to be thresholded contains two classes of pixels. We can define the within-class variance as the weighted sum of the variances of each cluster object (O) and background (B): |
 |
| E. FEATURE EXTRACTION |
| 1) Gabor filters |
| Generally to minimize the dimension of the input data and to reduce the time taken by the classifier feature extraction is used. In this paper texture features are extracted by a set of filters called Gabor filters from the region of interest. The Gabor filters, also known as Gabor wavelets. The Gabor filters is represented by Eq. (11) where x and y represent the pixel position in the spatial domain, w0 represents the radial center frequency, q represents the orientation of the Gabor direction, and s represents the standard deviation of the Gaussian function along the x- and y- axes. |
 |
 |
3) CLASSIFICATION BASED ON MLPNN |
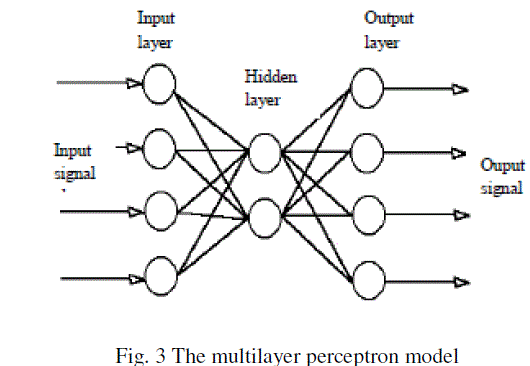
| A multilayer perceptron is constructed by connecting a number of neurons in layers which are able to solve non linearly separable problems. Each of the perceptron’s is used to identify small linearly separable sections of the inputs. Outputs of the perceptron’s are combined into another perceptron to produce the final output. In a multilayer perceptron, the neurons are arranged into an input layer, an output layer and one or more hidden layers. |
 |
| The learning rule for the multilayer perceptron is known as "the generalized delta rule" or the "backpropagation rule". The generalized delta rule repetitively calculates an error function for each input and backpropagates the error from one layer to the previous one. The weights for a particular node are adjusted in direct proportion to the error in the units to which it is connected. |
| Let Ep = error function for pattern p |
| tpj = target output for pattern p on node j |
| opj = actual output for pattern p on node j |
| wij = weight from node i to node j |
| The error function Epis defined to be proportional to the square of the difference tpj- opj |
 |
| hiddenSizes=3 and trainFcnis traingdx. Training set S for supervised learning is given by inputs and desired response (targets). |
 |
| Total error is defined by summation of partial errors for each training sample. Partial error for j-th training sample is defined as the difference Dj– Ij. This error is computed for each sample from S. The goal of ANN training is to minimize MSE. MSE <0.01 is reached after 100 epochs of learning. User can set a new coordinates as applicable input followed by re-train of ANN with new coordinates. These coordinates are considered as new inputs. Furthermore, descending tendency of MSE is observed. The threshold value is set for MSE=0.01, thus if TMSE ≤ 0.01 then stop_learningelse next epoch. Practical testing of this method showed that designed ANN is useful for positioning of ellipse in correct position in ROI window. Accuracy of this method is approximately 70% for 10 tested images. Retraining allows reach higher accuracy for manually set of coordinates and more images as input position. |
IV. EXPERIMENTAL RESULTS |
 |
 |
IV. CONCLUSION |
| Different researchers have been developed various techniques to process thyroid medical images. Such techniques help the radiologists and doctors to efficiently diagnosing the nodules in thyroid images and lead the reduction of false diagnosis thyroid diseases. In this work, the thyroid images are classified using MLPNN. The experimental results show that the classifier efficiently classifies thyroid images producing a sensitivity of 93.12% for 3 fold and 89.62% for 10 fold. This work will be extended to segment the thyroid images using fuzzy logic and also classify the images to thyroid, non-thyroid, and benign/malignant nodules. |
References |
|