ISSN ONLINE(2319-8753)PRINT(2347-6710)
ISSN ONLINE(2319-8753)PRINT(2347-6710)
S. Sreehari Sastry1,*, L. Tanuj Kumar1, and Ha Sie Tiong2
|
| Related article at Pubmed, Scholar Google |
Visit for more related articles at International Journal of Innovative Research in Science, Engineering and Technology
The phase transition temperatures and textural changes in homologous series of 2-(4- n alkanoyloxy benzylidenamino) benzothiazoles (n BABTH), where n=12 and 16, were studied by using Polarising Optical Microscope (POM). The temperature and frequency dependence of dielectric constant and dielectric loss were made out in the frequency range 1 KHz to 1 MHz .Anomalies in dielectric properties were recorded near phase transitions when dielectric constant and dielectric loss have been measured as a function of frequency and temperature. Changes in dielectric constant and loss are at low frequencies, but constant at higher frequencies. The variation of activation energy and relaxation times were studied in smectic phase.
Keywords |
| Liquid crystals, benzothiozoles, phase transitions, dielectric constant, dielectric loss, Relaxation times, Activation energy. |
INTRODUCTION |
| Generally matter exists in three states, viz., solid, liquid and gas. Certain organic compounds show intermediate phases between crystalline solids and isotropic liquids, which are thermodynamically stable. These phases exhibit rheological behavior similar to liquids but have anisotropic properties of crystalline solids and hence they are termed as liquid crystal (LC) phases [1-3]. Liquid crystals have been extensively investigated due to increasing importance in science, technology, industry, consumer product, and other medical applications [4-7]. Azobenzene based liquid crystalline (LC) materials, either low molecular weight or polymeric in nature, are fascinating and promising class of compounds due to their unique electrical, optical and mechanical properties. Amongst the wide variety of experimental methods used to study the molecular dynamics of liquid crystals (LCs), the low frequency dielectric spectroscopy assumes special importance due to the utility of the relevant data in electro-optic devices. These LC devices are known to operate in the frequency region of a few Hz to several MHz that involves different modes of their molecular motions. [8].Hetero cyclic mesogens are usually incorporated with hetero atoms such as N,O and S , resulting a reduced geometry in the overall molecule as well as generation of strong polar induction. Inclusion of the hetero atom can considerably change the polarities, polarizabilities, and to a certain extent the geometry of the molecule. Thus it influences the type of mesophase transition temperature, dielectric constants and other properties of the liquid crystals [9]. Examples of liquid crystals with incorporated heterocyclic rings are pyridine, thiophene, oxadiazole and benzoxazole. Although many compounds having a heterocyclic core exhibit mesomorphic properties, mesogenic samples derived from benzothiazole are relatively less. Benzothiazole, another kind of heterocyclic fused ring system, exhibits good hole-transporting properties with a low ionisation potential, making it of potential interest as hole-transporting materials in organic lightemitting devices (OLEDs) [10]. Therefore, the benzothiazole ring is chosen as the mesogenic core in this study. The present study emphasises at textural, phase transitions and dielectric properties of homologous series of 2-(4- n alkanoyloxy benzylidenamino) benzothiazoles mesogens where n = 12 and 16 at starting from room temperature to above to its isotropic temperatures and in the frequency range 1Hz to 1 M Hz region. |
EXPERIMENTAL |
| A. Materials: |
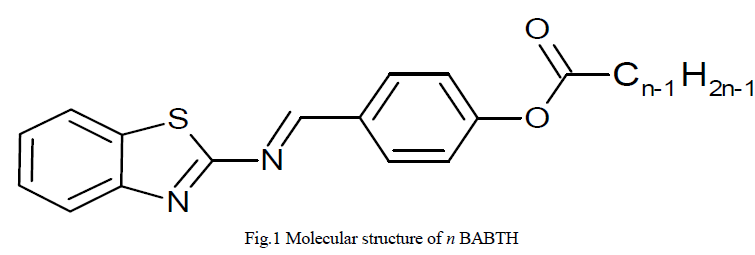
| 2-(4- n alkanoyloxybenzylidenamino) benzothiazoles (where n=12 and 16) mesogens are synthesized [11]. Chemical structure of the compound is shown in Figure 1. |
 |
B.Methods: |
| Textural and phase transition temperatures were recorded using a Meopta Polarising Optical Microscope (POM) with hot-stage as described by Gray [12]. These compounds were filled in LC1 ITO coated liquid crystal cells- 90° twist aligned (5mm X 5 mm X 6 μm) -obtained from Instec, Inc. USA. The cells were filled through capillary action method at their above isotropic temperature. The temperature and frequency dependence of Capacitance C, Resistance R, Inductance L were measured by using Newton’s 4th Ltd., LCR meter model. In this study the cells filled with samples were placed in an Instec hot and cold stage (HCS 302) being equipped with microscope (Olympus BX50) and DP10 camera setup. The temperature was monitored and controlled through a computer by a software program to an accuracy of ± 0.1oC. The sample was heated to isotropic state and held until to attain thermal equilibrium. The data were taken during cooling process. The measuring signal is the square form with amplitude of 2V. The frequency range of measurement was from 1 Hz to 1 MHz, and calculated the different dielectric parameters [13, 14]. The accuracy in dielectric constant and loss may be to the extent of 1% and 2% respectively. |
DETERMINATION OF DIELECTRIC PARAMETERS |
| A. Calculation of dielectric constant(′ ): |
| The dielectric constant of a material is the ratio of the capacitance of a capacitor containing the material to the capacitance of the same electrode system with vacuum. Using the following equation the dielectric constant,( 1 ) was calculated. |
 |
 |
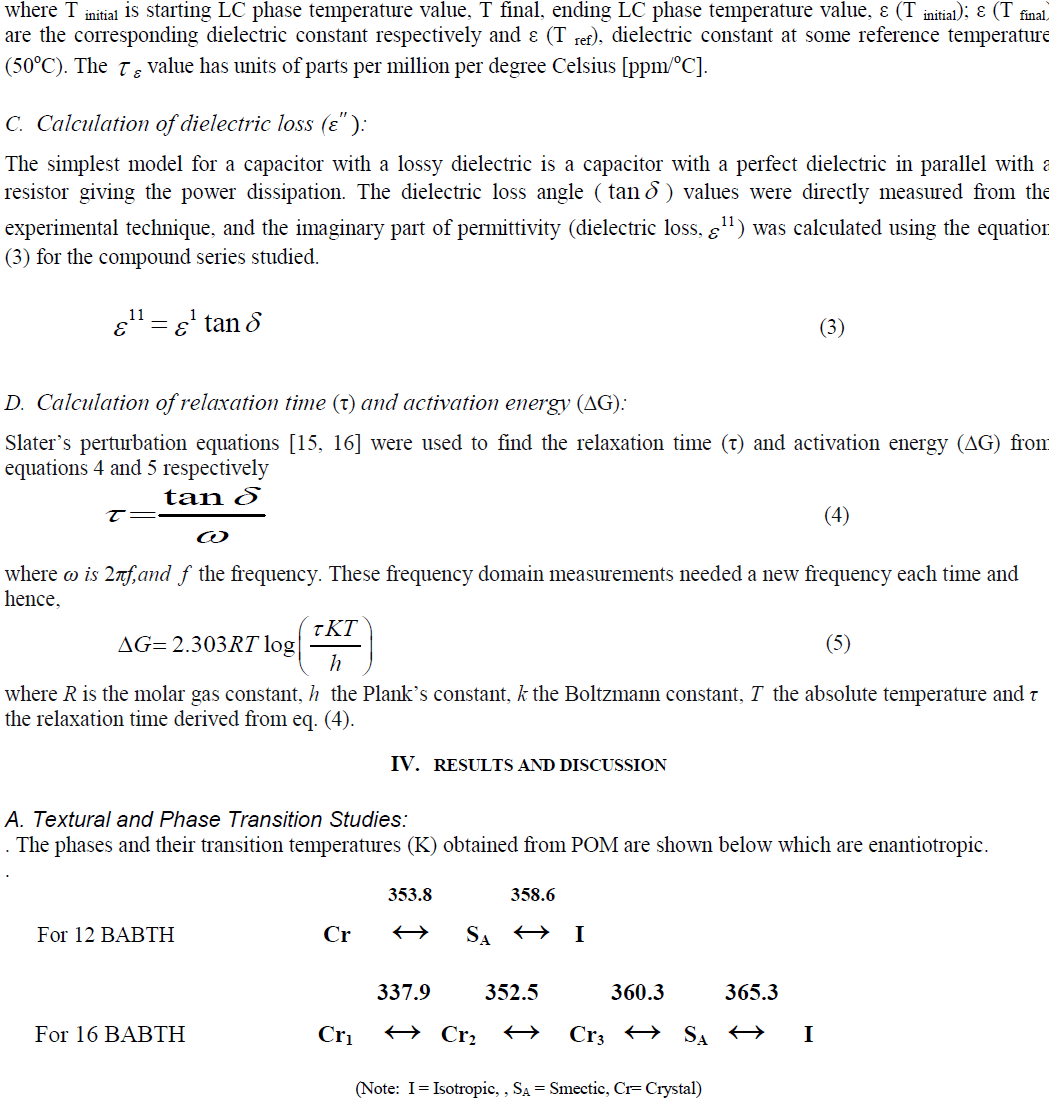 |
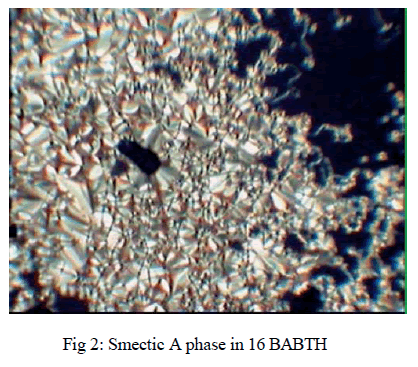
| The textural observation for 2-(4- n alkanoyloxybenzylidenamino) benzothiazoles (where n= 12 and 16) mesogens made through POM have shown enantiotropic Smectic A phase as shown in Figure 2. The transition temperatures were also determined by differential scanning calorimetry technique. The data of the phase transition temperatures measured from both POM and DSC are in good agreement. [11] |
 |
B.Dielectric Studies: |
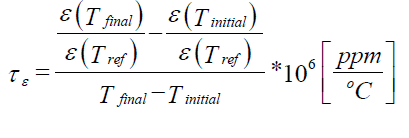
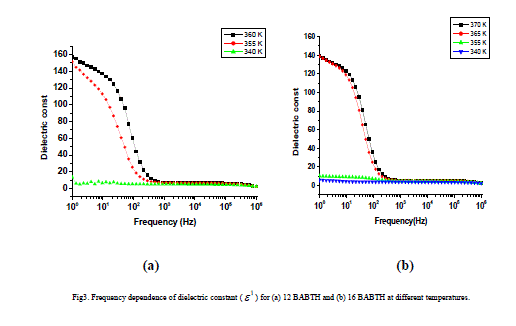
| The variation of dielectric constant, temperature coefficient dielectric constant, dielectric loss as a function of frequency, for 12 BABTH and 16 BABTH mesogens at different phases are shown in figures 3 to 5. |
 |
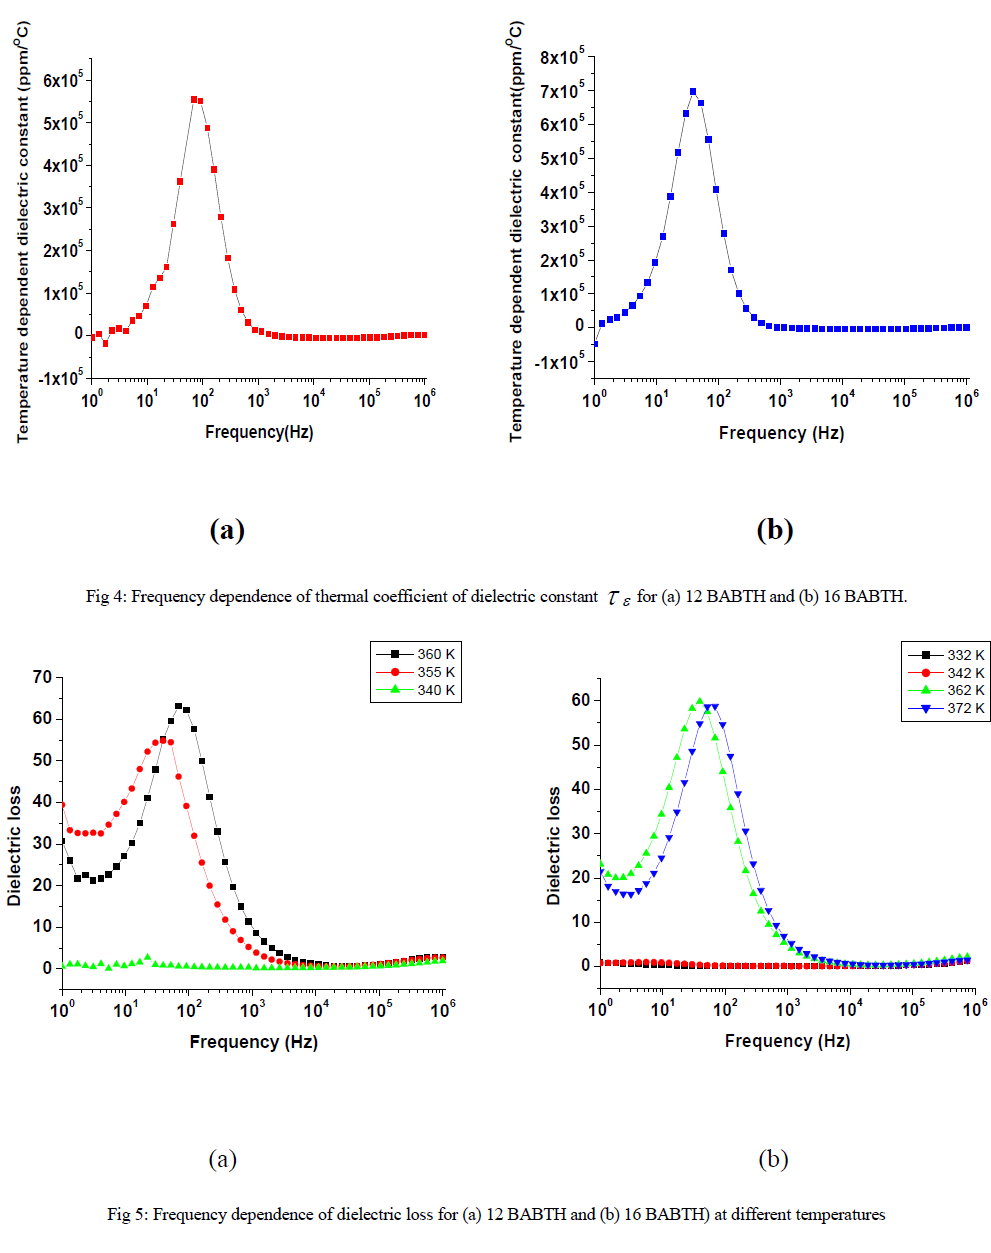 |
| The dielectric permittivity (1) and loss (11) as a function of frequency at different temperatures for both samples is shown in figure 3(a) and 3(b). The figure shows that the dielectric constant value ( is high at low frequencies and decreasing gradually with increasing frequency but increasing with increasing temperature. The higher value of (1) at low frequencies is due to the effect of space charge polarization [17]. The decrease in permittivity with frequency can be explained on the basis of Koop’s theory [18], in which dielectric materials are treated as two layer structure of Maxwell-Wagner type [19]. In this model the grains represent a conducting layer, while grain boundaries represent a poorly conducting layer. The grain possesses small value of dielectric constant and have dominant role at high frequencies [20]. The grain boundaries possess high value of dielectric constant, and mainly influence the dielectric properties. |
 |
| The figure 5 indicated the dielectric loss for 12 BABTH and 16 BABTH mesogens. The low dielectric loss is at high frequencies showing similarity with that of the variation of dielectric constant (figure 3) on owing to smaller angle of rotation. The loss factor on frequency dependence is in similar way as the dielectric constant. The variation in relaxation peaks is observed for both the compounds within the frequency range covered. The data of dielectric loss clearly show that low frequency data are affected due to ionic conductance, where as high frequency data are affected due to ITO resistance. As usual relaxation frequencies are seen to shift towards lower side with decreasing temperature. |
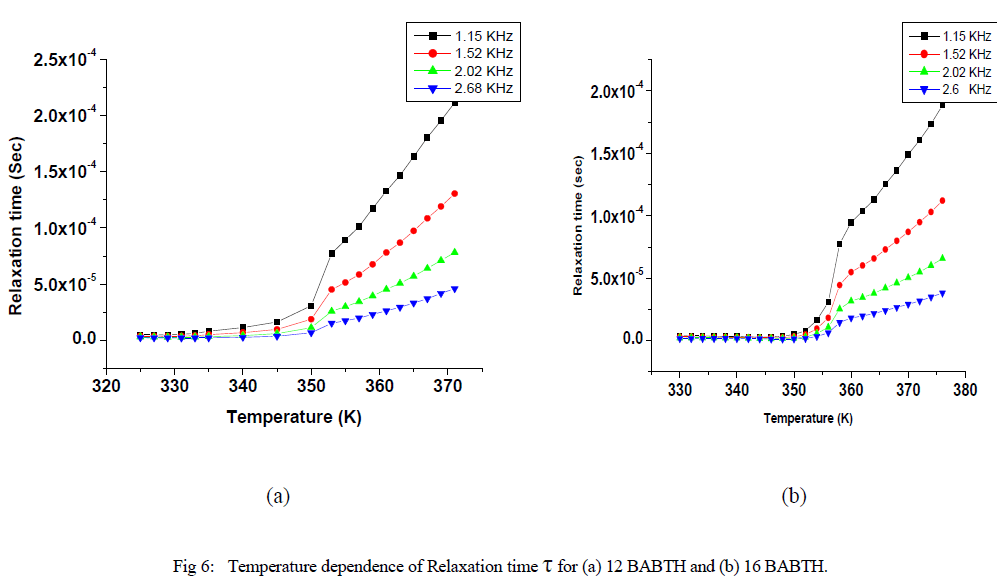
| Variation of relaxation time and activation energies at different temperatures are shown in fig 6 and fig 7. |
 |
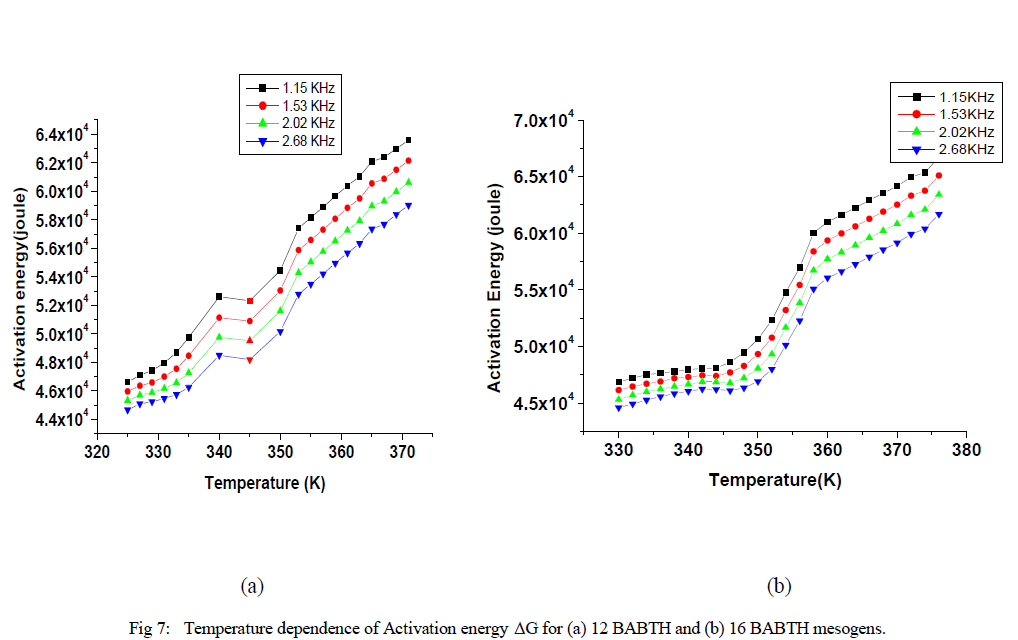 |
| The observed temperature variation of the relaxation frequency was analysed through the corresponding Slater’s perturbation equations as shown in Figures 6. it shows that the relaxation times in solid phase are increased slowly, and they are increase rapidly in liquid crystal phase up to isotropic phase. The activation energy can be interpreted as the energy required to make reorientation of molecule and the energy necessary to make the dissociation [21]. The relatively higher value of the activation energy is suggestive of the higher potential barrier witnessed by the molecular dipole moment to orient to the field at high frequencies the activation energies decreases so that it has a relatively high dielectric strength. From the figure 7, it is evident that the activation energy is increased with temperature, but relatively decreased with applied frequency. The activation energy showed similar tendencies for both samples, while increased with increasing temperature and decreased with increase of frequency as shown in Figure 7. This effect, is due to role of the surface activity of dispersed particles on local order of the liquid crystal as a result of elastic distortions associated with the liquid crystal on following increased the frequencies. At low frequencies the increase in activation energy has led to restricted mobility of charged carriers resulting in low conductivity. At higher frequencies, the decrease in the activation energy is due to high mobility of charged transports. |
CONCLUSIONS |
| The phase transition temperatures and phases of homologous series of 2-(4- n alkanoyloxy benzylidenamino) benzothiazoles (n BABTH),where n=12 and 16, were studied using polarizing microscope (POM) Thermal microscopic studies revealed enantiotropic SmA phase. The data of the phase transition temperatures measured from both POM and DSC are in good agreement. The dielectric spectrum of frequency dependent dielectric constant and the loss for both samples were analysed and space charge polarisation observed at low frequencies. The sharp changes on measured dielectric parameters in the temperature region are corresponding to the respective phase transitions in the liquid crystal materials. In addition, the variation in relaxation times and activation energy at different regions of temperature as a function of frequencies are observed. |
ACKNOWLEDGEMENTS |
| The authors gratefully acknowledge University Grants Commission Departmental Research Scheme at Level III program No. F.530/1/DRS/2009 (SAP-1), dated 9 February 2009, and Department of Science and Technology -Fund for Improving Science and Technology program No. DST/FIST/PSI–002/2011 dated 20-12-201, New Delhi, to the department of Physics, Acharya Nagarjuna University for providing financial assistance. S.T. Ha wishes to thank Universiti Tunku Abdul Rahman for a grant from the UTAR Research Fund (6200H10). |
References |
|