e-ISSN: 2320-0812
e-ISSN: 2320-0812
Kodre KV, Attarde SR, Yendhe PR, Patil RY, and Barge VU*
PDEA’s Shankarrao Ursal College of Pharmaceutical Sciences and Research Centre, Kharadi, Pune - 411014, Maharashtra, India
Received date: 17 April 2014; Accepted date: 28 May 2014
Visit for more related articles at Research & Reviews: Journal of Pharmaceutical Analysis
Thermal analysis comprises a group of techniques in which a physical property of a substance is measured to a controlled temperature program. One of the thermal analysis techniques, Differential Scanning Calorimetry is presented in this review. It is a highly sensitive technique to study the thermotropic properties of many different biological macromolecules and extracts. The results given from the Differential Scanning Calorimetry curves depend on the preparation of the sample, and on the instrument sensitivity. Several types of Differential Scanning Calorimetry instruments are described along with their applications. Also an attempt is made to introduce newer hyphenated techniques of Differential Scanning Calorimetry.
Thermal Analysis, Diffferential Scanning Calorimetry, Hyphenated techniques.
During the past few years, the methods of thermal analysis have been widely accepted in analytical chemistry. The term thermal analysis incorporates those techniques in which some physical parameter of the system is determined and/or recorded as a function of temperature [1]. Thermal analysis has been used to determine the physical and chemical properties of polymers, electronic circuit board, geological materials and coals [2].
Differential scanning calorimetry (DSC) is one of the thermo-analytical techniques. A calorimeter measures the heat into or out of a sample. A differential calorimeter measures the heat of sample relative to a reference. A differential scanning calorimeter does all of the above and heats the sample with a linear temperature ramp [3]. DSC is a technique in which the difference in the amount of heat required to increase the temperature of a sample and reference are measured as function of temperature. Both the sample and reference are maintained at nearly the same temperature throughout the experiment. Generally, the temperature program for a DSC analysis is designed such that the sample holder temperature increases linearly as a function of time. Only a few mg of material are required to run the analysis.DSC is the most often used thermal analysis method, primarily because of its speed, simplicity, and availability [4]. It is mostly used for quantitative analysis [2].
When a sample undergoes a physical transformation such as a phase transition, more or less heat will need to flow to it than to the reference (typically an empty sample pan) to maintain both at the same temp. Whether more of less heat must flow to the sample depends on whether the process is exothermic or endothermic.
For e.g.as a solid sample melts to a liquid it will require more heat flowing to the sample to increase its temp. At the same rate as the reference. This is due to the absorption of heat by the sample as it undergoes the endothermic phase transition from solid to liquid. Likewise, as the sample undergoes exothermic processes. (Such as crystallization) less heat is required to raise the sample temp. By observing the difference in heat flow between the sample and reference, DSC is able to measure the amount of heat absorbs or release during such transition [5].
There are four different types of DSC instrument
• Heat flux DSC
• Power compensated DSC
• Modulated DSC
• Hyper DSC
• Pressure DSC
Heat flux DSC
In heat flux DSC, the difference in heat flow into the sample and reference is measured while the sample temperature is changed at the constant rate [4]. The main assembly of the DSC cell is enclosed in a cylindrical, silver heating black, which dissipates heat to the specimens via a constantan disc which is attached to the silver block. The disk has two raised platforms on which the sample and reference pans are placed. A chromel disk and connecting wire are attached to the underside of each platform, and the resulting chromel-constantan thermocouples are used to determine the differential temperatures of interest. Alumel wires attached to the chrome discs provide the chromel-alumel junctions for independently measuring the sample and reference temperature.
A separate thermocouple embedded in the silver block serves a temperature controller for the programmed heating cycle. And inert gas is passed through the cell at a constant flow rate of about 40 ml/min [6].
In heat flux DSC, we can write the total heat flow dH/dt as,

Where, H = enthalpy in J mol-1
Cp=specific heat capacity in JK-1 mol-1
f (T,t )= kinetic response of the sample in J mol-1
Thus, the total heat flow is the sum of the two terms, one related to the heat capacity, and one related to the kinetic response 4
The most fundamental types of HF- DSC-
The Disk Type Measuring System– Heat Flux DSC
The disk type measuring system heat exchange takes place trough a disk which is solid sample support. The main heat flow from the furnace passes symmetrically trough disk with a medium thermal conductivity; this is its main characteristic.
In some cases the disks are made with combination of metal (e.g. platinum) and covered with ceramics. Modification of the disk type of DSC is very common. One is HF-DSC with a triple measuring system. With three separate locations the measurement of specific heat is measured with just one run. In the classic HF-DSC device three measurements must be made (with an empty crucible, with a sapphire or a known inert sample and with the investigated sample). Another modification is high pressure HF-DSC, which is used to determine vapour pressures and heats of evaporation. Its features are high sensitivity and small sample volume [7].
The Cylinder measuring system – Heat flux DSC
In the cylinder type measuring system the heat exchange takes place between the(big) cylindrical sample cavities and the furnace with a low thermal conductivity (thermopile). Only low heating and cooling rates are possible. The sensitivity per unit volume is high even with a large sample volume. This system has a larger time constant than the first two measuring systems. The heat flux DSC operating on Calvet principle is using a cylinder type measuring system by two sintered alumina cylinders set parallel and symmetrical in the heating furnace.
The crucible used here is produced from stainless steel. The HF-DSC with the cylinder measuring system is appropriate for large samples.
Figure 3: The heat flux DSC with a cylinder- type measuring System (Calvet)[10]
Compared with the other apparatuses, the cylinder type has a much larger volume and therefore a longer time constant which can be as long as 40 min[7].
The turret-type measuring system – HF DSC
In turret type heat exchange takes place via small hollow cylinders which also serve as sample support. Small hollow cylinders are used forsample support and for the heat exchange.The turret measuring system is ideal for determining the purity of metals.
The advantage of the turret system is in the heat transfer from the jacket to the sample, because it goes through a thin-walled cylinder. This way a very short heat conducting path is achieved.
The system is very small thus the characteristic time is very short. No interference between the sample and the present. The turret type is special because of a third thermocouple which measures the thermal inertia. This is a so-called Tzero DSC technology [7].
Micro differential DSC–modified HF DSC
This method is a combination of an isothermal calorimeter and a HF-DSC mode device. In an isothermal calorimeter, the heat generated by the sample, flows through the thermal resistance into a water jacket. The temperature difference across the thermal resistance is measured.[8]Micro DSC has the same ability to measure the thermal properties as an ordinary DSC device.
One of the advantages is a very high sensitivity but on the other hand the temperature range is very narrow (–20 °C to ≈120°C). With this type of device it is ideal to study crystallisation because the cooling and heating rates can be even lower than 0.001 °C/min (with a response time of few seconds) and is also suitable to determine phase transitions like intermediate phases between solid and liquid in Liquid crystals[9].
Power compensation DSC
In power compensation DSC, the temperatures of the sample and reference are kept equal to each other while both temperatures are increased or decreased linearly. The power needed to maintain the sample temperature equal to the reference temperature is measured. In power compensation DSC two independent heating units are employed. These heating units are quite small, allowing for rapid rates of heating, cooling and equilibration. The heating units are embedded in a large temperature- controlled heat sink.
The sample and reference holders have platinum resistance thermometers to continuously monitor the temperature of the materials. Both sample and reference are maintained at the programmed temperature by applying power to the sample and reference heaters.
The instrument records the power difference needed to maintain the sample and reference at the same temperature as a function of the programmed temperatures. Power compensated DSC has lower sensitivity than heat flux DSC, but its response time is more rapid.
This makes power compensated DSC well suited for kinetics studies in which fast equilibrations to new temperature settings are needed. it is also capable of higher resolution then heat flux DSC [4].
All PC DSC are in basic principles the same. But, one of the special PC DSC is photo DSC. Where direct measurements of radiation flow occurunder a light source. This way the degradation of material can also be observed. The maximum heating rate for not modified PC DSC is up to 500K/min and the maximum cooling rate is up to 400 K/min. Temperature range of measurement is up to 400 °C with time constant of only 1.5 s or lower. Sample masses are around 20 mg. Crucibles of different volumes (lower than several ten cubic millimetres) are made mostly of aluminium [7].
Modulated DSC
Modulated DSC uses the same heating and cell arrangement as the heat – flux DSC method. it is a new technique introduced in 1993 [4].
The main advantage of this technique is the separation of overlapping events in the DSC scans. In MDSC the normally linear heating ramp is overlaid with the sinusoidal function (MDSC) defined by a frequency and amplitude to produce a sine wave shape temperature versus time function.
Using Fourier mathematics, the DSC signal is split into two components: reflecting no reversible events (kinetic) and reversible events,


where, T=temperature
C=specific heat
t=time
w=frequency
f(t,T)= the average underling kinetic function once the effect of the sine wave modulation has been subtracted.
K= amplitude of the kinetic response to the sine wavemodulation.
[b+Bw cos (wt)]=the measured quantity dT/dt or reversing Curve.
MDSC is a valuable extension of conventional DSC. Its applicability is recognized for precise determination of the temperature of glass transition and for the study of the energy of relaxation. It has been applied for the determination of glass transition of Hydroxypropylmethylcellulose films and for the study of amorphous lactose as well as some glassy drugs [11].
Hyper DSC
The high resolution of PC-DSC or new type of power compensating DSC provides the best results for an analysis of melting and crystallisation of metals or detection of glass transition temperature (Tg) in medications. Fast scan DSC has the ability to perform valid heat flow measurements with fast linear controlled rates (up to 500 K/min) especially by cooling, where the rates are higher than with the classical PC DSC. Standard DSC operates under 10 K/ min. The benefits of such devices are increased sensitivity at higher rates (which enables a better study of the kinetics in the process), suppression of undesired transformation like solid – solid transformation etc [12].It has a great sensitivity also at a heating rate of 500 K/min with 1 mg of sample material. This technique is especially proper for the pharmaceutics industry for testing medicaments at different temperatures where fast heating rates are necessary to avoid other unwanted reactions etc [7].
Pressure DSC
In pressure DSC, the sample can be submitted to different pressures, which allows the characterisation of substances at the pressures of processes or to distinguish between overlapping peaks [11].Applications of this technique includes studies of pressure sensitive reactions, evaluation of catalysts , and resolution of overlapping transitions[2].
Calibration of an instrument Temperature Calibration
The measured temperature values are related to the emf generated at the thermocouples located under the sample. The emf is converted to temperature units using standard calibration charts, however several effects cause the thermocouple to age and shift calibration. It is therefore recommended to calibrate the temperature axis using substances with precisely known melting points. Most DSC instruments allow calibration over limited temperature ranges. In calibrating the temperature scale to true
Temperature values, one must also consider the thermal shift (DTL). Nevertheless, the temperature shift effect can in principle be avoided by using very low heating rates during the calibration measurement.
Enthalpy Calibration
The energy calibration is carried out by measuring changes in specific heat or in enthalpy of standard specimens for which these quantities are known. The heat balance equation for the heat-flux DSC system can be shown to be as follows (eqn.7):

dH'/dt refers to the heat evolution of an exothermic transition; the first term on the right side is the area under the DSC peak, after the baseline correction. The second term refers to the actual baseline (this is used in specific heat determinations). The last term takes into account the fact that the evolved heat partially will be consumed by the specimen to heat itself. It does not affect the DSC peak area, but may distort the peak shape.
When dH'/dt = 0, the second term of can be used to determine specific heat. The method involves a comparison of the thermal shift (difference) between sample and reference. The system is first calibrated with a sapphire specimen, so that

Where, m = mass of the specimen
E = calibration constant
Csapphire = specific heat capacity of sapphire
qY = axis range (Js/mm)
H = heating rate
Y = difference in Y-axis deflection between sample (or sapphire) and ‘empty’ runs (blank curves) at the temperature of interest.
Enthalpy changes can be determined by measuring the areas under peaks on the DSC curve DT vs. time. A relationship of the form indicated in equation (1) applies when the instrument is in calibrated mode [6].
Typical DSC Curve
The result of a DSC experiment is a curve of heat fluxversus temperature or versus time. This curve can be used to calculate enthalpies of transitions, which is done by integrating the peak corresponding to a given transition. The enthalpy of transition can be expressed using equation:

Where, ΔH = enthalpy of transition,
K= calorimetric constant,
A= area under the peak.
Calorimetric constant varies from instrument to instrument, and can be determined by analyzing a well-characterized material of known enthalpies of transition. Area under the peak is directly proportional to heat absorbed or evolved by the reaction. Height of the peak is directly proportional to rate of the reaction [12].
Factors Affecting DSC Curve
Two types of factors affect the DSC curve
Instrumental factors
• Furnace heating rate
• Recording or chart speed
• Furnace atmosphere
• Geometry of sample holder/location of sensors
• Sensitivity of the recording system
• Composition of sample containers
Sample characteristics
• Amount of sample
• Nature of sample
• Sample packing
• Solubility of evolved gases in the sample
• Particle size
• Heat of reaction
• Thermal conductivity [1].
Determination of Heat Capacity
DSC plot can be used to determine Heat Capacity. When a polymer is being heated. When we start heating two pans, the computer will plot the difference in heat output of the two heaters against temperature that is plot of heat absorbed by the polymer against temperature.
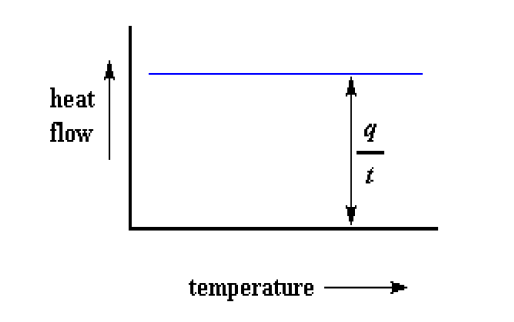
The heat flow is heat (q) supplied per unit time (t), whereas, The heating rate is temperature increase (ΔT) per unit time (t),
Heat flow= heat/ time = q/t
Heating rate = temperature increase / time = ΔT / t
By dividing heat flow (q/t) by the heating rate (ΔT/t). It ends up with heat supplied divided by the temperature increase, which is called heat capacity.

When a certain amount of heat is transferred to the sample, its temperature increases by a certain amount, and the amount of heat it takes to get a certain temperature increase is called the heat capacity, or Cp.
The Glass Transition Temperature
On further heating the polymer to a certain temperature, plot will shift downward suddenly, like this:
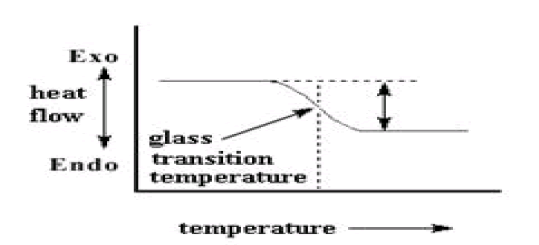
This means there is more heat flow. There is an increase in the heat capacity of the polymer. This happens because the polymer has just gone through the glass transition (It is a reversible transition in amorphous material from a hard, brittle state into molten rubber like state).Because of this change in heat capacity that occurs at the glass transition, we can use DSC to measure a polymer's glass transition temperature.
Crystallization
After glass transition, the polymers have a lot of mobility. They wiggle and squirm, and never stay in one position for very long time. But when they reach the right temperature, they will give off enough energy to move into very ordered arrangements, which are called crystals. When polymers fall into these crystalline arrangements, they give off heat. So it doesn't have to put out much heat to keep the temperature of the sample pan rising. This drop in the heat flow as a big peak in the plot of heat flow vs. temperature.
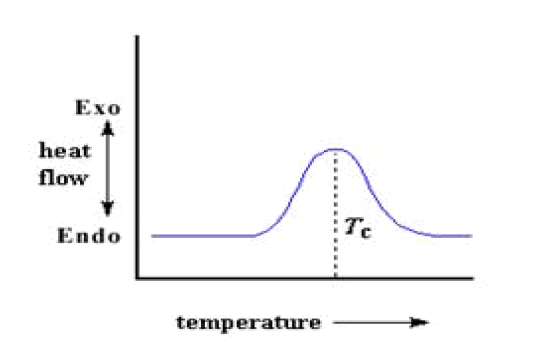
The temperature at the highest point in the peak is usually considered to be the polymer's crystallization temperature, or TcAlso, the area of the peak can be measured, which tells us the latent energy of crystallization of the polymer. But most importantly, this peak tells us that the polymer can in fact crystallize. If 100% amorphous polymer is analysed, like polystyrene, this peak cannot be obtained, because such materials don't crystallize also, because the polymer gives off heat when it crystallizes, called as crystallization is an exothermic transition
Melting
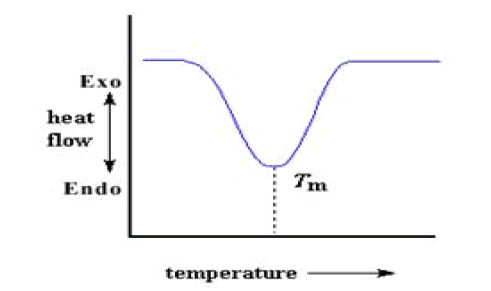
If polymer is heated past its Tc, eventually reach another thermal transition, called melting. When polymer's melting temperature is reached, Tm, the polymer crystals begin to fall apart, that is they melt. It comes out of their ordered arrangements, and begin to move around freely that can be spotted on a DSC plot The heat which polymer give off when crystallized is absorbed when reached at Tm. That is a latent heat of melting like latent heat of crystallization. When the polymer crystals melt, they must absorb heat in order to do so. Melting is a first order transition. This means that at the melting temperature, the polymer's temperature won't rise until all the crystals have melted. The heater under the sample pan has to put a lot of heat into the polymer in order to both melt the crystals and keep the temperature rising at the same rate as that of the reference pan.
This extra heat flow during melting shows up as a big dip on DSC plot, like this:
Putting It All Together- First step in the plot when the polymer was heated past its glass transition temperature.
Then a big peak when the polymer reached its crystallization temperature. Then finally a big dip when the polymer reached its melting temperature. To put them all together, a whole plot will often look something like this
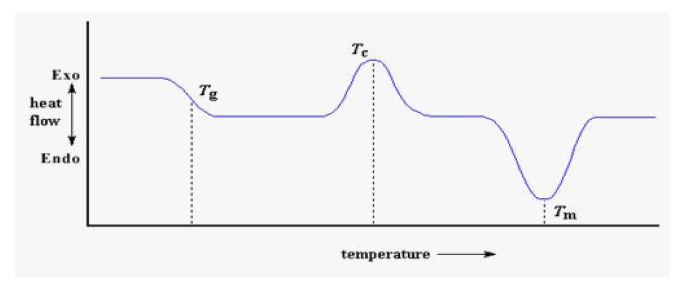
The crystallization peak and the melting dip will only show up for polymers that can form crystals and melts. Completely amorphous polymers won't show any crystallization, or any melting either. But polymers with both crystalline and amorphous domains will show all the features for the glass transition, there is no dip, and there's no peak, either. This is because there is no latent heat given off, or absorbed, by the polymer during the glass transition.
Both melting and crystallization involve giving off or absorbing heat. The glass transition temperature is a change in the heat capacity of the polymer. Because there is a change in heat capacity, but there is no latent heat involved with the glass transition, the glass transition is second order transition. Transitions like melting and crystallization, which do have latent heats, are called first order transitions
DSC is used in the study of liquid crystals. Some materials go from solid to liquid; they go through a third state, which displays properties of both the phases. This anisotropic liquid is known as a liquid crystalline state or mesomorphous state. Using DSC, observe the small energy changes that occur as matter transitions from a solid to a liquid crystal and from a liquid crystal to anisotropic liquid.
To study the stability to oxidation of samples generally requires an airtight sample chamber. Usually, done isothermally (at constant temperature) by changing the atmosphere of the sample. First, the sample is brought to the desired test temperature under an inert atmosphere, usually nitrogen. Then, oxygen is added to the system. Any oxidation that occurs is observed as a deviation in the baseline. Such analysis can be used to determine the stability and optimum storage conditions for a material or compound.
DSC is widely used in the pharmaceutical and polymer industries. For polymers, DSC is a tool for studying curing processes, which allows the fine tuning of polymer properties. The cross-linking of polymer molecules that occurs in the curing process is exothermic, resulting in a peak in DSC curve that usually appears soon after the glass transition.
In the pharmaceutical industry it is necessary to have well-characterized drug compounds in order to define processing parameters. For instance, if it is necessary to deliver a drug in the amorphous form, it is desirable to process the drug at temperatures below which crystallization can occur.
General chemical analysis
Melting-point depression can be used as a purity analysis tool. This is possible because the temperature range over which a mixture of compounds melts is dependent on their relative amounts. Consequently, less pure compounds will exhibit a broadened melting dip that begins at lower temperature than a pure compound.
Polymers
DSC is used widely for examining polymers to check their composition. Melting points and glass transition temperatures for most polymers are available from standard compilations, and the method can show up possible polymer degradation by the lowering of the expected melting point, which depends on the molecular weight of the polymer, so lower grades will have lower melting points than the expected.
Impurities in polymers can be determined by examining thermogram for anomalous peaks, and plasticizers can be detected at their characteristic boiling points.
Food science
In food science research, DSC is used in conjunction with other thermal analytical techniques to determine water dynamics. Changes in water distribution may be correlated with changes in texture [13].
DSC is not normally hyphenated as frequently as is TGA but hyphenation has been used. DSC-IR has been used to look at the evolved solvents from pharmaceuticals while DSC-MS has been used to look at the composition of meteorites and lunar rocks. It is also used for the determination of the purity of materials (polymers, inorganic compounds, pharmaceutical products, etc).
DSC has also been coupled to FT-IR microscopy to look at changes in a sample during a DSC run. Probably the most promising hyphenated technique is DSC-Raman, where a sample is irradiated by a Raman laser as the sample is run in DSC profile. Because of the nature of the Raman spectrometer, it is ideally suited for this as it does not require any processing of neither reflectance spectra nor the use of a special transmission path cell. DSC-Raman shows great potential for the study of polymorphic materials, polymeric-crystallization, and chain movements at the glass transition, and for hydrogen bonding polymers.
High Pressure (HP) DSC is used for several reasons: first, an oxidative stability test may take too long at atmospheric pressures to be convenient. An example of that would be looking at an antioxidant package in motor oil. Secondly, some reactions form water or methanol as a by product, leading to foaming in the sample. Higher pressure suppresses this. Thirdly, some reaction kinetics are affected by pressure and running the reaction under controlled pressure is needed to study this. Finally, transitions like the Tg and boiling point are responsive to pressure and running DSC under pressure allows you to study that. For boiling points, pressure DSC allows you to calculate the vapor pressure of the sample.
UV-DSC or Photo-DSC is a DSC that has been adapted to allow the sample to be exposed to UV light during the run. This can be done with several types of light sources, like mercury vapor lamps or LEDs, over a range of frequencies and intensities. UV-DSC allows the study of UV initiated curing systems in the DSC, like those used for dental resins, orthopaedic bone cements, hydro gels, paints or coatings, and adhesives. It complements the technique of UV-DMA, which allows you to gain mechanical information on these systems. UV-DSC allows you to study the efficiency of curing and to develop kinetic models for curing systems. UV-DSC is also used to study the decomposition of materials under UV radiation. This can be for understanding the effects on the storage of pharmaceuticals, on antioxidant packages in polymers and rubbers, on food kinetics to model the degradation by UV light. Because of the high intensities of UV available, accelerated testing is possible [14].
The review presents a highly sensitive and accurate thermo analytical technique i.e. Differential scanning calorimetry which is often used because of its speed, simplicity and availability. It is mostly used for quantitative analysis. It has applications in various areas of polymer, liquid crystal studies, food science, chemical and drug analysis. A detailed review of several types of DSC instruments along with their applications has been given. Brief introduction of newer hyphenated techniques of DSC is also given.