ISSN ONLINE(2319-8753)PRINT(2347-6710)
ISSN ONLINE(2319-8753)PRINT(2347-6710)
P.Nagarajan1,2, T.Karunanithi3, Yulin Deng4
|
| Related article at Pubmed, Scholar Google |
Visit for more related articles at International Journal of Innovative Research in Science, Engineering and Technology
The present work attempts to investigate the ability of fusariumoxysporum and neurosporacrassa to ferment cellulose to ethanol directly. Batch experiments were performed for both the strain at 30.c in 250ml conical flasks.1000ml of production medium was distributed equally in 7 sterile,250 ml conical flasks, each containing various initial concentrations of cellulose 20,30,40,50,60,70 and 80g/l respectively.20ml of inoculum medium was transferred to each 100ml production medium in sterile conditions. Initial values of ethanol concentration, cellulose concentration and cell mass were determined. The inoculated flasks were maintained at 300 C in a rotary shaker operating at 200 rev min-1.Analyses were carried out for every 24 hours using the contents of the various conical flasks.Experiments were conducted for mixed cultures of different compositions 80:20, 60:40, 40:60, and 20:80by volume respectively.The cultures fusariumoxysporum and neurosporacrassa were mixed in proportion 80:20,60:40,40:60,and 20:80 respectively mixed cultures were used for inoculation.Based on the kinetic models, equations have been developed for the determination cell mass, product and substrate concentration as a function of time. Using the experimental data, constants of these equations have been evaluated. These mathematical relationships can be used with reasonable accuracy.
Keywords |
| Cellulose, Ethanol, Mixed culture, Batch processes and Kinetic Studies. |
INTRODUCTION |
| Direct bioconversion of cellulose to ethanol is a process in which the same microorganism carries out both hydrolysis and fermentation of cellulose to ethanol in one operation. Simultaneous hydrolysis of cellulose to ethanol improves the kinetics and economics of biomass conversion by minimizing accumulation of hydrolysis products that are inhibitory. Only limited work has been carried out in this area of research |
| Fusariumoxysporumhas been reported to ferment cellulose to ethanol in a one step process. But not much detail on yields has been published. The filamentous fungus FusariumOxysporum is known for its stability to produce ethanol by simultaneous saccharification and fermentation of cellulose. The main disadvantage is the slow conversion rate when compared with yeast. |
| Neurosporacrassa species have not been extensively studied from a biotechnological viewpoint for their cellulolytic activity or ethanol production till now. However, the production of cellulaseas well as aryl β- D-glucosidase from Neurosporacrassahas been reported. Neurosporacrassa, excreting cellulose and xylanase in the culture fluid, ferments cellulose directly to ethanol. In view of its ability to produce ethanol through termination of pentose sugars as well as D-glucose and cellulose, Neurosporacrassa strains merit further detailed study. |
| It is possible that when mixed cultures of two microorganisms are used, both species may grow faster than they do separately. Such an interaction called mutualism may help increase the yield of the product.The results are presented for the systematic analysis of the influence of various parameters that control substrate utilization, microbial growth and product formation.The models developed for the bioconversion of cellulose. Riccati type logistic equation has been used for the prediction of cell mass. Leudeking-Piret model is incorporated with logistic equation to get the product concentration. Modified Leudeking model is used for the estimation of substrate concentration. The experimental data are analyzed for the effect of parameters that influence the process. The concentration profiles obtained from the models developed are compared with the experimental results and adequacy and limitations of these models are discussed in detail. Correlations have been developed for the prediction of the values of the model parameters. |
LITERATURE SURVEY |
| Cellulose, a major component of the cell wall of plants, is the most abundant and renewable carbohydrate. In recent years, it has been proposed that waste cellulosic biomass could be used as a cheap and readily available sugar to replace starchy materials in fermentation (Bailey and Ollis, 1986). |
| The energy and environmental gains from cellulosic ethanol, known as bioethanol, will be substantial .Bioethanol represents a net energy gain of 60,000 Btu per gallon, up to three times more than starch ethanol. Ultimately, largescale cellulosic ethanol production will require production of dedicated crops such as switch grass or fast-growing poplar trees. CO2 will cycle in and out of the atmosphere as ethanol is burned and new crop rotations are planted (Lynd et al., 2002). |
| Bioconversion of cellulosic materials to ethanol has attracted world-wide interest in recent years. This process is generally accomplished in two steps by conventional methods. In the first step, the biopolymers are hydrolyzed to monosaccharides. In the second step, these monosaccharides are converted to ethanol (Mielenz, 2001). Have investigated the intracellular metabolite profiling of Fusariumoxysporumconverting glucose and glucose-xylose mixture ( Panagiotou et al., 2005). |
| Several filamentous fungi have been reported to directly ferment cellulose to ethanol, though on rich, undefined media. These include members of the genera Aspergillus, Rhizopus,Monilia ,Neurosporacrassa(Deshpande et al., 1986), and Fusariumoxysporum.The recombinant Klebsiellaoxytoca SZ21 developed by (Zhou et al., 2001) was able to directly produce ethanol from amorphous cellulose, although with insufficient ethanol yield.Ethanol production was not affected when the activity of the former two enzymes was varied within a wide range as reported by(Christakopoulos et al, 1989). |
| During the different phases of the cultivations, the intracellular profiles were determined under aerobic and anaerobic conditions( Panagiotouet al., 2004). |
| (Aditya et al., 1990) have discussed the production of ethanol from sugars in wood hydrolysate. Wood hydrolysate used for ethanol production by two strains of Fusariumoxysporum contained 2.3% (w/v) reducing sugars - xylose and glucose (Kadam et al., 2000). |
| Neurosporacrassa, aerobic fungi, has a potential role in producing ethanol from biomass. This organism has an in durable system for the repair of genetic damage (Ikram et al., 2003). The corresponding ethanol concentrations in the fermentation medium were 4.6% and 6.4%. These results clearly demonstrated that a large portion of insoluble carbohydrates from sorghum was converted by simultaneous saccharification and fermentation to ethanol (Lezinov et al., 1994). No studies on mixed cultures involving FusariumoxysporumandNeurosporacrassa have been reported so far. |
METHODS AND EXPERIMENT |
| All bioconversion experimental investigations require periodic subculture and maintenance of microorganism, preparation of media and inoculums, careful conduction of experiment under aseptic condition besides others. The laboratory strains (wild type) of Fusariumoxysporum MTCC 739 and Neurosporacrassa MTCC 839 .The basic requirement of the medium was obtained from the literature (Christakopoulos et al., 1989; Deshpande et al., 1986). A :Growth medium |
| The composition of growth medium for Fusariumoxysporum is as follows: potato- 200 g/l; sucrose- 20 g/l and agar- 20 g/l. The pH of the medium was adjusted to 6.5.The composition of growth medium for Neurosporacrassa is as follows: Sucrose- 20.0 g/l;KH2PO4(anhydrous) - 5.0 g/l;Tri-sodium citrate-2.5g/l; MgSo4.7H2O- 0.2 g/l; NH4NO3 (Anhydrous)- 2.0 g/l;CaCl2.2H2O- 0.1 g/l; Biotin solution (5 mg/ml)- 1.0 ml, Trace element solution 1 ml and agar - 20.0 g/l. |
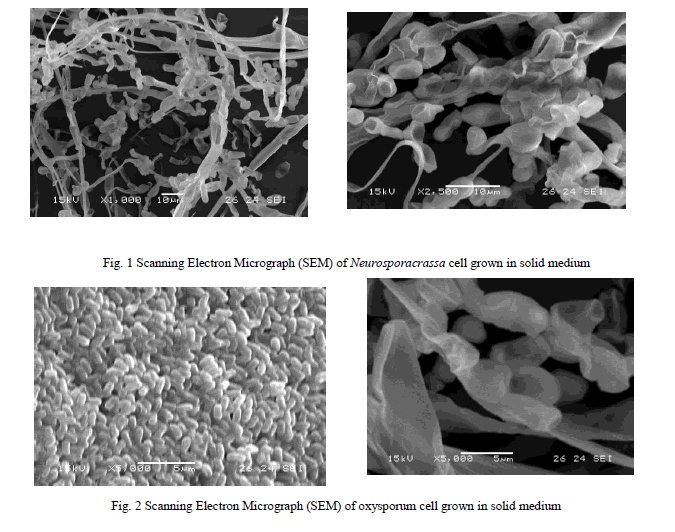
| The trace element solution was prepared by dissolving in 95 ml of water: Citric acid- 5.0g; ZnSO4.7H2O -5.0 g; Fe (NH4)2(SO4)2.6H2O -1.0g; CuSO4.5H2O- 0.25g; MnSO4 4H2O and H3BO3 (anhydrous) added in trace so that the total volume of trace element solution is about 100ml. The stock culture for both the strains were maintained on a sterile medium and incubated for a period over 7 days for Fusariumoxysporumand 3 days for Neurosporacrassa at a temperature of 30ïÃâðC and then stored in a refrigerator at 0ïÃâðC for further use. The strain used for this study is shown in Figs 1&2. |
 |
| B: Preparation of mixed culture broth From the mutant strains of Fusariumoxysporum and Neurosporacrassa, mixed culture broths were prepared at different proportions of Fusariumoxysporum and Neurosporacrassa in the ratio of 80:20, 60:40, 40:60, and 20:80 by volume respectively. They were kept in the incubator and were incubated at 30 ïÃâðC . |
| C: Production Medium |
| The production medium for Fusariumoxysporum is as follows (Mishra et al. 1984; Basil Macris, 1984): KH2PO4- 2 g/l; ZnSO4.7H2O- 0.02 g/l; Mg SO4-0.3 g/l;FeSO4.7H2O- 0.05 g/l;CaCl2 - 0.3g/l; MnSO4.4H2O- 0.02 g/l; Peptone -5g/l; Malt extract- 3g/l; Yeast extract- 3 g/l and CoCl2-2 g/l.The production medium for Neurosporacrassa is as follows: Malt extracts - 3 g/l; Yeast extract - 3 g/l and Peptone -5 g/l. |
| D:Assay techniques |
| Estimation of cell mass |
| Centrifuge tubes were well washed and dried in an oven to remove all the moisture. Weights of empty dry centrifuge tubes were found out using electronic balance. 10ml of the broth was taken in the centrifuge tube and centrifuged for 20min. The settled biomass was made free of water and it was kept in the oven to remove all moisture. The weights of centrifuge tubes with the biomass were found out by electronic balance. The weight of the cell mass was found from the difference in measured weights. |
| Estimation of cellulose by Anthrone reagent method |
| The estimation of cellulose was carried out using spectrophotometer. 3ml of acetic reagent prepared by mixing 150ml of 80% acetic acid and 15ml of concentrated nitric acid was added to one gram of the sample in a test tube and mixed in a vortex mixture. The tube was placed in a water bath at 100°C for 30 minutes, cooled and then centrifuged for 15-20 minutes. The supernatant liquid was discarded; the residue was washed with distilled water. Then 10ml of 67% sulphuric acid was added and allowed to stand for 1 hour. One ml from the above solution was diluted to100ml. To one ml of this diluted solution, 10ml of anthrone reagent, prepared by dissolving 200mg anthrone in 100ml concentrated sulphuric acid and chilled for 2 hours before use, was added and mixed well. The tubes were heated in boiling water bath for 10 minutes, cooled and the intensity of color was measured at 630 nm in a spectrophotometer. The amount of cellulose in the sample was estimated from the standard chart prepared by using known cellulose concentration (Sadasivam and Manickam 1996). |
| Estimation of Ethanol |
| The concentration of ethanol was determined using gas chromatograph containing FID. Poropak column by which all the hydrocarbons can be determined was used for this purpose. The carrier gases (nitrogen) and fuel gas (hydrogen and oxygen) were regulated at a certain pressure. Flame was ignited at the flame ionization detector port. The injector, detector and oven temperatures were programmed. After reaching the stability, when the oven temperature and detector, injector temperature were at the programmed temperature, a sample was injected from fermentation flask into injector port by using a micro syringe at 2 psi pressure. The peak eluted was noted. By knowing, area of peak, the concentration of ethanol was calculated using standard graph. |
RESULT AND DISCUSSION |
| A: Pure wild cultures |
| The pure cultures of Fusariumoxysporum and Neurosporacrassa are compared in terms of cell growth, ethanol production and cellulose conversion. It should be kept in mind that the ultimate aim is to select systems that yield maximum alcohol. |
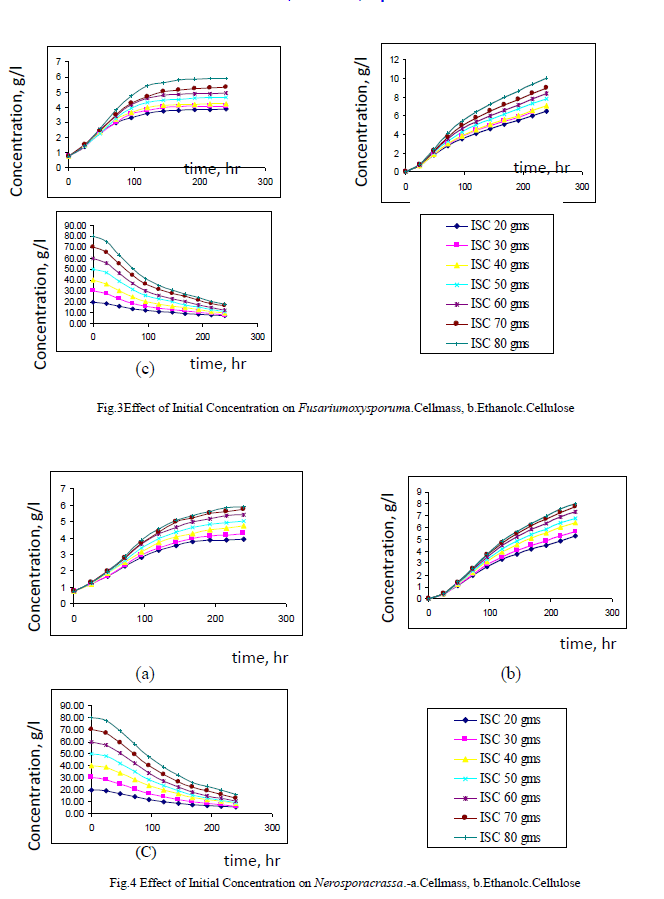
| Both Fusariumoxysporum and Neurosporacrassa yield ethanol in significant amounts. However, Fusariumoxysporum is more efficient in the production of ethanol when compared to Neurosporacrassa. In fact ethanol yield for Fusariumoxysporum is 15% higher than that of Neurosporacrassa (Figs 3b and 4b). Tis is true for all initial concentrations of cellulose considered for this study. It is also noted that as the initial concentration of cellulose is raised, the alcohol concentration in the broth also increases |
| Cell mass production is high for Neurosporacrassacompared to Fusariumoxysporum. Neurosporacrassa produces 7% more cell mass than Fusariumoxysporum. (Figs 3a and 4a). |
| Cellulose conversion, on an average, is 76% for Fusariumoxysporum and 79% for Neurosporacrassa indicating an increase of 3% for Neurosporacrassa (Figs 3c and 4c.) . These points considered together indicate that Neurosporacrassa produce more by products. Hence the ethanol production efficiency decreases. |
| B:Effect of Initial concentration: |
| Figs 3 and 4 indicate the effect of initial concentration on the performance of the pure cultures. As the initial concentration of cellulose is varied cell mass production varies proportionally. Higher cell mass concentration is obtained for 80% and the least in for 20%. The trend is same for both the pure cultures of Fusariumoxysporum and Neurosporacrassa.The results clearly indicate that the more the initial concentration of cellulose the higher the production of ethanol. |
 |
| C: Wild mixed cultures |
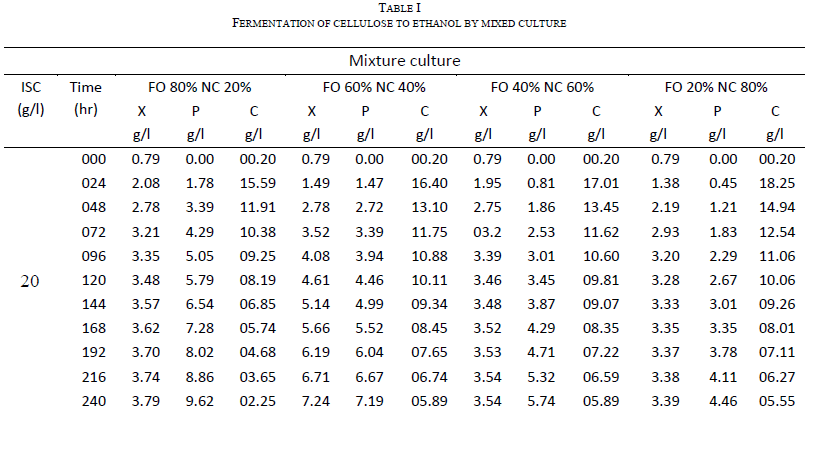
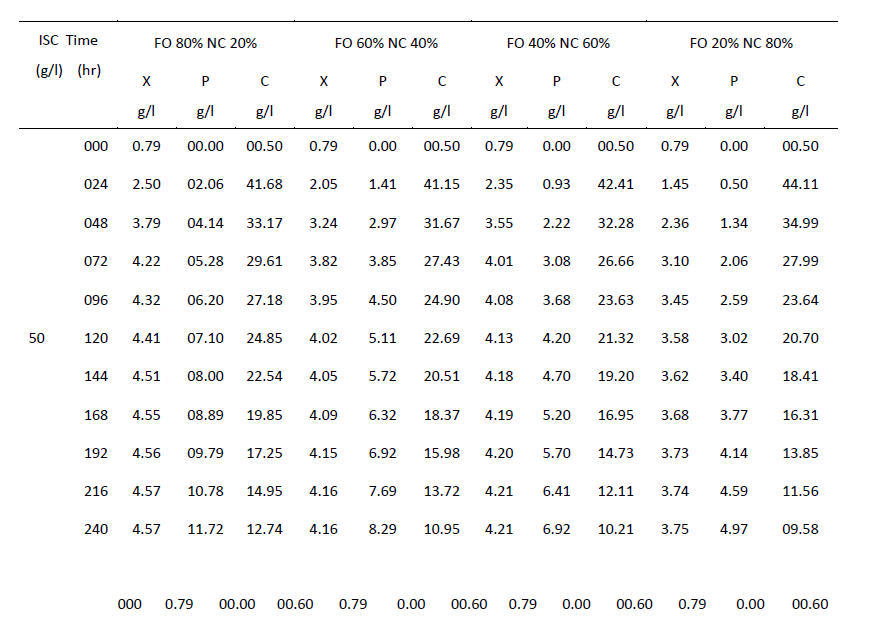
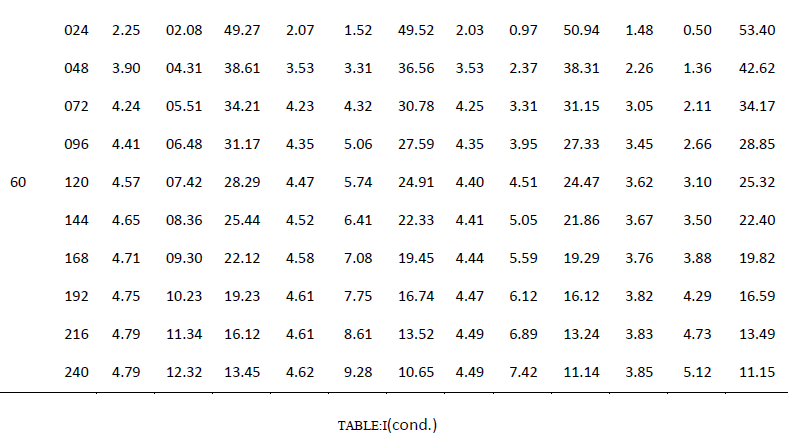
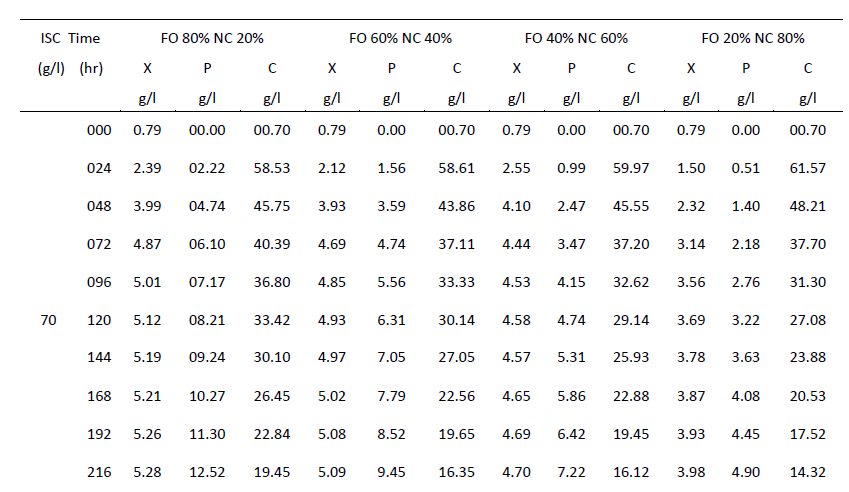
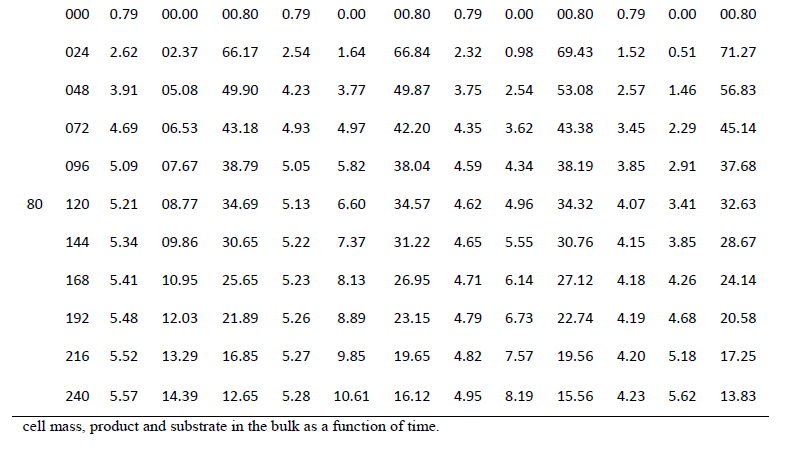
| One of the main objectives of the present work is to verify whether mixed cultures are more effective than the pure cultures. Mixed cultures of various ratios of Fusariumoxysporum and Neurosporacrassa are compared with the wild cultures in terms of cell growth, ethanol production and cellulose conversion. This is done to determine the proper composition of the microorganisms in the mixed cultures that yield maximum alcohol (Table I). |
| Cell mass: |
| The wild culture of Fusariumoxysporum and the mixed culture having the composition 80% Fusariumoxysporum and 20% Neurosporacrassa(FO80 - NC20) have nearly same cell mass concentration at the stationary phase even though the initial rate of generation of cell mass is high for mixed culture. The addition of Neurosporacrassa into the mixture (FO60-NC40, FO 40-NC60 and FO20-NC80) reduces the final cell mass concentration. In fact, in all these three cases the final cell mass concentration is less than the concentration of pure cultures. |
| Ethanol: |
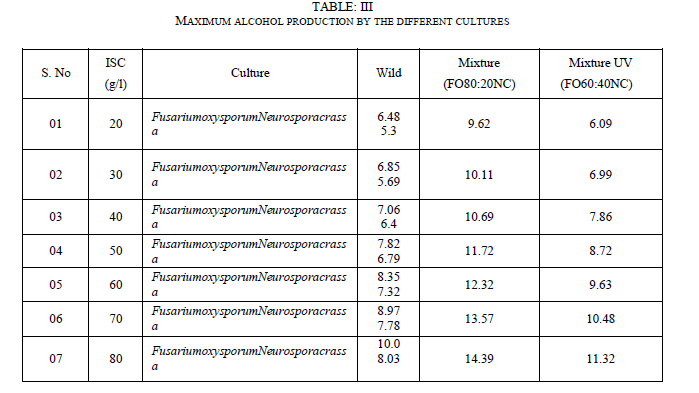
| The mixed culture (FO80 - NC20) yields maximum alcohol when compared to other cultures. It is followed by FO60- NC40, pure culture Fusariumoxysporum, FO40-NC60 and the pure culture Neurosporacrassa. FO20-NC80 gives least alcohol when compared to all others and hence need not be used for fermentation studies. FO60-NC40 is slightly more efficient than pure culture of Fusariumoxysporum. |
| Cellulose |
| For low initial concentrations of cellulose, the conversion by (FO80 - NC20) is high when compared to others. Higher than this initial concentration results in the decrease of conversion. There is only marginal difference among the various |
 |
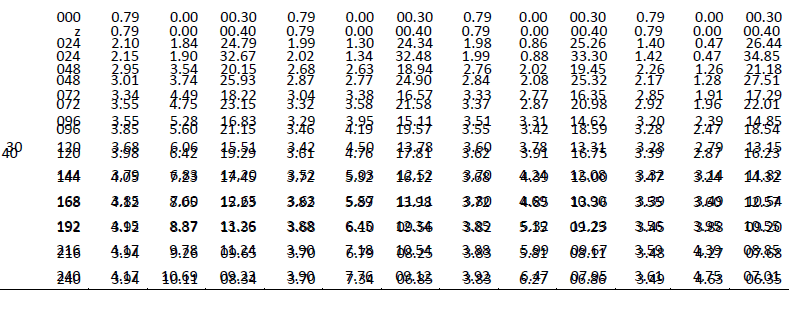 |
| TABLE :I(cond.) |
 |
 |
 |
|
|
KINETIC MODELING |
| Each individual cell is a complicated multicomponent system, which is frequently not spatially homogenous even at the single cell level. Many independent chemical reactions occur simultaneously in each cell. In a growing cell population, there will be significant cell to cell heterogeneity. There will be age distribution of the cells. Cells of different ages are characterized by different types of metabolic functions and activities (Bailey and Oills, 1986). |
| This leads to the unstructured model.In the present study, the mass transfer effects are lumped together with the biochemical reactions and the rate expressions are represented in terms of the gross properties of the system. Thus the concentrations represent the conditions at the bulk only.Models are described to represent change in concentrations of |
 |
A: Microbial growth Logistic curve |
| Rate of growth of cell is proportional to the cell mass concentration present at that time(x). The rate will stop when the cell mass concentration reaches stationary phase. When the cell mass concentration is near the stationary phase rate will slow down. That is, growth rate also depends on how far the cell mass concentration at a given point of time is away from the cell mass concentration at stationary phase. |
| The above Riccati equation which can be integrated to give the logistic curve equation. |
 |
| The above equation represents concentration as a function of time. |
| To evaluate the model parameters and to relate the changes in substrate, cell mass and product concentrations, a Yield coefficient is introduced. The above equation is cell mass kinetics. |
| B:Yield of growth: |
| The yield coefficients are related by the equation |
| Equation 3 indicates that the product formation rate is proportional to the cell and substrate utilization rate. In many cases significant product formation occurs late in the log phase (approaching the stationary phase). One such model is the Leudking- Piretkietic model. This model combines both growth-associated and non-growth associated contributions |
| This two parameter kinetic expression has proved useful and versatile in fitting product formation data of many different fermentation processes. The first term in the RHS represents the energy used for the growth and the second term represents the energy used for maintenance. The above equation can be written as |
 |
| Rearranging equation (5), integrating and inserting into Eq (2) |
| C: Substrate utilization kinetics |
| A part of the substrate is used for conversion to cell mass, a part used for product formation and another part for maintenance. Therefore, |
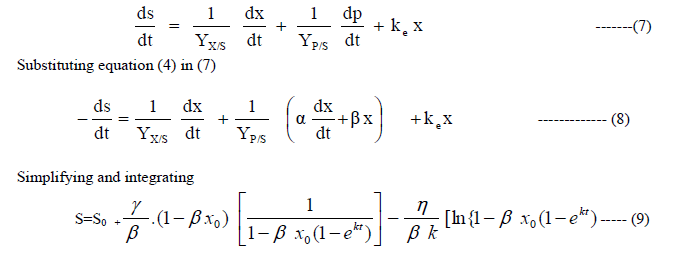 |
| Equations(2), (6) and (9) describe the growth of cell mass, production of ethanol and substrate utilization respectively with respect to time. |
| D: Estimation of kinetic parameters |
| The above models contain the kinetic parameters k, α, β, γ and η. They should be evaluated using the experimental data. |
| Determination of k: |
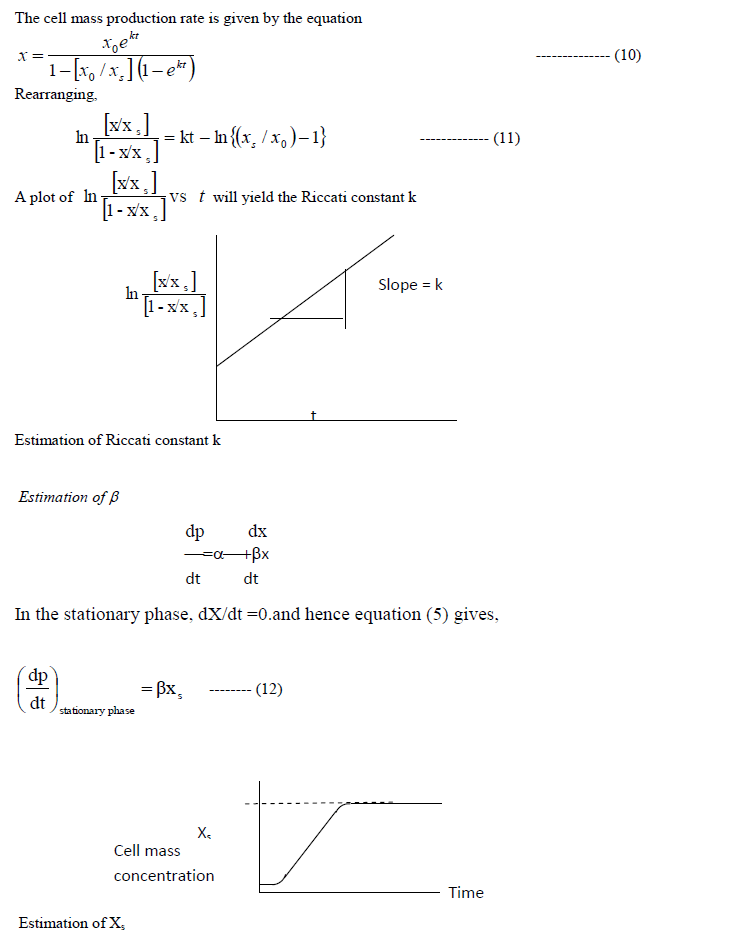 |
| The slope of the product concentrationcurve near the stationary phase will be a straight line. This value is divided by the cell mass concentration at the stationary phase to getβ. |
| Estimation of α |
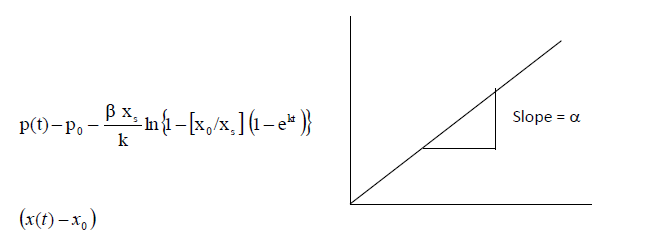
| The product concentration is given by the equation (6). This equation is rearranged in the following way to determineα. |
 |
| Estimation of growth constant ïÃÂá |
| Estimation of ïÃÂç |
| Using Yx/s, Yp/s and ïÃÂç can be calculated using the following equation |
 |
| E: Model validation |
| Using the kinetic parameters obtained, concentrations of cell mass, product ethanol and substrate cellulose are estimated as a function of time for each case. These predicted values are compared with experimentally determined values. The closeness between these results should validate the model. |
| Error analysis |
| For each set of experimental data and for each of the variables x(t), P(t), C(t), the error between the predicted and experimental values are calculated using the equations |
 |
 |
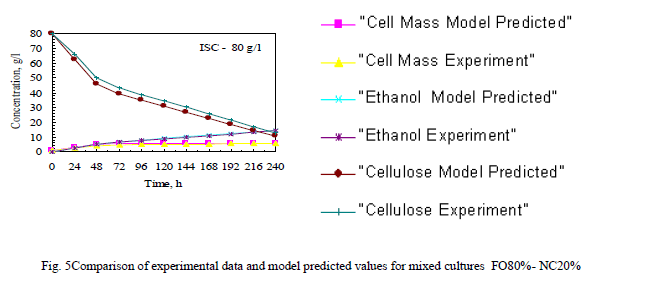
| For most of the cases, equation 2 predicts the cell mass concentration within 10%. Hence the Riccatitype equation is valid and can be used with confidence. Equation 6predicts the concentration of ethanol with reasonable accuracy (≤10%) for the pure culture and mixed culture. |
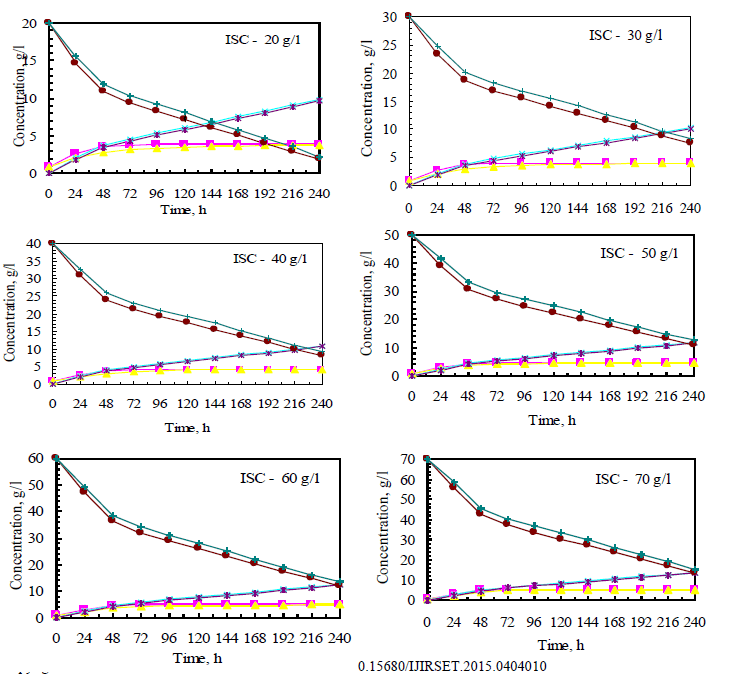
| The Fig 5 shows Comparison of experimental data and model predicted values for mixed cultures FO80%- NC20% . Remaining ratio also like this and constants are presented in table II. |
| TABLE II ESTIMATED VALUES OF MODEL PARAMETERS |
 |
 |
CONCLUSION |
| The present investigation reveals certain important and useful facts. Both Fusariumoxysporum and Neurosporacrassa yield ethanol in significant amounts and further studies can be carried out for commercial development of the process. The effect of initial concentration of substrate is significant; the more initial concentration of cellulose the higher production of ethanol. This is true for both the pure and mixed cultures. There is no substrate inhibition for the range covered in this work. |
| For mixed cultures the rate of utilization of cellulose is high during the initial stage itself. However for pure cultures the rate is slow initially due to lag phase. It may be that mixed culture do not have lag phase. Even though cell mass production is high for wild culture, yield of alcohol is less indicating the formation of more by- products. |
| The results of the present research work can be summarized as follows: |
| 1. Ethanol produced by wild culture Neurosporacrassa is least |
| 2. From the results of TableIII it is concluded that mixed culture with a composition of 80% Fusariumoxysporum and 20% Neurosporacrassa can be used for maximum ethanol production |
 |
| Based on the kinetic models, equations have been developed for the determination cell mass, product and substrate concentrations as a function of time. Using the experimental data, constants of these equations have been evaluated. These mathematical relationships can be used with reasonable accuracy. Mixed culture grows at a faster rate than the pure cultures till the stationary phase is reached. However the pure cultures reach the stationary phase late and the final cell mass concentration is above that of mixed culture. |
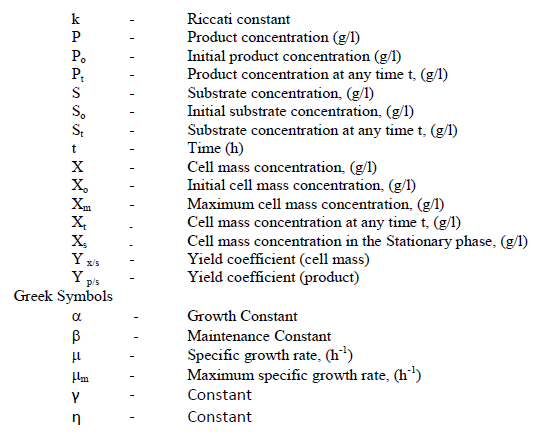
NOMENCLATURE |
 |
Abbreviations |
| X – Cell mass concentration, g/l |
| P - Concentration of Ethanol, ethanol, g/l |
| P - Concentration of Ethanol, ethanol, g/l |
| ISC- initial concentration of cellulose, g /l |
| FO – Fusariumoxysporum |
| NC – Neurosporacrassa |
| FO 20%- NC 80% -Fusariumoxysporum20% -Neurospora crassa-80% |
| FO 40%- NC 60% - Fusariumoxysporum40% -Neurospora crassa-60% |
| FO 60% -NC 40% -Fusariumoxysporum60% -Neurospora crassa-40% |
| FO 80% -NC 20% - Fusariumoxysporum80% -Neurospora crassa-20%c |
References |
|