This paper presents the probabilistic reliability methodology in the radial distribution system. Reliability is a key aspect of power system design and planning. Reliability indices are calculated at each load points by analytical method. The reconfiguration is aimed at maximizing the reliability of power supplied to the customers. Binary particle swarm optimization (BPSO) is used to determine optimal configuration of switches in network in order to maximize reliability at load points. The proposed methodology applied on IEEE-9 bus system.
Keywords |
| distribution system, probabilistic
reliability model, reconfiguration, reliability indices,
BPSO |
INTRODUCTION |
| The economic and social effects of loss of electric
service have significant impacts on both the utility
supplying electric energy and the end users of electric
service. The power system is vulnerable to system
abnormalities such as control failures, communication
system failures,protection and disturbances is due to
lightning error, and human operational errors. Hence,
maintaining a reliable power supply is a very important
issue for power systems design and operation. The
objective of a reliability-driven design of a distribution
system is to reduce the frequency and duration of power
interruptions to the customers. This implies the reduction
in the number of customers affected by individual faults,
thenreduction in time needed to locate and isolate a fault,
this reduces the time required to restore power to affected
customers, and strengthening of the network by improving the existing power lines and installing new power lines
and equipment, if required. The function of an electric power system is to satisfy the system load requirement
with a reasonable assurance of continuity and quality and
the ability of the system to provide an adequate supply of
electrical energy is usually designated by the term of
reliability. The concept of power-system reliability is
extremely broad and covers all aspects of the ability of the
system to satisfy the customer requirements. |
| There is a reasonable subdivision of the concern
designated as “system reliability".Thisrepresents two
basic aspects of a power system: system adequacy and
security. This relatesAdequacy to the existence of
sufficient facilities within the system to satisfy the
consumer load demand. These include facilities necessary
to generate sufficient energy and the associated
transmission and distribution facilities required to
transport the energy to the actual consumer load points.
This relates security to the ability of the system to respond
to disturbances arising within that system. Therefore,
Security is associated with the response of the system to
whatever perturbations it is subject to Most of the
probabilistic techniques presently available for powersystem
reliability evaluations are in the domain of
adequacy assessment. Intuitively, adequacy is tied to
forecasting (load and capacity). However, power system
reliability evaluations are usually conducted separately in
the functional zones of generation, transmission and
distribution. The Assessments are made in the combined
generation and transmission systems are known as bulk
system evaluation. Ingeneration system reliability
evaluation, the generation capacity of the total system is
examinedto determine its adequacy to meet the total
system load requirement. Generationadequacy analysis is
not intended to provide the reliability indices for
individual load points. On the other hand, the distribution
system is usually analyzed as a separate entity.
Distribution network reconfiguration is the process of altering the topology of the system by changing the
open/closed status of the sectionalizing devices such that
no feeder overloads or abnormal voltages are created.
This research focuses on reconfiguration for service
restoration as an intermediate process in reliability
analysis. Reconfiguration for restoration improves system
reliability by reducing customer down times following
outages power. In this research, a reconfiguration for
restoration algorithm is developed that takes into account
multiple concurrent failures and also load priorities.
Reliability evaluation of an electric power system can be
divided into two main categories, system adequacy
evaluation and system security evaluation. System
adequacy is concerned with the evaluation of adequacy of
resources to supply the demanded load, whereas system
security is concerned with the response of system to
disturbances. Electric power systems are complex and
large systems. It is difficult to analyze the entire system at
once. For this reason the power system is generally
divided into three main hierarchy levels for reliability
evaluation. |
| HLI (Hierarchy level 1) are concerned with the
reliability evaluation of generation systems. The main
indices analyzed in this study are loss of load expectation
(LOLE), loss of energy expectation (LOEE), failure
frequency and failure duration. In this study only the
generation systems are considered and the effect of
transmission and distribution systems on reliability are
neglected. |
| HLII studies constitute of both the generation and the
transmission systems. This study can be used to assess the
reliability of an existing system or a proposed system.
These studies give two main outputs, one related to each
bus and the other for overall system. The main indices
considered here are failure frequency and failure duration. |
| HLIII constitutes of the entire power system consisting
of generation, transmission and distribution. Due to the
complexity of such a system, evaluation of the entire
system is not done. The reliability analysis of distribution
system is done separately, wherein the indices from HLII
evaluation are inputs to the reliability evaluation of the
distribution system. The main indices to be considered in
this evaluation are SAIFI, SAIDI and CAIDI. |
| Section II gives an overview of probabilistic reliability
assessment to calculate the reliability indices are used in
this paper. Section III briefly describes the BPSO
algorithm. Section IV gives the Formulation of
optimization problem. Simulated results are presented in
Section V and Section VI concludes the paper. |
REIABILITYASSESSMENT USING PROBABILISTIC
TECHNIQUE |
| Reconfiguration methodology followed in this paper is
to maximize the reliability at various load points. At each
and every load point reliability indices are calculated. By
using the algorithm optimal placement of switches are
found, in order to reduce the frequency as well as the
duration of interruptions. First step is to evaluate the
reliability at various load points by using probabilistic
technique. |
| A. Component Statistics |
| A power system consists of various components,
such as lines,breakers, cables, switches,
reactors,transformers, and capacitors. Any single
component outage may cause a partial or even entire
system outage. The availability of component functionally
is characterized by failure rates and repair or replacement
times. |
| • average failure rate XS, |
| • average outage time rS, |
| • average annual outage time Us. |
| XS =Σ Xi (1) |
| US =Σ Xi.ri (2) |
| rS = ΣXi.ri (3) |
| ΣXi |
| B. Reliability Indices |
| They classify into two categories:System-wide indices
and customer indices. And the former is used to give an
insight of the overall system performancewhile the latter
is more specific and reflects what the individual customer
experiences[2]. They are classified based on the
interruptions dealt with sustained or momentary. |
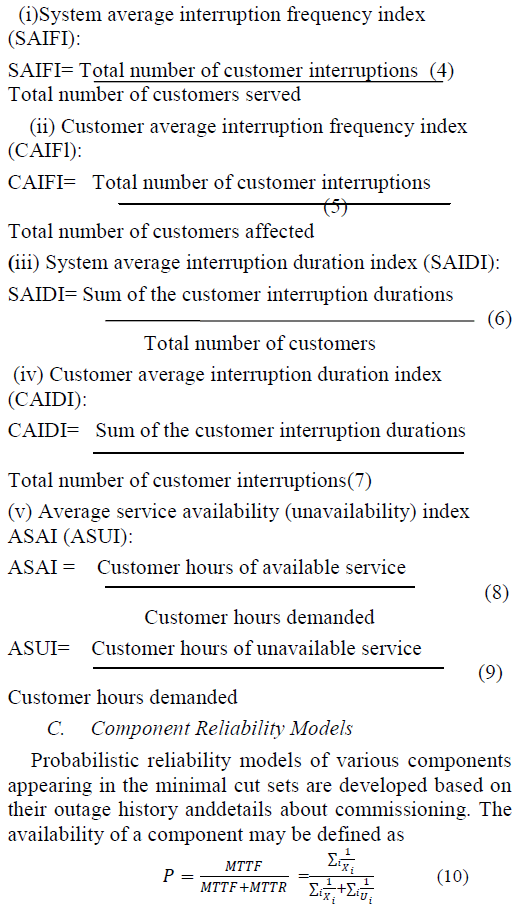 |
| Where MTTF is the mean time to failure, and MTTR is
the mean time to repair for a component; and are different
types of outage and repair rates considered. The types of
models for various components are considered in this
paper are defined as follows: |
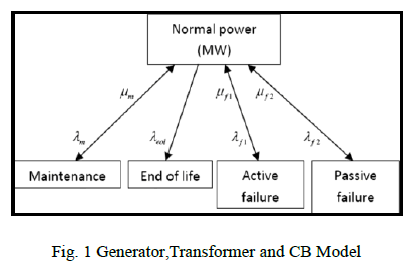
| 1). Generator, Transformer, and Circuit-Breaker (CB)
Model: |
| The common model for the generator, transformer, and
CB is shown in Fig. 1. It includes failure modes, active
and passive. Passive event is a failure component mode
that does not cause the operation of protection breakers
and theydoes not have an impact on the remaining healthy
components. Service is restored by repairing or replacing
the failed component the examples are open circuits and
inadvertent opening of breakers andthe active event is a
component failure mode that causes the operation of the
primary protection zone around the failed component and
can therefore cause the removal of other healthy
components and branches from service.Outage
maintenance and end-of-life probabilities are also
included in the model. |
 |
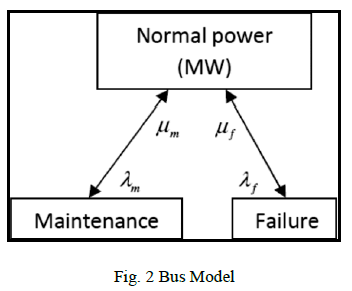
| 2). Bus Model: |
| The reliability model of a bus bar is shown in Fig. 2
this includes maintenance and failure modes. |
 |
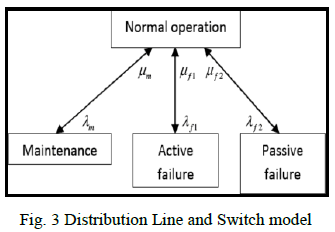
| 3). Distribution Line and Switch Model: |
| The reliability model of the transmission line and
switch is shown in Fig. 3, which includes active and
passive failure modes and outagemaintenance state. |
 |
| D. Evaluating the Reliability at the Load Centers |
| The computational time can be prohibitively large even
for an offline stage of planning and one of the major
contribution of this paper is the application of the
probabilistic method with very less computational time
even for large systems. In this paperhas been identified
that the number of components appearing between the
feeder and a load point in a distribution system is limited.
Hence, the computation of the joint probability of outage
of the components is possible within a short time, as
explained in the following text. The minimal cut sets
between the feeder and the load points are determined by
using the algorithm[5]. For the power failure at a load
point of all the components of a cut set must fail. In
addition, the load point fails if failureof any one of the cut
sets occurs, and each cut set is effectively connected in
series with all other cut sets and thedetails of evaluating
the reliability at the load points for cut sets of different
orders are described in the following text. Unreliability at
the load point is given by |
 |
| Where Ci is the failure event of the ��th minimal cut set
between the feeder and the load point, P(.) denotes the
probability of occurrence of an event. |
| The reliability at the load point is given by |
 |
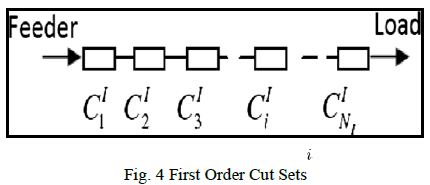
| 1). First-Order Cut Sets: |
| Fig.4 shows a set of first-order cutsets between the
feeder and the load point. The failure event of the ith firstorder
cut set is denoted byCI; and NI is the total number of
first-order cut sets. |
 |
| The unreliability at the load point due toelements of
outage belonging to one or more first-order cut sets is
given by |
 |
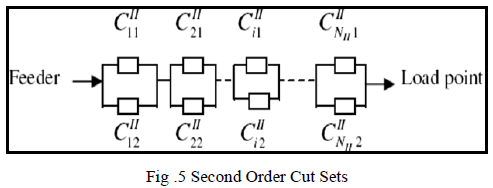
| 2). Second-Order Cut Sets: |
| Fig.5shows a number of second-order cut sets
between the feeder and the load point and the power
failure at a load point due to the failure of a second-order
cut set occurs when both components in the cut set fails,
reason is they are connected in parallel. |
 |
| The unreliability of the load point due tocomponents
outage belonging to one or more second-order cut sets is
given by |
 |
| Where the Failure event CII is given by |
 |
| Here, NI is the total number of second-order cut sets. This
cut set can cause a failure only when both of its
components fail. |
 |
| Once the unreliability is computed for various orders of
cut sets in equation (2) can be used to compute the total
unreliability of points under load condition. The
corresponding measure of the reliability is obtained by
using (3). For a distribution system having multiple load
points, then the average value of the unreliability is taken
as |
 |
| Where QSA is the average unreliability for the system, and
L is the total number of load points considered in the
distribution system. |
BINARY PARTICLE SWARM OPTIMIZATION |
| The reconfiguration of the distribution system
discussed in this paper is aimed at maximizing the
reliability of the power at the load points and minimizing
the system power loss. And the BPSObased algorithm is
used to find the optimal configuration of the switches in
the network. Reliability at the load points is evaluated by
using the probabilistic method described in Section II. It
has been successfully applied to optimize various
continuous nonlinear functions. The basic principles of
PSO are taken from the collective movement of a flock of
bird. Number of agents or particles is employed in finding
the optimal solution for the problem under consideration.
PSO is based on the exchange of information between
individuals, so called particles, of the population, so
called swarm. Each particle adjusts its own position
towards its previous experience and towards the best
previous position obtained in the swarm. The movement
of particles toward finding the optimal solution is guided
by the knowledge of individual and other particles. The
position of particle at any instant is determined by its
velocity at that instant and the position at the previous
instant, as shown in equation (18) |
 |
| Where Xi(t)and Xi(t-1) are the position vectors of the ith
particle at the instant tand t-1 respectively, andVi(t)is the
velocity vector of the particle. The velocity vector is
updated by using the experience of the individual particles
and the knowledge of the performance of the other
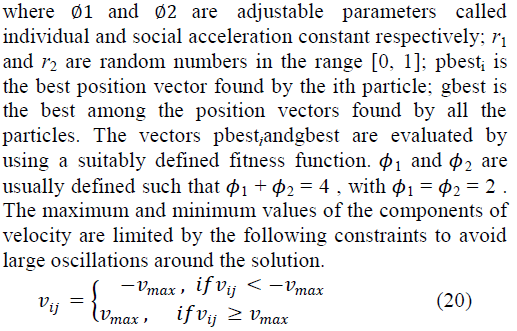
particles in its neighborhood and the velocity update rule
for a basic PSO is |
 |
 |
| In BPSO, each element of position vector can take only
binary values i.e. 0 or 1.At each stage of iteration, the
element of position vector xi are updated according to the
following rule. |
 |
| Where Pijis a random number in the range[0 1]. S(vij) is a
sigmoidal function defined as, |
 |
| In a BPSO algorithm, population is initiated randomly
with particles and evaluated to compute fitnesses together
with finding the particle best (best value of each
individual so far) and global best (best particle in the
whole swarm). Initially, each individual with its
dimensions and fitness value is assigned to its particle
best. The best individual among particle best population,
with its dimension and fitness value, assigned to the
global best. Then a loop starts to converge to an optimum
solution. In the loop, particle and global bests are
determined to update the velocity first. Then the current
position of each particle is updated with the current
velocity. Evaluation is again performed to compute the
fitness of the particles in the swarm. This loop is
terminated with a stopping criterion predetermined in
advance. |
| Initialize Parameters |
| Initialize Population |
| Evaluate |
| Do{ |
| Find particle best |
| Find global best |
| Update velocity |
| Update position |
| Evaluate |
| } While (termination) |
OPTIMAL RECONFIGURATION USING BPSO |
| The distribution reconfiguration problem is essentially
the determination of status (open or close) of the switches
in the system, depending on desired performance
criterion, which, in this case, is the reliability of the power
supplied to the customers. The reconfiguration can be an
operational or planning problem. In the operating state of
a distribution system, the existing sectionalizing and tie
switches constitute the set of switches for which the
optimal statuses are to be determined. In the planning
stage, along with the existing switches in the system,
potential locations where new switches may be installed
need to be identified. For the present work, it is assumed
that the locations of the existing switches and the potential
new switches are known. The BPSO algorithm searches
through various possible set of switch configurations. At
each stage of the search process, reliability of the
reconfigured system is evaluated in terms of the chosen
reliability index. Constraint imposed on the feasibility of a
set of switch configuration is that the system should be
radial, and that the electrical connection from the feeder to
the end load should be maintained. |
| In the proposed implementation of the BPSO, the
position vectors of the particles represent the potential
solutions for the distribution system reconfiguration
problem. A fitness function needs to be defined to
evaluate the suitability of the solutions found by the
particles at each stage. The individual position vector of a
particle, pbesti , and the global best position vector gbest
are evaluated based on this fitness function. The objective
of the distribution system reconfiguration problem in this
paper is to maximize the reliability of the power supplied
to the customers. The fitness function therefore should
evaluate, for the position vector of each particle, (1)
whether the reconfigured system is feasible in terms of
network constraints, and (2) in case it is feasible, what is
the reliability of the power supplied to the customers. |
| 1. LOLE: Loss of load expectation (LOLE) is defined as
the average number of hours or days in a given period in
which the hourly or daily peak load exceeds the available
generating capacity. This is a measure of the adequacy of
the power supplied by one or morefeeders to the
distribution system. |
| 2. LOEE: Loss of energy expectation (LOEE) is the
expected energy (in MWhr) not supplied due to the loads
exceeding the available power supplied by the feeders. |
| The fitness function J (x) for using the BPSO is
formulated as follows: |
 |
| Where K is a large number assigned to the fitness
function if the position vector representing the set of
switch configurations is not feasible (i.e., the reconfigured
system is not radially connected); w1 and w2 are two
weights with values such that w1J1 and w2J2 are
comparable in magnitude. J1 and J2are the reliability
indices as shown below |
| J1=LOLE |
| J2=LOEE |
| The number of elements in the binary position vector x is
equal to the number of switches in the system. The
elements of xare defined as follows: |
 |
| The search process starts with a randomly selected binary
position vector x, i.e., each element of x is randomly
assigned a value of either 0 or 1. Using this switch
configuration, it is examined whether the network
constraints are being satisfied or not. If the switch
configuration fails to render a connected and radial
network, it is considered an infeasible solution, and a
large numerical value, K is assigned to the fitness
function. When the switch configuration satisfies the
network constraints, a Monte Carlo simulation is
performed, and the reliability indices LOLE and LOEE are
evaluated based on the reliability models of the
components that are involved in the network. The fitness
function is the weighted sum of LOLE and LOEE. |
SIMULATION RESULTS |
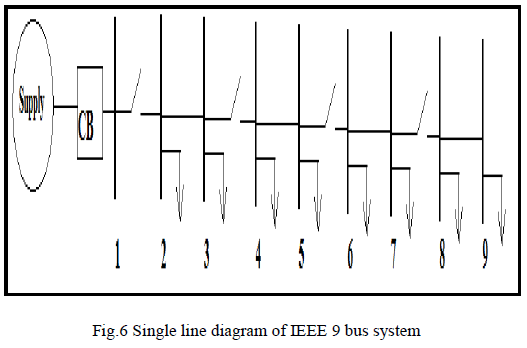
| The effectiveness of the proposed methodology is tested
on a 9 bus radial distribution system. The possible
location of switches is shown in Fig. 6. Each switch can
either open or close. The optimal status (open or close) of
the switches is determined by using computing techniques
of BPSO. For simplified analysis, it is assumed that the
reconfigured system should be radial, since the radiality
of the system is taken as a necessary constraint. |
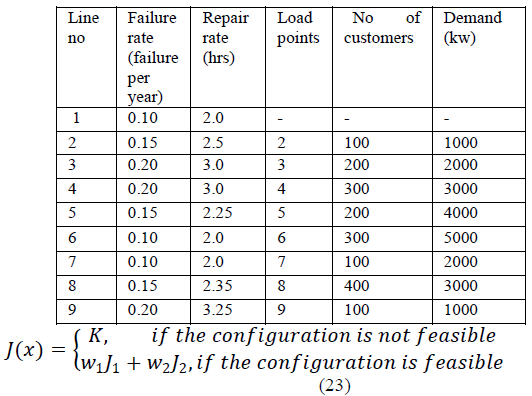
 |
| The table I shows the line and load data of IEEE 9 Bus
system.Bus 1 is taken as a slack bus. TABLE I |
 |
CONCLUSIONS |
| In this project, reliability of IEEE 9 bus radial
distribution system has been improved by Network
Reconfiguration using Binary Particle Swarm
Optimization (BPSO). Distribution system
reconfiguration methodology aimed at maximizing the
reliability by reducing the frequency and duration of
interruption power supplied to the customers. In the
present work, probabilistic reliability models of the
components are used to estimate the future behavior of the
distribution system in terms of the reliability of supplying power to its customers. Binary particle swarm (BPSO)
algorithm is used to determine the optimal statuses of the
switches in the distribution system. By using algorithm
BPSO fault rate of the equipment is reduced and the
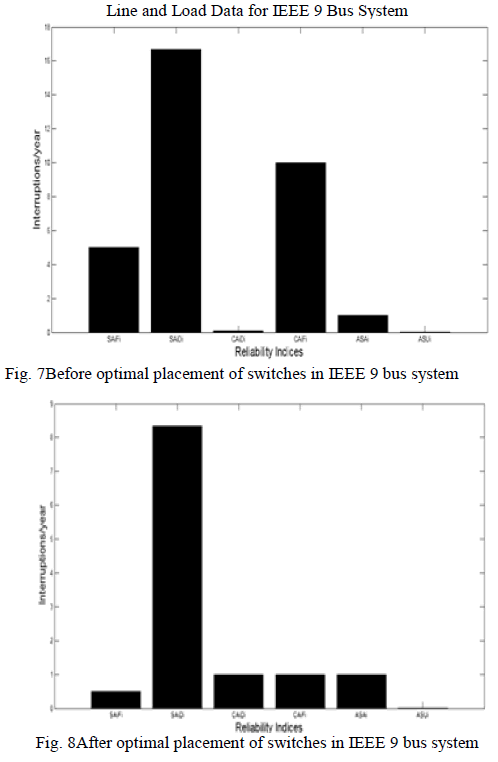
reliability is maximized. Thus frequency and duration of
interruptions are reduced after the optimal placement of
switches in IEEE 9 bus system and the Reliability is
improved. |
References |
- A.Moradi, M.Fotuhi-Firuzabad,andM.Rashidi-Nejad,- Areliability cost/worth approach to determine optimum switchingplacement in distribution systems, presented at the IEEE/powerEng.Soc.Transmission and distribution Conf.Exhibit:Asia andPacific, Dalian,China,2005
- Billinton, R., and Allan, R. N., "Reliability Evaluation of Powersystem Pitman Books, New York and London, 1984
- M. Tadayon and S. Golestani, ―A New Method for Optimal RCSPlacement in Distribution Power System Considering DGIslanding Impact on Reliability, IEEE Transmission &Distribution Conference &
- Exposition(Asia and Pacific), 2009, 26-30 Oct. 2009, Seoul.
- J. Kennedy and R. Eberhart, ―Particle swarm optimization, inProc. IEEE Int. Conf. Neural Networks, Perth, Australia, 1995,vol. IV, pp.1942–1948.
- B.E.Wells, C.Patrick,L.Trevino,J.Weir,andJ.Steinca,-Applyingparticle swarm optimization to a discrete variable problem on anFPGA based architecture,Presented at the MAPLDInt.Conf.,Washington,D.C.,2005.
- R. Billinton and R. N. Allan, Reliability Evaluation of PowerSystems. New York: Plenum Press, second ed., 1996.
- Power System Outage Task Force, “Final report on the August 14,2003 blackout in the United States and Canada: causes andrecommendations.” Canada, Apr. 2004.
- H. L. Willis, Power Distribution Planning Reference Book. NewYork: Mercel Dekker, Inc., second ed., 2004.
- M. E. Baran and F. F. Wu, “Network reconfiguration indistribution systems for loss reduction and load balancing,” IEEETrans. PowerDelivery, vol. 4, pp. 1401–1407, April 1989.
- S. K. Goswami and S. K. Basu, “A new algorithm for thereconfiguration of distribution feeders for loss minimization,”IEEETrans. Power Delivery, vol. 7, pp. 1484–1491, July 1992.
- B.Morton and I.M.Y. Mareels,”An efficient brute-force solution tothe network reconfiguration problem”,IEEETrans.PowerDelivery, vol. 15,no.3,pp.996-1000,2000.
- M. A. Kashem, G. B. Jasmon, and V. Ganapathy, “A newapproach of distribution system reconfiguration for lossminimization,” ElectricPower& Energy Systems, vol. 22, pp. 269–276, 2000.
- Abur, “A modified linear programming method for distributionsystem reconfiguration,” Electrical Power & Energy systems, vol.18, no. 7, pp. 469–474, 1996.
|