ISSN ONLINE(2319-8753)PRINT(2347-6710)
ISSN ONLINE(2319-8753)PRINT(2347-6710)
Thanga Kasi Rajan.S1, Balaji.A.N2, Udhaya Sankar.P3 and Vettivel.S.C4
|
| Related article at Pubmed, Scholar Google |
Visit for more related articles at International Journal of Innovative Research in Science, Engineering and Technology
Tungsten reinforced copper composite is one of the alternatives widely used in sliding contact and high voltage electric contact heat sink materials etc. Mechanical alloying accomplished by compaction, sintering and extrusion techniques were used to prepare the composite. It is necessary to know the tribological behavior of Cu-W composite material.Wear behavior depends on many parameters such as the weight percentage of tungsten, sintering temperature, load and sliding distance to predict multiple material characteristics such as hardness, wear volume, and coefficient of friction. This paper proposes to explain and monitor the wear behavior of Cu-W composite material using pin-on-disc test conducted under different sliding distance and at 20N load while the velocity remains constant. The SEM & XRD analysis will be used to evaluate the characteristics of Cu-10%W composite materials
Keywords |
| tungsten reinforced copper composite, Wear, coefficient of friction, SEM, XRD |
INTRODUCTION |
| Composite material system composed of two or more distinctly different insoluble materials. They have different physical and chemical composition. Due to high surface to volume ratio these materials provides improved mechanical properties. [1]. Many researches has been done to fabricate, synthesis and characterize the composite materials and few studies are carried out in Cu- W Composite materials. Though copper has high conductivity, its poor wear resistance makes it unsuitable for heavy duty applications. Further to improve the wear resistance, many reinforced materials such as Cu-W, Cu– Mo, Cu–Al2O3, Ag–Mo, Cu–SiC, Ag–W and Ag–CdO has been used. Of all, Cu-W reinforcement is found to be best due to its high wettability of W in Cu [2]. The fabrication and processing methods of Cu-W composite material are explained in [3]. Several techniques such as Powder Metallurgy (P/M), liquid metallurgy and squeezecasting are used to fabricate the Metal matrix composite [4, 5]. The P/M is the most common production technique for metal matrix composite material. It has several advantages over casting. The microstructure of the composite material produced by P/M shows a better distribution and good reinforcement. The pores on the parts are minimized by hot pressing. It has been effectively done since Cu – W Composite materials have good wettability [6]. Diffusion of atoms in solid state improves the growth of inter particle bolding. Hence diffusion of atoms have a major effect on the microstructure and improves mechanical properties. This diffusion process depends on sintering temperature and time. Extrusion process can also be employed for improving mechanical properties. The porosity and pore size can be reduced by extrusion process. The atomic bond between the two particulates in the metal matrix are formed by mutual dissolution of two particulates [7, 8]. |
| The addition of W as secondary reinforcement in Cu improves the wear resistance. The wear rate and wear mechanism of Cu is altered by the secondary reinforcement. The main factors that controls the wear rate are load, sliding distance, sintering temperature and reinforcement [9, 10]. |
| Wear resistance is an important engineering factor. So, the objective of this study is to produce 10 % W reinforced Cu composite material with good relative density with minimum porosity.Scanning Electron Microscope (SEM) evaluation is used for characterization |
 |
| In the present research work, the wear behavior of Cu and 10 % W reinforced Cu compositematerial is monitored using Pin on –disc type wear apparatus. The effect of sliding wear on 10% Cu-W composite material at 900º C sintering temperature, 20N load 1.41m/s sliding velocity under various sliding distances (400m, 800m, 1200m, 1600m, 2000m )was examined. |
MATERIAL PROCESSING METHOD |
| Copper and Tungsten powders were used in the present investigation. These powders were purchased from M/s. The Metal Powder Company (P) Ltd., Tirumangalam, Madurai, Tamilnadu, India. Electrolytic copper and atomized tungsten were obtained with 100% and 99% purity respectively. The characteristic of copper and tungsten powders are shown in the table 1. |
Mixing |
| Copper and tungsten powders were pulverized in High energy Ball mill to bring down the uniform size of copper and tungsten powders for P/M process. Four 10mm tungsten carbide balls were used in ball mill. Milling was done at 300 rpm in wet medium in the presence of toluene to prevent oxidation and agglomeration of the charge. Preparation of Cu-W composite mixer is important in the P/M process, Mechanical alloying method is one of the most suitable alloying method used in P/M process. In general, powder milling takes place in three steps. |
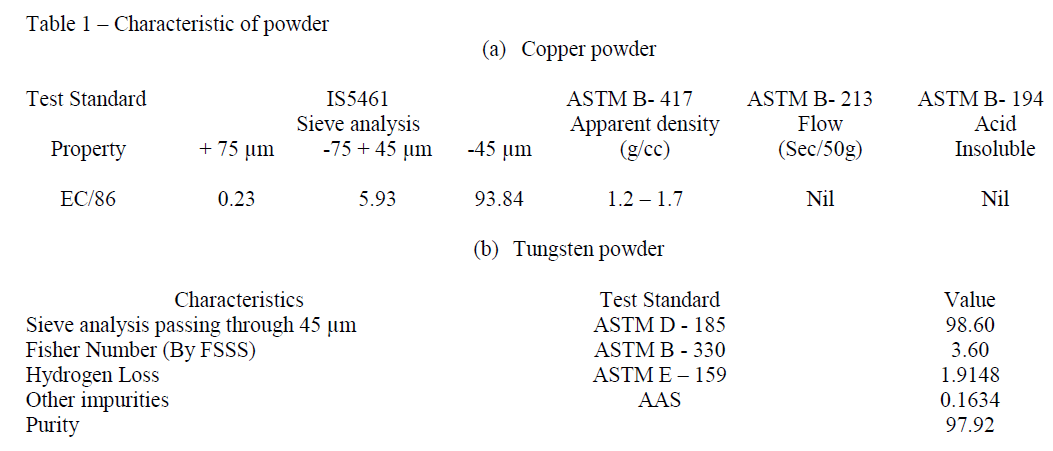
| The shape and structure of the particles are evaluated by SEM analysis after milling which is shown in fig 1(a & b). Fig 1(a) shows the structure of copper particles. It shows cluster of tiny particles with small flattened flake particles. It is due to severe plastic deformation and fracture of the large flakes during mechanical milling. Fig 1(b) shows the SEM image of 10% reinforced tungsten copper composite material |
| [11] and the pore measurement technique explained in |
| [12] is used to accurately control the relative density. |
Compacting |
| 20mm cylindrical compacts were prepared by using ball milled Cu and Cu-W powders. Universal testing machine was used to compress the composite powder by suitable punch and die set assembly. The compacting pressureis 1.2 GPa. Graphite was used as lubricant in order to avoid the sticking of composite powder on the side walls of punch and die assembly.Metal Powder Industries Federation (MPIF) standard 42 was used for compaction of preforms [14]. |
 |
Sintering |
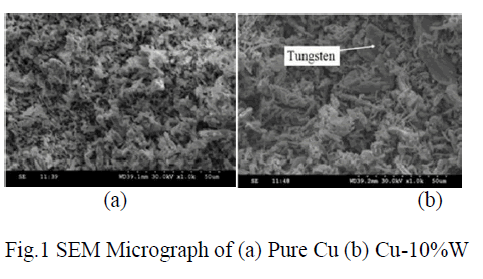
| After compaction, the compacts were taken out from the punch and die set assembly. The compacts were kept in the electric muffle furnace for sintering with inert argon atmosphere. This prevents the compacts from oxidization. The temperature was set to 900ºC in the electric muffle furnace. The duration of the sintering process was 1 hour after that the compacts are allowed to cool in the furnace for 24 hours to reach room temperature. The preforms were cleaned by using fine wire brush. Fig 2 shows the SEM image of sintered 10% reinforced Cu-W Composite material. After sintering the density of the composite material was measured by using Archimedes principle as described in ASTM B 32 standard [15]. Components produced by P/M will always have pores and the amount of pores depends on compaction load. [16, 17]. |
| Fig. 2(a) shows the SEM image of pure Cu and visible large size pores with presence of fewer oxides due to the atmospheric reaction. Fig.2 (b) shows the SEM image of Cu-10%W after sintering process at 900°C. From the image it is observed that the Composites also have larger visible porous and this is due to the presence of W. The pore area and pore perimeter is measured with the help of Auto CAD 2010 software [18] and the pore |
 |
Extrusion |
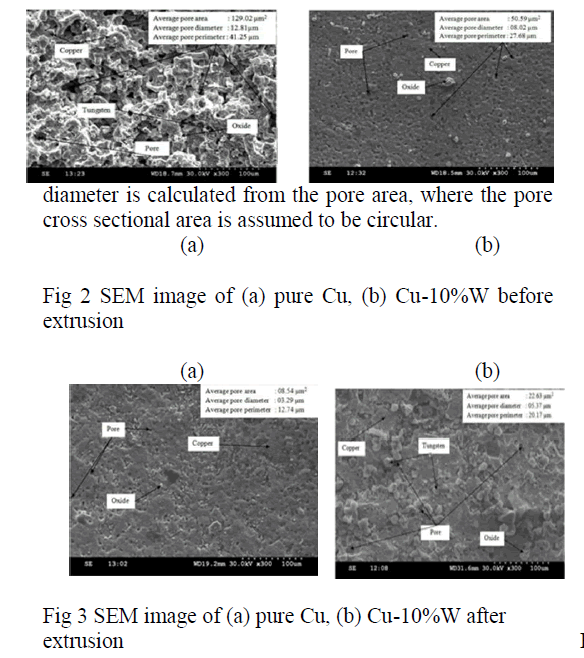
| Large pore sizes have been seen in the SEM image which increases the theoretical density. Hence extrusion operation was performed on the preforms. The process was carried out by extrusion die set assembly. The preforms are first heated to 400ºC in the electric muffle furnace with inert atmosphere. The diameter of the specimen was reduced to 12mm using extrusion die set assembly. The perform density was increased to 90%. Further the specimen was turned to 8 mm diameter. The specimens were polished by silicon carbide papers. Fig 3 shows the SEM image of the pure copper and 10% reinforced tungsten on copper after extrusion. |
X-ray Diffraction Analysis |
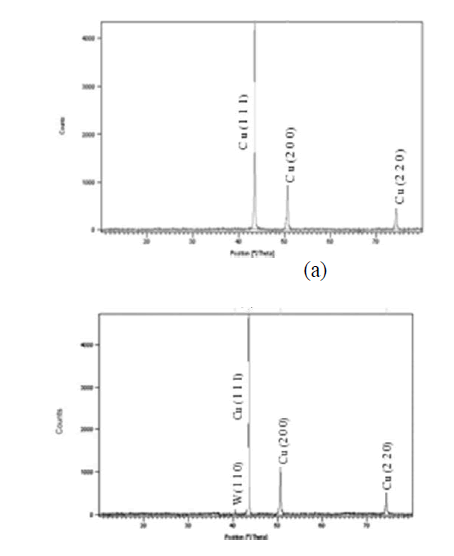
| X-Ray Diffraction (XRD) test was taken for the samples in order to determine the purity, phase and crystal structure of the samples [19]. Fig 5 (a& b) shows the XRD pattern of pure copper and 10% reinforced tungsten on copper. Peak values were collected over the 2θ range of 20-80° with a step size of 0.02°and step time of 4s. All samples show wide diffraction peaks, which could be indexed to the structure of Cu (JCPDS card No. 04-3493) and W (JCPDS card No. 07-6151). |
 |
| (b) |
| Fig 5 – XRD pattern of (a) pure Cu and (b) Cu-10%W |
WEAR TEST |
| Wear tests were conducted on the preforms using a pin on disk tester at dry condition (Model: ED- 201). Pin specimens of ASTM G99 were machined from P/M extruded billets [20]. Contact surfaces were cleaned by silicon carbide paper. It is then washed by acetone solution. A pin-holder loaded the stationary pins vertically on to a rotating EN 31 steel disc of hardness HRC 64. The experiments were conducted in room temperature. During sliding, the load is applied on the specimen and it is brought in intimate contact with the rotating disc at track radius of 70 mm. Five sliding distances as 400m, 800m, 1200m, 1600m and 2000m were chosen as experimental conditions at 20 N load and remaining parameters such as sliding velocity(1.41m/s), sintering temperature(900ºC), percentage reinforcement(10 % W) were considered to be constant for monitoring the wear behavior of Cu-W composite material. Composite material were successfully processed wear test using pin on disc were conducted. For each test the pins were carefully cleaned with acetone and weight loss was determined using a sensitive electronic balance with an accuracy of ± 0.1 mg. Volume loss was calculated form the weight loss data. The Coefficient Of Friction (COF) was computed from the recorded frictional force and applied load. |
 |
RESULTS AND DISCUSSION |
Densification by Extrusion |
| The porosity and pore size are key factors in determining the density of the composite material. Formation of pore on the composite material is due to the wettability of the material. The relative density of the Cu- 10%W composite was increased to the large extent after |
 |
| During sliding, the surfaces in contact at the disc surfaces were heated due to friction between the contact surfaces and also due the adhesion of flat regions of the sliding surfaces. It also shows the ploughing of particles due to wear and hard asperities were observed on the surfaces. |
 |
| extrusion. The reason for the creation of the pore is because of the entrapped gases diffused out from the sintered samples. In this section it is clearly explained how the pore area and pore size has to be reduced during the extrusion process. |
| Extrusion is mainly done to improve the wear characteristic. The SEM image of the composite before and after extrusion shows how the relative density is improved. Table 2 shows how the pore area, pore diameter and pore perimeter was reduced after extrusion.The SEM images shows clearly that the density of the specimen was increased by reducing the pore sizes in the extrusion process. |
Effect of friction coefficient on sliding distance |
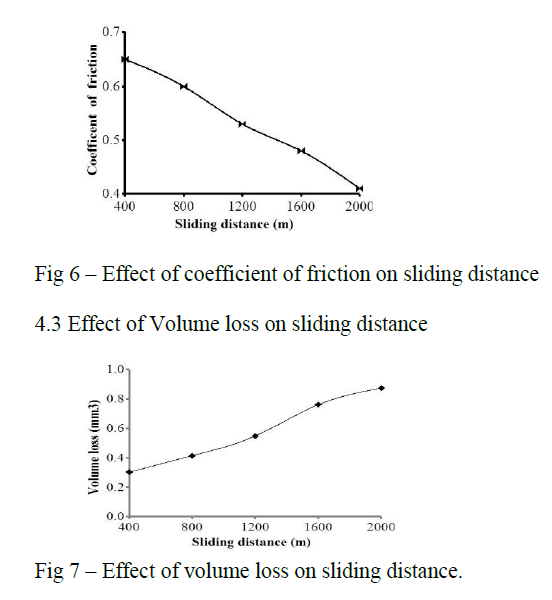
| Fig 6 represents COF as a function of sliding distance at applied load of 20 N to 70 mm of track radius and sliding velocity of 1.41 m/s for Cu & Cu-W composite. It shows the increase in sliding distance decreases the COF. |
| Fig 7 represents Volume loss as a function of sliding distance at applied load of 20 N to 70 mm of track radius and sliding velocity of 1.41 m/s for Cu & Cu-W composite. It shows that the volume loss increases with increase in sliding distance. During sliding, as the sliding distance increases the time of contact between the surfaces were also increased. Hence more volume loss will be there. |
CONCLUSION |
| In this study, the cylindrical preforms of Cu- W composite materials were produced successfully by P/M process. The extrusion process reduces the pore area, pore perimeter and pore diameter of the Cu-W composite material. The density of the Cu-W composite material was improved by extrusion in P/M process. Wear behavior of Cu-10%W was monitored at 20 N load to 70mm track, 1.41m/s Sliding velocity and 900ºC sintering temperature using pin on disc apparatus. |
| It is found from experiment that the extrusion process increases the density of the Cu-10%W composite material. Table 2 shows the values of the pore size, pore diameter and pore perimeter before and after extrusion process. |
| Wear behavior such as coefficient of friction and volume loss is monitored using Pin on disc apparatus. From fig 6 & 7 it is concluded that when the sliding distance increases, the coefficient of friction is decreased and the volume loss is increased. |
References |
|