The major goal of an electric power system is to provide its customers with a good service at a minimum cost and an acceptable reliability level. Power system reliability is based on two basic considerations, namely, adequacy and quality. This study investigates how to improve composite power system adequacy in the long- term. Specifically, to enhance system reliability level by using Power System Simulator for Engineering (PSSE), Static Var Compensators (SVCs) can be installed on each bus for the IEEERTS. It has been observed that the Expected Energy not Served (EENS) is reduced for all buses in the IEERTS, which means that the overall system reliability level has improved.
Keywords |
| SVC – composite power system reliability level - EENS (expected energy not served) -
PSSE, IEEE-RTS |
INTRODUCTION |
| Electric power systems are continuously operating systems. Regular maintenance is needed to keep
components in good condition and repairs are performed promptly in order to restore service.
Therefore, each component can be represented as a two-state model. At any time, a component can
reside in one of two states: in-service (available) and out-of-service (unavailable) [1].
The transition from available state to unavailable (outage)state is called a failure event, and is assumed
to occur at a constant rate λ (failures per year). The transition from the out-of-service state to the inservice
state is called a restoration event, and is also assumed to occur at a constant rate μ, in
restorations per year. The mean duration that the equipment is in service is m years, while the mean
duration that it is out of service is r years. The probability that the equipment is in-service is: |
 |
| The probability that it is out-of-service is: |
 |
| Thus, pin + pout =1. The unavailability pout is the index adopted and used to assess reliability of the
system; typically, its units are considered to be in hours/year or in minutes/year.
The frequency, F (occurrences/year) to transition from the in-service state to the outage state is equal
to the frequency of transition from the outage state to the in-service state, and is given by: |
 |
| The average duration, D (in hours or days) per year that the equipment is in the outage state is: |
 |
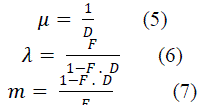
| HenceEq. (2), to represent the probability of an outage for this equipment, only two parameters are
required: F and D. Other characteristics can be derived from these two parameters: |
 |
| The methodology used in PSSE™ program [3]for probabilistic indices calculations is based on state
enumeration method . |
| The sum of probabilities of all states is equal to1. Probabilistic indices of system failures are computed
by identifying the set of states that satisfy failure criteria and the transition rates from any state inside
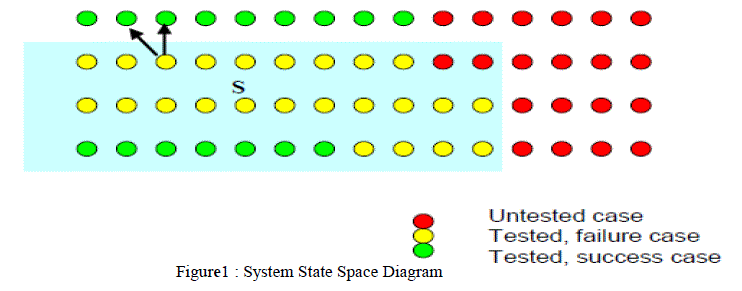
the set to any state outside of the set. In Figure 1, a yellow node represents a state that has violations;
all yellow ones form the set of states that satisfy failure criteria which is referred to as S. Failure criteria
include branch overloads, bus voltages outside high or low limits, bus change exceeding deviation criteria and loss of load. The red nodes represent the states that are not tested or has low probabilities.
and the green nodes represent success states. |
 |
| of system failure is defined as: |
 |
| Where pi is the probability of state I that satisfies failure criteria. The frequency of system failure is
defined as: |
 |
| Where Fijis the frequency of transition from state iinside the set to state j outside the set. Thedurationis
defined as: |
 The probability of a contingency is the product of in-service
probabilities of elements being in-service and out-of-service probabilities of elements being out-ofservice,
and is defined as: The probability of a contingency is the product of in-service
probabilities of elements being in-service and out-of-service probabilities of elements being out-ofservice,
and is defined as: |
 |
| The common factor, C can be defined as the product of in-service probabilities of all elements: |
 |
| and the normalized probability is defined as: |
 |
| The advantage of using the normalized probability is that probability calculation will not be subjected
to the double counting failure occurrences. |
| Now, the paper is organized as follows, Section 2 shows a probabilistic assessment process of load
curtailment by using the PSSE™ for a contingency of a certain probability that causes an overload on
a transmission element. Section 3 demonstrates probabilistic indices of load curtailment that are
assumed for full one year operation under present base case. Section 4 proposes some proper corrective
measures to deal with system conditions to be restored and comply with the prescribed operation limits.
Section 5 exhibits how reliability testing criteria for contingency analysis in planning and operations
criteria between electric power utilities in various regions and countries. Section 6 shows the outline of
the evaluation Procedure using an AC power flows for a single contingency analysis. Sections 7-9
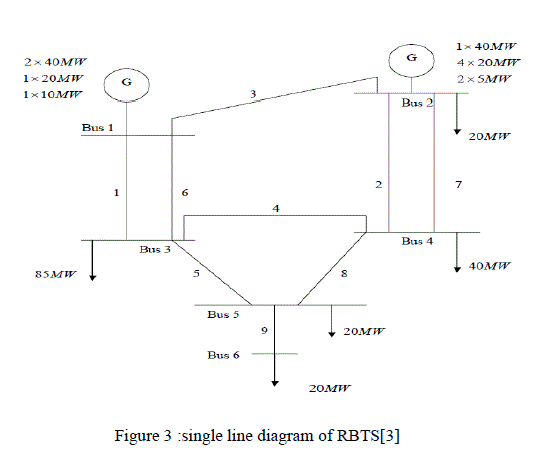
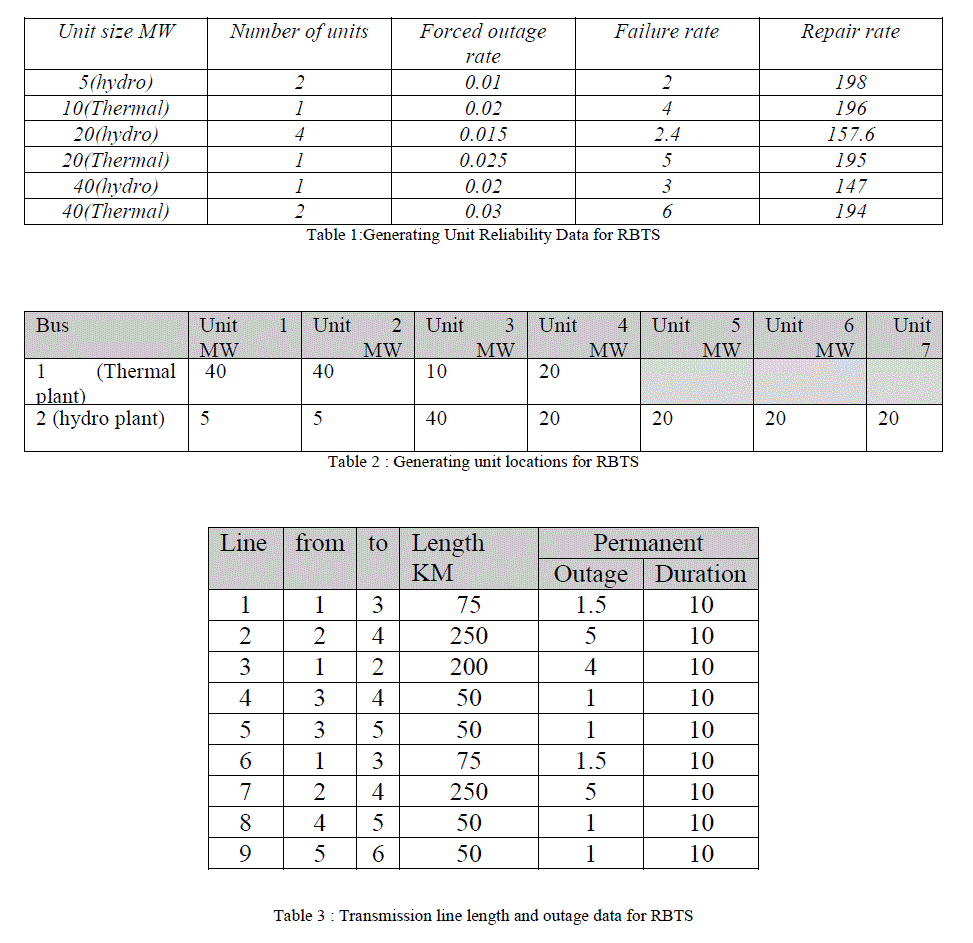
portray results, tables and discussions for using the RBTS (Roy Billinon Test System)in the analysis.
Section 10 presents discussions and conclusions based on the results obtained. Section 11 displays
number of references that were cited for this study. |
PROBABILISTIC ASSESSMENT OF LOAD CURTAILMENT |
| Another form of reliability assessment performed by PSSE™ is based on load curtailments due to
stochastic events. This type of assessment focuses on the impact of unreliability (energy curtailments)
on the customers. The basic premise in probabilistic assessment of load curtailment is the following: a
contingency of a certain probability that causes an overload on a transmission element may not, by
itself, of interest to the consumers. However, the consumers would be interested in knowing that the
same contingency if allowed to proceed unmitigated could result in curtailment of some or all of their
electrical demands. Hence, the objective of probabilistic load curtailment assessment is not one of
finding out the number and severity of system contingencies, but rather, of determining to what extent
consumers can be affected by the energy curtailment. This requires that the assessment proceeds
beyond identifying the problems by recognizing the actions that might be taken in order to mitigate
those possible problems occurrences. PSSE™ approaches this as an optimal power flow application
(i.e., corrective actions)[2]. |
PROBABILISTIC INDICES OF LOAD CURTAILMENT |
| It should be noted that the number of the indices are 'Energy' indices, in that they depend on an
assumed duration to which the base case applies. This duration is considered to be 8,760 hours (number
of hours per year).The following probabilistic indices is calculated for the system and its individual
buses. The Interrupted power (IP) in MW/year is defined as: |
 |
| Where, for system indices, P lold i is the total MW load lost in state I and for an individual bus, it is total
MW load lost at the bus, and Fi is frequency of state i.The Average Interrupted Power (AIP) in
MW/occurrence is defined as: |
 |
| The Expected Energy not Served(EENS) in MW.h/year is defined as: |
 |
| Two other indices may be of interest: the bulk power interruption index and the bulk energy
curtailment index. The Bulk Power InterruptionBPIindex is defined as: |
 |
| Where P loads isthe sum of the loadsin the study area. Similarly Bulk Energy not Served (BENS) is
defined as: |
 |
| All indices are based on an assumption of one full year (8760 hours) of operation under the present
base case. |
CORRECTIVE ACTIONS ANALYSIS |
| Some violations in operation limits such as flow overloading, bus voltage outside an acceptable range
under a contingency case are expected. The objective of the corrective action analysis is to find a set of
appropriate corrective actions by which the system condition is restored and comply with the
prescribed operation limits. In reliability assessment, corrective action analysis is required where
probabilistic indices are calculated, such as duration of loss of load, to model a complete sequence
from the severe outages to the complete restoration in secure and stable conditions. Corrective action
analysis is modeled as an Optimal Power Flow (OPF) with the objective of minimizing control
adjustments subject to operation limits. The data are obtained from two files, Subsystem Description
Data file and Monitored Element Data file, which are used in contingency analysis; beside using of
linear programming technique instead of non-linear programming. |
RELIABILITY TESTING CRITERIA FOR CONTINGENCY ANALYSIS |
| While there may be variations in planning and operations criteria between electric power utilities in
various regions and countries, there are significant commonalities among them. Typical steady-state
tests can include: |
| • Base case with all elements are in service. |
| • Single contingencies (N-1). Loss of any transmission line, transformer or generator. These are often
termed ’probable’ or ’credible’ contingencies. |
| • Double contingencies (N-2). Simultaneous loss of two single-circuit transmission lines, a doublecircuit
line or DC bipolar. Variations on these contingencies exist worldwide specifically with respect
to the definition of "double" circuit and the option of non-simultaneity of loss (N-1-1). These too are
’credible’ or ’probable’ contingencies. Less probable contingences and/or extreme contingencies can
include loss of entire substations or multiple generators.
Typical dynamic testing will include the same family of contingencies and are augmented by
representation of the severity of the initiating disturbance which results in the loss of system elements
(three-phase and single-phase faults with normal or delayed clearing times for example).
Acceptable system conditions prior to and subsequent to the contingencies depend on the severity of
the contingency and include: |
| • Voltages within defined normal or emergency limits. |
| • Changes in voltage within defined limits. |
| • Branch loadings within normal or emergency loading limits. |
| • Maintenance or loss of limited amounts of load. |
| • Maintenance of system integrity or breakdown into viable sections. |
| • Maintenance of transient and dynamic stability. |
| Such criteria are deterministic in the sense that the scenario being under testmust comply with the
acceptable system conditions or is considered to have failed the test. A failure implies the need for
additional system elements (for planning) or an adjustment of pre-contingency test conditions (for
operations). |
PERFORMING AC CONTINGENCY ANALYSIS |
| The network contingency calculation function calculates full AC power flow solutions for the user’s
specified set of contingency cases, monitors voltage and loading conditions and stores the results in a
binary file. Subsequently, this file can be processed to produce a variety of reports of voltage and
loading violations, loadings and available capacity. This feature is a powerful approach for testing large
systems with many possible contingencies specifically where the user wishes to monitor specific
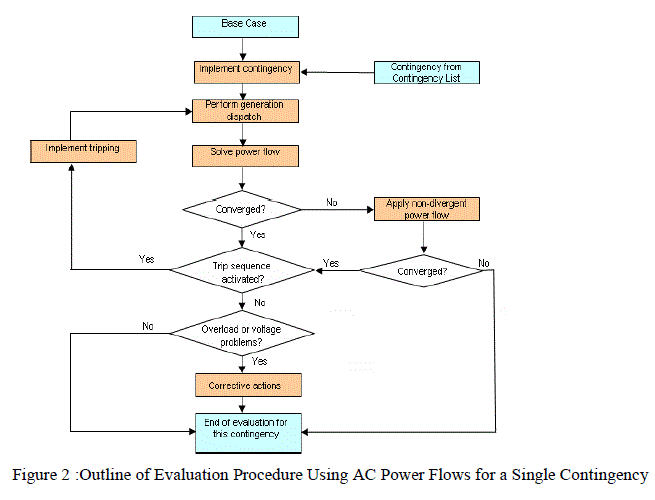
branches, interfaces or network areas for possible problems occurrences. The procedure of evaluating a
single contingency with multiple level contingency analysis is shown in Figure2. |
 |
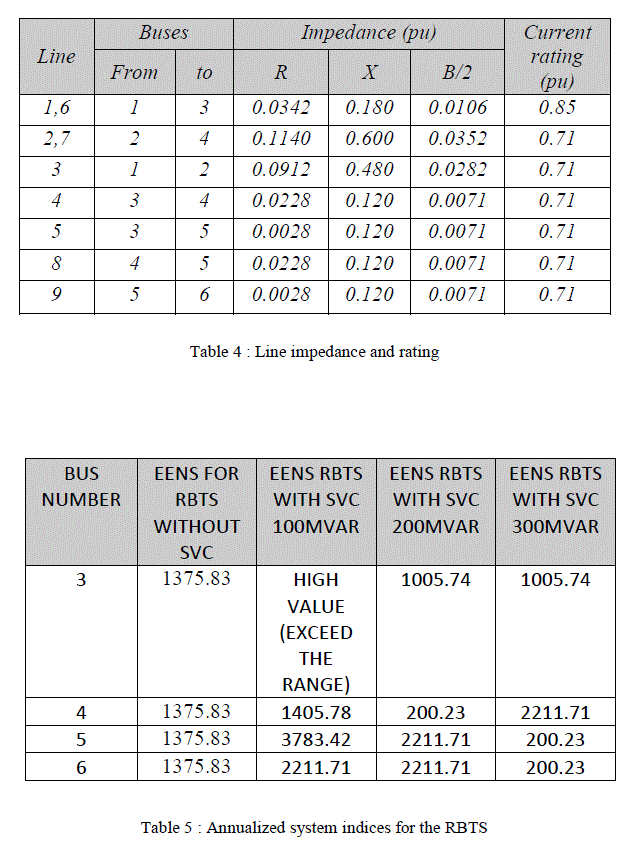
7-RBTS (ROY BILLITON TEST SYSTEM): |
 |
 |
 |
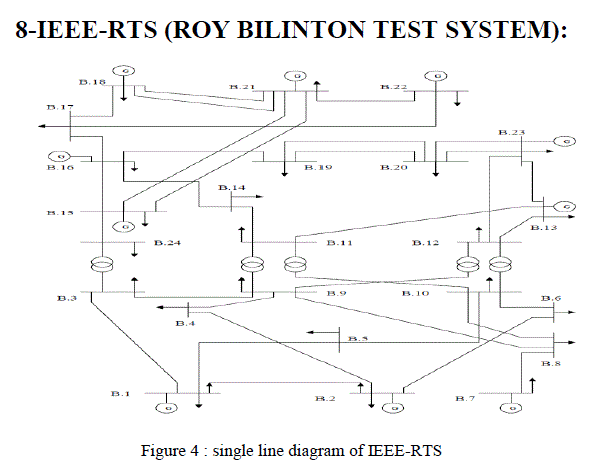
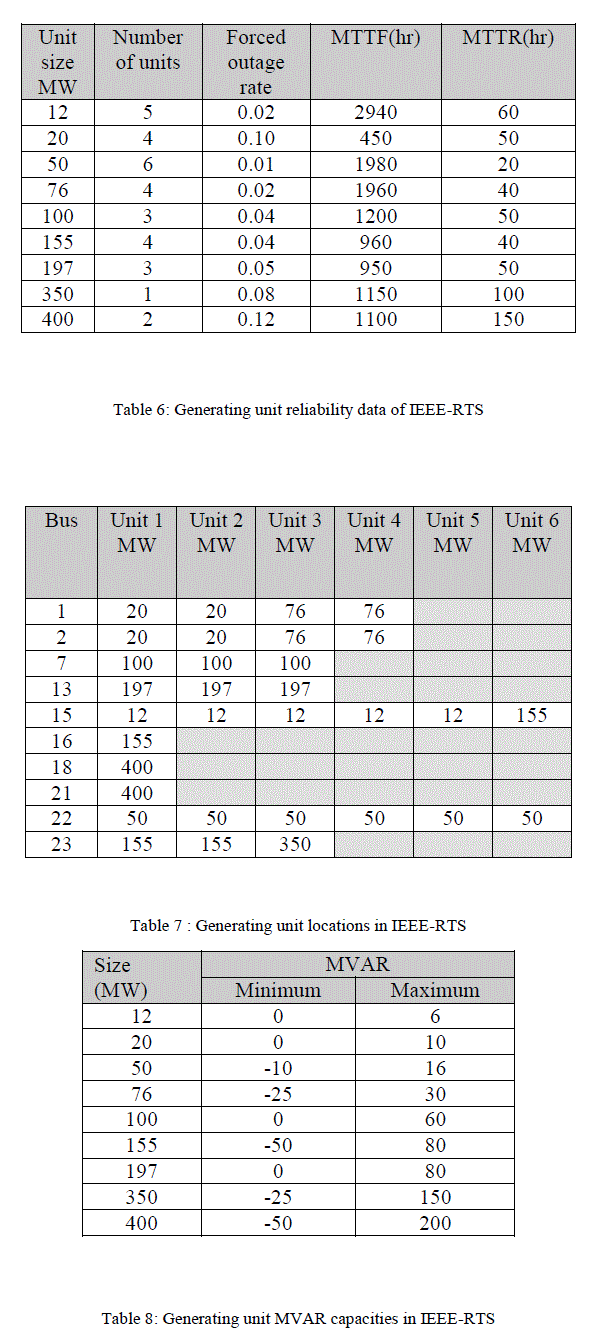
8-IEEE-RTS (ROY BILINTON TEST SYSTEM): |
 |
 |
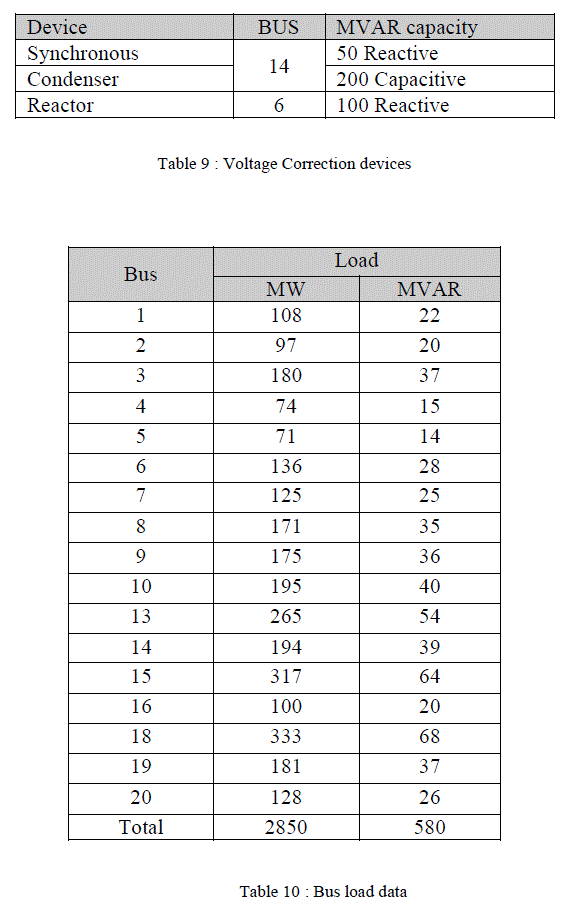 |
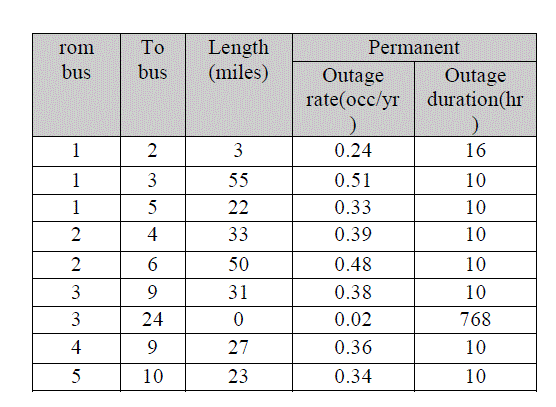
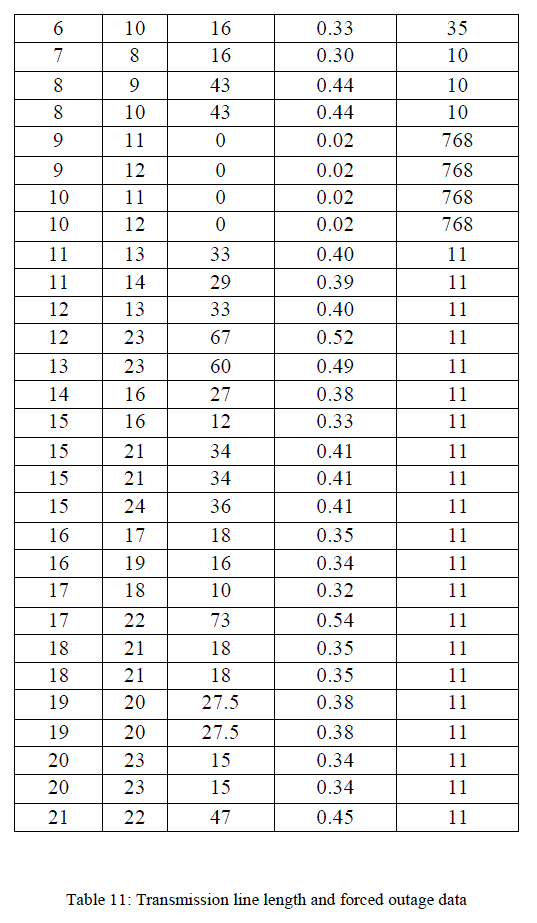
| In large systems[6], it is not practical to test SVC at each bus. Buses have to be selected according to
their higher voltage drop in steady state. PSSE31 has Q-V analysis features to determine buses that
have higher reactive power demand. |
 |
 |
9-QV ANALYSIS (QV CURVES) APPLICATIONS: |
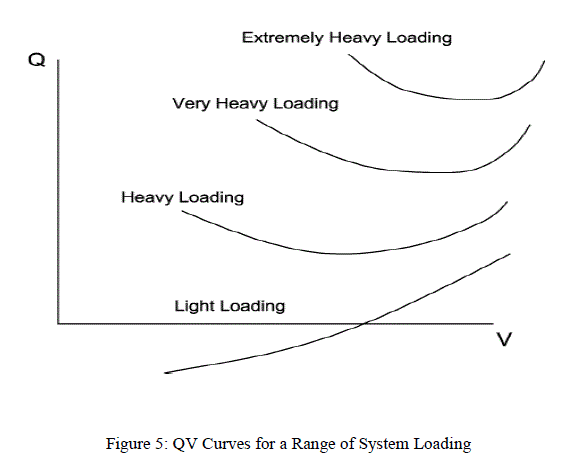 |
| Q-V analysis is designed for studies of low voltage stability, which could be analyzed as a steady-state
problem. They are load flow based analyses used to assess voltage variations with active and reactive
power changes.
QV curves are used to determine the reactive power injection required at a bus in order to vary the bus
voltage to the required value. The curve is obtained through a series of AC load flow calculations.
Starting with the existing reactive loading at a bus, the voltage at the bus can be computed for a series
of power flows as the reactive load is increased in steps, until the power flow experiences convergence
difficulties as the system approaches the voltage collapse point. Figure5 is a typical of the QV curves
that will be generated for a system that is stable at moderate loading and unstable at higher loading.
The bottom of the QV curve, where the change of reactive power, Q, with respect to voltage, V (or
derivative (dQ/dV) is equal to zero, represents the voltage stability limit. Since all reactive power
compensator devices are designed to operate satisfactorily when an increase in Q is accompanied by an
increase in V, the operation on the right side of the QV curve is stable, whereas the operation on the
left side is unstable. Also, voltage on the left side may be so low that the protective devices may be
activated. |
Q-V ANALYSIS FOR IEEE-RTS USING PSSE31 |
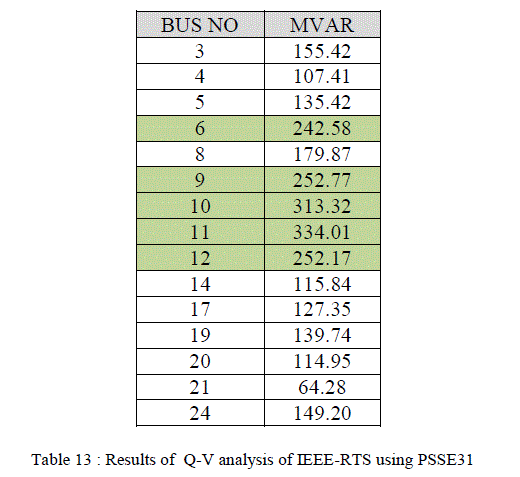
| Table13 is filled by run Q-V analysis in PSSE31 for all IEEERTS buses except generation buses at 1
pu voltage. According to the results of Q-V analysis, higher reactive power value at a bus means it is
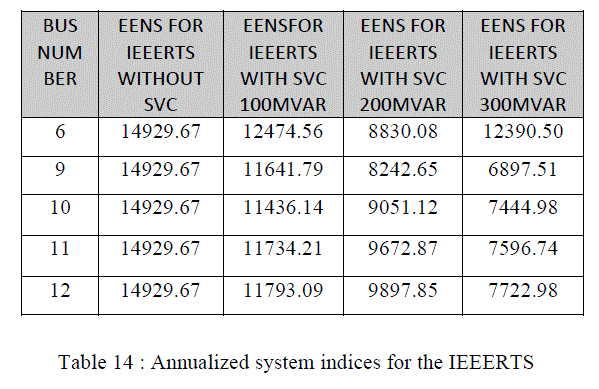
the most bus that needs reactive support. The most 5 buses that need SVC support are selected. To
study the effect of SVC on IEEERTS with respect to composite power system reliability. We will use
EENS (EUE). |
 |
 |
DISCUSSION AND CONCLUSION |
| RBTS EENS index is reduced from 1375.83 MWH to1005.74 MWH and 200.23 MWH by adding
SVC with 200 MVAR at buses 4 and 3, hence, the index is reduced to1005.74MWh and 200.23 MWh
by adding SVC with 300 MVAR at buses 3,5and 6.Reliability assessment is done with one SVC on
each bus at each run. Adding SVC with 200 MVARand 300 MVAR at other buses and adding SVC
with 100 MVAR for all buses increases EENS index. For the IEEERTS, EENS index is reduced by
adding SVC with 100 , 200 and 300 MVAR for all buses. According to the previous results, we notice
that the RBTS loads have no reactive loads,and SVC will increase reactive power flow and respectively
will increase apparent power flow (MVA) Eqn. (19). |
 |
| Current will decrease to maintain voltage leadingto reducing loading on lines and hence reducing load
curtailment (LK) which is a factor in reliability index EENS according to Eqn. 20and21 |
 |
| Where j ∈ x includes all contingencies resulting in line overloads which are alleviated by load
curtailment at bus K .j ∈ y includes all contingencies which result in an isolation of bus K .
The effect of SVC is appeared strongly in the IEEE-RTS which has both active and reactive loads.
-Network solutions (i.e. dc load flow, ac load flow, remedial actions, load curtailment policies and load
models) are the major factors associated with the process of composite power system adequacy
evaluation [6]. |
| Most of the present researches are concerning with the effect of the SVC upon power system stability.
However, the uses of SVC can be easily extended; the effect of SVC on load curtailment is illustrated.
The reduction of load curtailment for contingencies or heavy loaded situations can reduce the total cost
of the load shedding [5].The huge impact of the SVC on reliability levels indicates that an investment
in reactive power is an effective way to enhance these reliability levels. Using SVC rather than erecting
more transmission lines or building additional power plants to improve composite power system
reliability level is proposed and encouraged. Compared with establishing more lines or plants, the
employment of SVC is easy to implement. In the meantime, SVC can show significant effects on the
enhancement of reliability levels [4].SVC has the effect to reduce load curtailment either by installing
it at buses or in the middle of the lines. Annualized system indices are used instead of load point
indices to study effect of SVC on the system. |
References |
- Yang,F., âÃâ¬ÃÅA comprehensive approach for bulk power system reliability assessmentâÃâ¬ÃÂ, PhD thesis, Georgia Institute of Technology, 2007.
- PSS Program Application Guide, E-31.0: Volume I.
- Billiton, R., Kumar, N.,Chawdhury, Goel,L.,"Reliability test system for educational purposes âÃâ¬ÃâBasic Results", IEEE Transaction on power systems, Vol. 4, No. 3, 1991.
- LI, Yishan, "Short-termAnd long-term reliability studies in deregulated power systems" PhD" thesis, Texas & M University, 2005.
- Huang, G.M., "The Impacts of TCSC and SVC on Power System Load Curtailments", Power Engineering Society Summer Meeting, Vol.1, pp. 33-37, 2001.
- Weighing, R.,"Reliability evaluation of bulk power systems using analytical and equivalent approaches", "PhD thesis , university of Saskatchewan âÃâ¬Ãâ Saskatoon, 1999.
|