ISSN ONLINE(2319-8753)PRINT(2347-6710)
ISSN ONLINE(2319-8753)PRINT(2347-6710)
Biju B1, Vijayan N.2
|
| Related article at Pubmed, Scholar Google |
Visit for more related articles at International Journal of Innovative Research in Science, Engineering and Technology
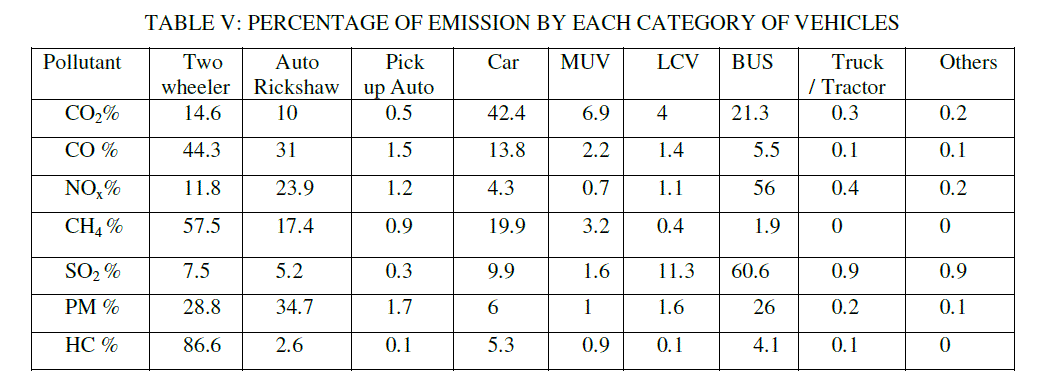
The air quality of Thiruvananthapuram city is assessed and it falls in the border range of moderately polluted. The principal component of pollution in the city is suspended particulate matter. The trends of API values show high fluctuations according to the season. Traffic volume study shows that two wheelers are the major contributors of carbon monoxide, methane, particulate matter and hydrocarbons. Carbon dioxide is mainly contributed by cars and nitrogen dioxide and sulfur dioxide by buses. The health effects due to the exposure to PM10 of 75 (μg/m3) is evaluated using dose-response coefficient and it found that the mortality and morbidity effect is very severe and need immediate attention of authorities
Keywords |
| Air quality, traffic pollution. PM10 , SPM and RSPM |
1. INTRODUCTION |
| Air pollution has been a major problem in cities all over the world. The fast phase economic growth in the course of rapid urban development is causing serious air pollution problems in many cities throughout India.[14]. According to source apportionment studies conducted by Central Pollution Control Board (CPCB) 2010, India; in cities like Delhi, Kanpur, Bangalore, Pune, Chennai and Mumbai shows that transport sector contributes to more than 70% of the ambient air pollution. These contributions are either direct from vehicular exhaust or indirect through re-suspension of road dust due to vehicular movement. |
| The scientific evidence about the health effect of air pollution is compelling [1]. The longer and more intense the exposure of people to air pollutant like particulate matter (PM), nitrogen oxides, carbon monoxide, sulphur dioxide etc then grater the impact on their health. The effect ranges from miner eye irritation, respiratory symptoms, to decreased lung and heart function, hospitalization and even premature death. Studies in India and other countries consistently showed these facts [2]. In Delhi, the Directorate of Economic and Statistics [5] recorded an increase of death rate from 11.4% to 20.4% in certified death due to cardio vascular diseases and an increase from 3.8% to 4.6 % in certified death due to respiratory symptoms between the year 2006 to 2010, both of which have direct linkage to pollution. A number of studies have been conducted about air quality at different locations of Thiruvananthapuram. Most of these studies have been restricted to stand alone studies and were aimed at detecting the prevailing air quality levels. For instance these studies have not quantified the health impact associated with the current pollution level in the city. The present study has been designed to address these concerns. |
| The main objectives of this study are , asses the ambient air quality, develop correlations to understand their inter relationship. Estimate the traffic volume, emissions load, and the health impact due to air pollution. |
II.RELATED WORKS |
| Estimating the health benefits of air pollution reduction through dose-response relationship was suggested by Ostro (1994). Alberini and Krupnick (2000) defined health production as a function of pollution and averting activities and estimated the cost of illness and willingness to pay. In the context of South Asia, Murty et al. (2003) and Gupta (2008) estimated the benefits from a reduction in urban air pollution in the Indian Subcontinent with primary data from Delhi and Kolkata, and Kanpur, respectively. Tanzir (2010) estimated the morbidity costs of vehicular air pollution in Dhaka, Bangladesh, using the Cost-of Illness approach. This study follows the guidelines laid by United Nations and World bank for evaluating the health impact of ambient air pollution in Thiruvananthapuram city. |
III. MATERIALS AND METHOD |
| a) Study Area: |
| Thiruvananthapuram, the capital city of Kerala located in the south-western tip of India, situated between north latitudes 8° 17' to 8° 54' and east longitudes 76° 41' to77° 17'.As per the Census report 2011, the district has a population of 16, 87,406 of which 815,200 are males and 872,206 are females. The urban or metropolitan population is 752,490. There were 31,156 boys and 30,463 girls. |
| b) Air Pollution index |
| Air pollution index is an overall scheme that transforms the weighted values of individual air pollution related parameters in to a single number. In India context most commonly used Air pollution Index is a four parameter model as shown in Equation 1[11]. |
 |
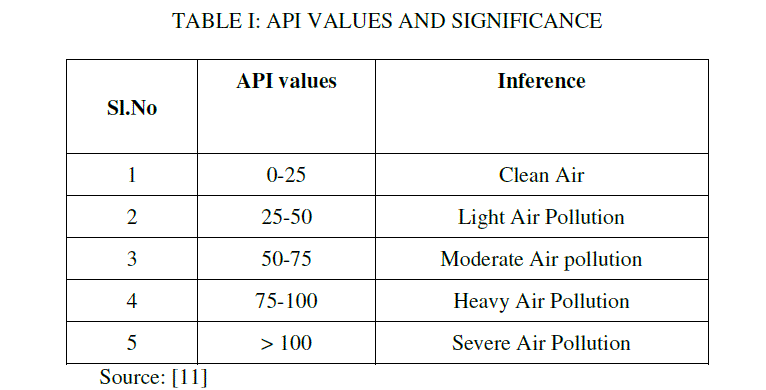
| Where SO2, NO2, SPM and RSPM are measured values, SSO2 , SNO2, SSPM and SRSPM are Standard Values as per national Air quality standard 2009. The range of air quality index and its interpretations are given in table-I |
 |
| Meteorological data including temperature, wind speed and relative humidity were collected from meteorological department. The background concentrations of pollutants, mainly PM10, SPM SO2and NO2 were determined using high volume sampler method [7]. |
| c) Estimation of Traffic volume and emissions |
| Traffic counts were performed during the period of December, 2013 to March, 2014 and the time span chosen for study is everyday 7:00 to 19:00 to capture the peak hours. The traffic volume survey was conducted as per IRC guidelines. The vehicles are classified into seven categories such as two wheeler, three wheeler auto, goods carrier, multi utility vehicles (MUV), light commercial vehicles (LCV), buss, truck, trailers and others. Vehicular emissions were calculated using the hourly traffic volume and the average emission factors. The source strength was computed for each of the pollutant as: |
| Q (g/km/hr) = N (No/hr) x EF (g /km)…………………………………………………………. (2) |
| The daily traffic is estimated using the equation |
| Total daily traffic= Peak hour traffic x 10……………………………………………………… (3) |
| The emission factors were compiled from various literatures including regulatory agencies like CPCB and research institutes like ARAI, NEERI, etc. The hourly traffic census has been conducted for 12 hours at roads in the seven study regions. The vehicles are classified into nine major groups, for which emission factors are developed by AIRI, Pune. The traffic census, at 15 minutes intervals for 12 hours, was carried out on weekday. Point source emission from major industries is estimated using the data collected from Kerala State Pollution Control Board. The major industries coming in the study area are, M/s Travancore Titanium products, English India Clay limited, Filatex industries, Vijayamohini Mills, HLL Lifecare ltd. |
| d) Health Effects Estimation of PM10 |
| Studies across the world show that there is a significant association between concentration of air pollutant and adverse health impact and economic loses [10]. Among the different form of air pollutants, suspended particulate matter is the most lethal in terms of health effects [13]. United Nations’ air pollution measurement tool is useful to estimate the health effects of PM10 on the urban population. It is based on a WHO methodology for estimating air pollution health effects. It can be applied to individual cities for such estimations. Although there may have health effects due to the exposure of PM10 below 30μg/m3 , The dose-response coefficients only allow estimating the effects of PM10 above30μg/m3. The predicted health effects can be calculated using the related formulas is given table II. |
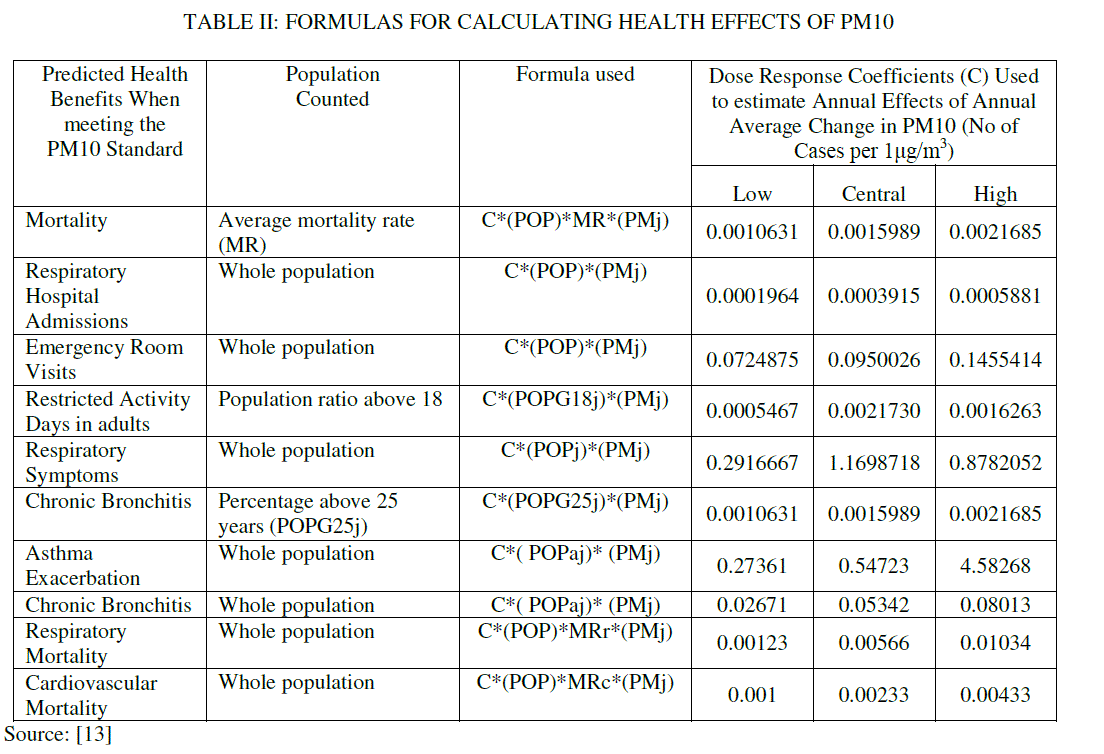 |
| The parameters in the equation are: |
| POPGj = population area j |
| POPG18j = population greater than age 18 in area j |
| POPG25j = population greater than age 25 in area j |
| PMj = change in annual average PM10 in area j |
| POPaj = asthmatic population in location j |
| MR = mortality rate |
| C = dose response coefficient |
| MRr = Mortality rate due to respiratory diseases |
| MRc = Mortality rate due to cardiovascular disease. |
| Dose response is the change in effect on an organism caused by differing levels of exposure to a substance. Studying dose response, and developing dose response models, is central to determining "safe" and "hazardous" levels and dosages for potential pollutants and other substances that humans are exposed. The dose response coefficient C for calculating PM10 effects were also listed in table II. |
III. RESULTS AND DISCUSSION |
| a) Air quality analysis |
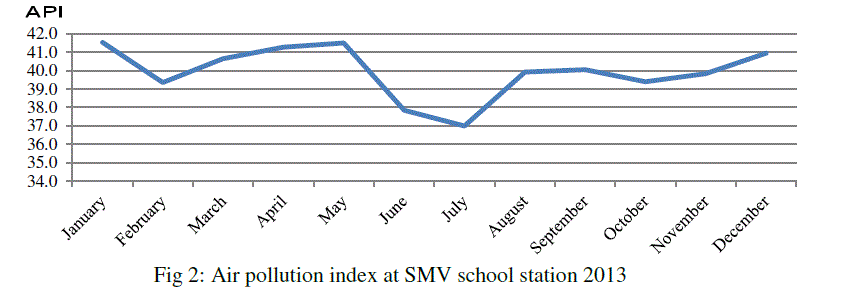
| The analysis of air quality data of the city shows that the principal component exceeding prescribed limit is suspended particulate matter. Average day time concentration of SPM in the study area is found as 75 μg /m3. As per the API analysis, the air quality of Thiruvananthapuram falls in the border case moderate air pollution. Fig 2 shows high fluctuations according to the season. Highest at summer and lowest in monsoon owing to the contributions of variation in suspended particulate matter concentration. |
 |
 |
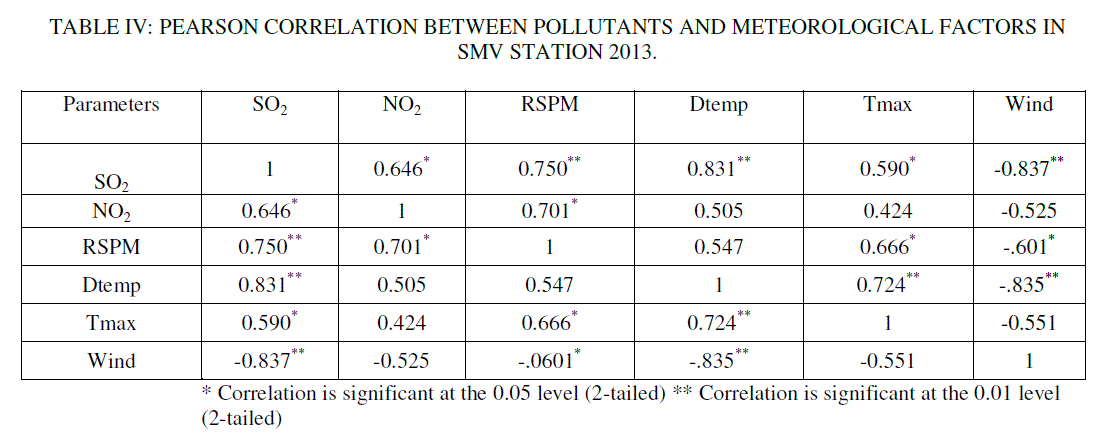
| The air quality index shows a strong seasonal variation, the correlation between pollutant concentration and meteorological factors are analysed. The Pearson correlation between pollutants and meteorological factors of SMV station in 2013 is given in table IV: The results show strong positive correlation for all parameters except wind velocity. Wind velocity shows a strong negative correlation. As the wind velocity increases the dispersion of pollutant become faster. Among the four pollutants SO2 shows the strongest dependency with environmental parameters. Its correlation with RSPM and Differential temperature are significant at 0.05 levels and with NO2 and Maximum daily temperature is significant at 0.01 level for a two tailed test. |
| b) Traffic volume and emission |
| The traffic volume study shows that most number of vehicles counted is two wheelers followed by cars, Auto rickshaws, Buses, MUV and LCV. The percentage wise distribution is given in fig :3. |
 |
| Estimated percentage of emission by each category of vehicles is given in table V. Among the type of vehicles, two wheelers are the major contributors of carbon monoxide, methane, particulate matter and hydrocarbons. The major percentage of carbon dioxide is contributed by cars. The major percentage of nitrogen dioxide and sulfur dioxides are contributed by buses. |
 |
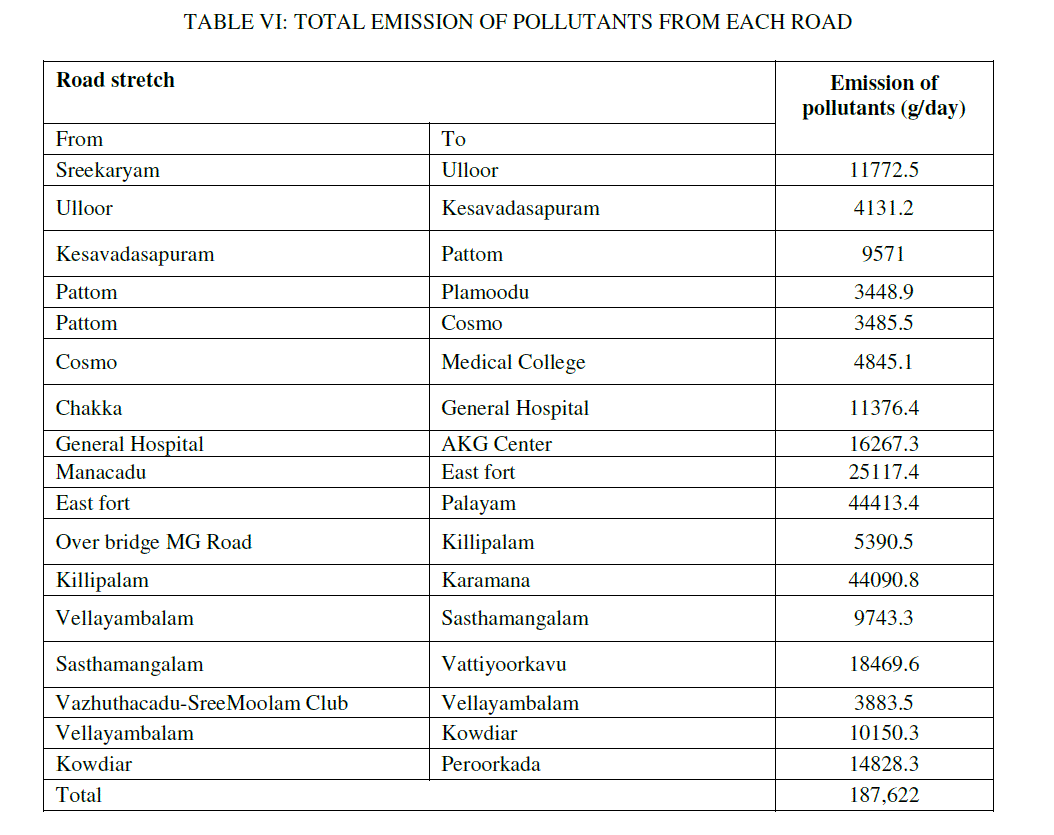
| The highest vehicle density was observed in East fort to Palayam road stretch. Peak hour traffic varies from 8.30o to 10.30. in each stretch. Total gaseous pollutant emission per day from each stretch is estimated and given in table VI. |
| East fort -Palayam road was found as the source of highest emission of gaseous pollutants due to high concentration of two wheelers in the stretch. The 95% gaseous pollutants emitted by automobiles are Carbon dioxide and which is followed by Carbon monoxide 2.56% , volatile hydrocarbons and nitrous oxide. Since the automotive fuel used in the city are complied to Euro-III (Bharath stage-4) the sulfur dioxide concentration is significantly less. Total emission of pollutants from each road in the study area were evaluated and listed in table VI. The highest vehicle emission load was observed in East fort to Palayam road stretch followed by Manacadu to East fort stretch. |
 |
| d)Health Effects Estimation of PM10 |
| The health effects due to the exposure of PM10 of 75 μg/ m3 by using dose-response coefficients effect on city population are estimated. The input data required for the estimation of health effects model for PM10 is given in table VII. The population and average mortality data were collected from the senses department, Ratio of asthmatic population, Average Mortality Rate on Respiratory Diseases and Cardiovascular Diseases etc are obtained from Directorate of health services. Estimated health effects were tabulated in table VIII. The central estimate of no of cases per year is 379 Premature Mortality, 677 Respiratory Hospital Admission, 13263 Emergency room visit, 1914617 Restricted Adult Activity Days , 37023 Acute Bronchitis in Children, 18398 Asthma Exacerbation 2,27,925 Respiratory Symptoms, 1796 Chronic Bronchitis 161 Respiratory Mortality, 237 Cardiovascular Mortality. The economic cost of this impacts are enormous. |
 |
IV. CONCLUSION |
| The air quality in Thiruvananthapuram city belongs to moderately polluted category. The pollutant, especially SPM shows high fluctuations according to the season. The average day time suspended particulate matter in the city is estimated as 75 μg/ m3. The correlation between the pollutants and meteorological factors are strong and positive for all parameters except with wind velocity. Wind velocity shows a strong negative correlation. |
| Emission from each category of vehicle is estimated, based on traffic volume survey. It was found that two wheeler are the major emitters of carbon monoxide, methane, particulate matter and hydrocarbons. Most of carbon dioxide emitted by cars, nitrogen dioxide and sulfur dioxides by buses. Peak hour traffic in the city varies from 8.30o to 10.30 depending upon the stretch. The highest vehicle density was observed in East fort to Palayam road, which is also the source of highest emission of gaseous pollutants due to high concentration of two wheelers in the stretch. The emission from major industries in the study area are also evaluated and found that the major constituents are SPM and SO2. |
| The health effects due to the exposure of PM10 using dose-response coefficients show that the effect is severe in terms of mortality and morbidity parameters. The authorities need to develop an action plan for progressively reducing the PM10 concentration level with in the specified limit. It needs a multipronged approach encompassing technical, institutional and behavioural intervention. |
References |
|