ISSN ONLINE(2278-8875) PRINT (2320-3765)
ISSN ONLINE(2278-8875) PRINT (2320-3765)
Pavan Khandelwal1 and Prof. M.P Parsai2
|
| Related article at Pubmed, Scholar Google |
Visit for more related articles at International Journal of Advanced Research in Electrical, Electronics and Instrumentation Engineering
This paper discusses the quantitative measure for the various types of carcinogenic abnormalities in specific part of the body. In this paper we have developed the mathematical function of MRI (Magnetic Resonance Imaging) images normal and abnormal human lungs. The Abnormalities have been discussed in frequency domain. There is a crystal clear demarcation in abnormal area in histogram of normal MRI image. And it’s Fast Fourier transform image of stem graph. These Mathematical functions can lead to quantitative method of evaluating disease and hence providing appropriate therapy
Keywords |
| Discrete Fourier Transform, Frequency domain, Human lungs, Magnetic resonance imaging |
INTRODUCTION |
| MRI is short form Magnetic Resonance Imaging. It is a procedure used in hospitals to scan patients and determine the severity of certain injuries. MRI of the lung is recommended in a number of clinical indications. Having a non-radiation alternative is particularly attractive in children and young subjects, or pregnant women. An MRI machine uses a magnetic field and radio waves to create detailed images of the body. A strong magnetic field is created by passing an electric current through the wire loops. While this is happening, other coils in the magnet send and receive radio waves. This triggers protons in the body to align them. Once aligned, radio waves are absorbed by the protons, which stimulate spinning. Energy is released after "exciting" the molecules, which in turn emits energy signals that are picked up by the coil. This information is then sent to a computer which processes all the signals and generates it into an image. Unlike CT scanning or general x-ray studies, no ionizing radiation is involved with an MRI. Magnetic resonance imaging (MRI) is done for many reasons. It is used to find problems such as tumours’ bleeding, injury, Blood vessel diseases or infection. MRI also may be done to provide more information about a problem seen on an X-ray, ultrasound scan, or CT scan. MRI of the chest can look at the heart, the valves, and coronary blood vessels. It can show if the heart or lungs are damaged. MRI of the chest may also be used to look for breast or cancer. Magnetic resonance imaging (MRI) of the lung has been a challenge due to limitations such as low proton density in the lung and the fast signal decay due to susceptibility artefacts at air-tissue interfaces. |
| The key technique for MRI of lung morphology is based on the resonant high-frequency signal of protons in tissues and liquids, so-called proton-MRI or 1H-MRI. The recent technical advances have helped MRI to challenge its well-known limitations as they are defined by low proton density in the lung and the fast signal decay due to susceptibility artefacts at air-tissue interfaces [6]. The human lungs are the organs of respiration in humans. The main function of the lungs is to allow oxygen from the air to enter the bloodstream for delivery to the rest of the body [10]. |
| Lung cancer is caused by uncontrolled cell growth in tissues of the lung. If left untreated, this growth can spread beyond the lung in a process called metastasis into nearby tissue and, eventually, into other parts of the body. Image processing is one of most growing research area these days. In the following we are proposing an effective scheme to detect abnormal formation of cells in the lungs. |
| Lung cancer is the most common cancer which occurs for both men and women. According to the report submitted by the American Cancer Society in 2003, lung cancer would report for about 13% of all cancer diagnoses and 28% for all cancer deaths. The survival rate for lung cancer analysed in 5 years is just 15%. If the disease is identified while it is still localized, this rate increases to 49%. |
EXPERIMENTAL WORK |
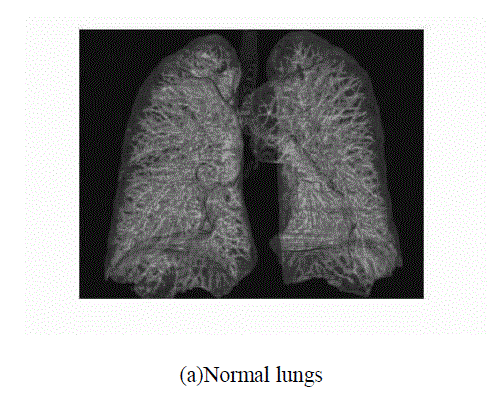
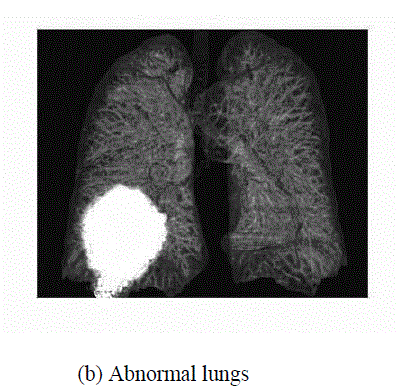
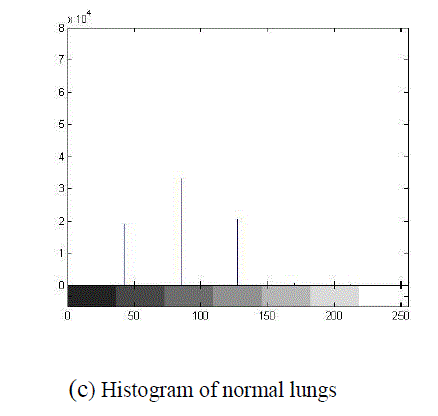
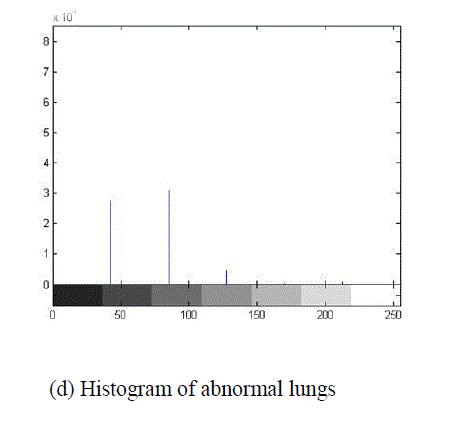
| In this experiment we take a MRI image of normal lungs and abnormal lungs. And take a histogram graph and stem graph of images using the Mat lab Programming and analysis the graph for various diseases. |
 |
 |
 |
 |
 |
 |
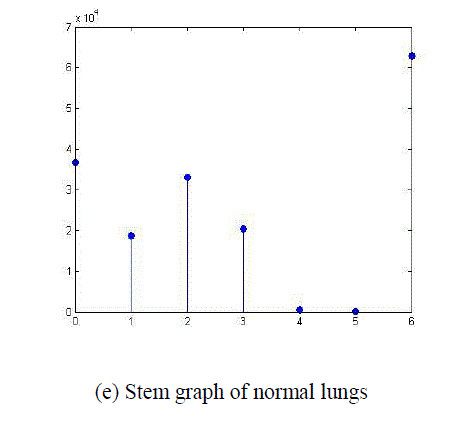
| In above figure shows (a) normal lungs (b) abnormal lungs(c) histogram of normal lungs (d) histogram of abnormal lungs (e) stem graph of normal lungs (f) Stem graph of abnormal lungs |
MATHEMATICAL ALGORITHM |
| In this we convert the stem graph into a mathematical function by using Fast Fourier Transform with the help of matlab programming. First convert for the normal image and its value and corresponding fft obtain by the Matlab. we developed a mathematical algorithm for Normal and Abnormal MRI images of human lungs. To analyse images (As shown in above fig.1) we used Discrete Fourier Transform. This transform is useful to map the time domain sequence into a continuous function of a frequency variable. |
| Definition- Let x (n) be a finite duration sequence the N point DFT of the sequence x (n) is expressed by- |
| Where K = 0, 1, 2……………N-1 |
| Using above DFT equation we have converted time domain sequence into frequency domain of MRI normal and abnormal images of human lungs. For that we have taken stem graph of normal and abnormal images which is show in fig1.(e) and (f) . |
| Discrete time sequence of Normal Image stem graph x (n) = [3.6 1.8 3.3 2.0 .0614 .0010 6.29]*104 Discrete time sequence of Abnormal Image stem graph x (n) = [3.86 2.74 3.08 .45 .0442 .0572 7.017]*104 By using Eq. No.1 we convert the stem graph discrete time finite sequence values of normal image into corresponding Magnitude and Phase. |
| A. Normal Lung: |
| The stem value of normal lung |
| >> x= [3.6 1.8 3.3 2.0 .0614 .0010 6.29]*104 |
| x = 3.6000 1.8000 3.3000 2.0000 0.0614 0.0010 6.2900 |
| >> y= [7] |
| >> n=fft(x, y) |
| n =Columns 1 through 4 |
| 17.0524 6.0522 - 0.5470i 0.1110 + 7.3245i -2.0894 + 2.6374i |
| Columns 5 through 7 |
| -2.0894 - 2.6374i 0.1110 - 7.3245i 6.0522 + 0.5470i |
| The corresponding amplitude value is given by |
| l x (k) l= {17.0524, 6.0768, 7.3253, 3.364, 3.364, 7.3253, 6.0768}*104 |
| And the corresponding phase value is given by |
| {0,-5.164, 89.13,-51.61, 51.61,-89.13, 5.164} |
| B. Abnormal Lungs: |
| The stem value of abnormal lungs |
| >> x= [3.86 2.74 3.08 .45 .0442 .0572 7.017]*104 |
| x = 3.8600 2.7400 3.0800 0.4500 0.0442 0.0572 7.0170 |
| >> y= [7] |
| >> n=fft(x, y) |
| n = |
| Columns 1 through 4 |
| 17.2484 8.8000 + 0.2208i -0.8295 + 5.7986i -3.0847 + 3.8234i |
| Columns 5 through 7 |
| -3.0847 - 3.8234i -0.8295 - 5.7986i 8.8000 - 0.2208i |
| The corresponding amplitude value is given by |
| lx(k)l={17.2484,8.80,5.857,4.912,4.912,5.857,8.8027}*104 |
| And the corresponding phase value is given by |
| {0, 1.432,-81.85,-54.10, 51.10, 81.85,-1.437} |
RESULT |
| In this paper we convert stem graph of normal lungs and abnormal lungs into a mathematical value by Fast Fourier transform. There is difference in Amplitude and phase of normal lungs and abnormal lungs. This difference in Amplitude and phase shows the magnitude of carcinogenic disease. With the help of this numerical value physician can choose optimal treatment modality until the abnormal value exactly equals the normal value. Due to this the side effect of medicine can be avoided. |
DISCUSSION |
| The important thing is to be able to interpret accurately test for a patient. The main advantage of this paper we know the mathematical formulation of carcinogenic disease so that the side effect due to the overdose of medicine can be avoided. We know the exact treatment of any disease |
References |
|