ISSN ONLINE(2319-8753)PRINT(2347-6710)
ISSN ONLINE(2319-8753)PRINT(2347-6710)
Dr.S.Vasantha1, Uma Maheswari2 and K.Subashini3
|
| Related article at Pubmed, Scholar Google |
Visit for more related articles at International Journal of Innovative Research in Science, Engineering and Technology
Mutual Fund refers to trust which pools the savings of a large number of investors who share a common financial goal. The money collected from the investors is invested in the capital market instruments based on the fund’s objective. The income earned and capital appreciations realized out of these investments are shared by its unit holders in percentage to the number of units owned by them. The main objective of this research paper is to evaluate the performance of selective open ended equity diversified Mutual fund in the Indian equity market.For the purpose of conducting this study HDFC top 200 fund(g),Reliance top 200(g),ICICI Prudential top 200(g),Canara Robeco equity diversified fund(g),Birla Sun Life frontline equity (g) mutual funds have been studied over the period of 60 months data which is from January 2008 to December 2012.The analysis has been made on the basis of Sharpe ratio, Treynor ratio and Jenson .
Keywords |
| Equity, Mutual fund, performance, sharpe,Treynor,Jenson’s measure |
INTRODUCTION |
| Investment is very important to park the surplus fund of an individual for the purpose of earning additional income or capital appreciation or both. The investor has to consider various factors while making an investment decision these are as follows: risk associated with the investment, tax benefits, liquidity, and marketability etc. A mutual fund is a pool of money collected from many small investors which is professionally managed by the portfolio managers. It is a type of collective investment scheme and invests it various securities such as in stocks, bonds and short-term money market instruments. The performance of the fund depends upon the economic condition of the country and the world as a whole. The performance of the fund will be evaluated in terms of rate of return, Treynor, Sharpe and Jensen’s measure of performance. The mutual fund industry in the country manages around Rs 7,81,583.84 crores (As of Feb, 2010) of assets, a large part of which comes from retail investors. Mutual funds are considered as one of the best attractive investment options available to small investors as compare to others alternatives because it is managed by professional portfolio managers. |
OBJECTIVES OF THE STUDY |
| • To evaluate the performance of selected open ended equity diversified Mutual fund in India |
| • To measure the risk -return relationship and market volatility of the selected mutual funds |
| • To analyze the risk adjusted performance the selective open ended equity diversified mutual fund through various techniques |
| • To suggest strategies to invest in a profitable mutual fund |
REVIEW OF LITERATURE |
| Various reviews from different studies support the hypothesis that historical performance is one of the major indicators of likely future performance. |
| Daniel (1997) has concluded that the 'persistence in mutual funds performance' is due to the use of simple momentum strategies by the fund managers rather than due to certain fund managers having 'hot hand' that allow them to pick winning stocks. Results show that particularly aggressive growth funds exhibit some "selectivity" ability but no "timing ability.” |
| Cochran (2001) has examined 'predictability' of stock returns. They suggested that stock returns are predictable. The degree of predictability increases as the time horizon lengthens. The author has examined the predictability of stock returns using international stock market data from 18 countries. Their results show that dividend yield can predict stock returns and the level of predictability increase as the return horizon increase from one month to 48 months. |
| Noulas, John and John (2005) evaluated the risk adjusted performance of Greek equity funds during the period 1997-2000. This study is based on weekly data for equity mutual funds and includes 23 equity funds that existed for the whole period under consideration. Mutual funds were ranked on the techniques used by Treynor (1965), Sharpe (1966) and Jensen. Results showed positive returns of the stock market for the first three years and negative returns for the fourth year. The results also indicated that the beta of all funds is smaller than 1 for four-year period. The authors concluded that the equity funds have neither the same risk nor the same return. The investor needs to know the long-term behavior of mutual funds in order to make the right investment decision. |
| Leite and Cortez (2006) haveconducted a research to analyze the impact of using conditioning information in evaluating the performance of mutual funds. For this purpose two different samples of Portuguese-owned open end equity funds were built, over the period of June 2000 to June 2004. The first sample contained surviving 24 funds (10 National funds and 14 European Union funds) at the end of June 2004. While the second sample included all surviving and 20 nonsurviving funds during the sample period. Both conditional and unconditional models were used to evaluate the performance. The results of unconditional model indicated that the performance of National funds was neutral while the performance of European Union funds was negative. On the other hand conditional models suggested that conditional betas (but not alphas) are time-varying and dependent on the dividend yield variable. |
| Boudreaux and Suzanne (2007) have conducted a study to examine the risk adjusted returns of international mutual funds for the period of 2000-2006. For this purpose a sample of ten portfolios of international mutual fund was taken and risk-adjusted performance was calculated by using Sharpe (1966)’s Index of Reward to Variability ratio. US market of mutual funds was taken as the benchmark. The results showed that the performance of nine out of ten of the international mutual fund was higher than the U.S. market. Those portfolios which contained only U.S stock mutual funds underperform on a risk adjusted the funds that contained all international mutual funds. The authors concluded that Investors may not fully take advantage of possible portfolio risk reduction and higher returns if international mutual funds were excluded. |
| Arugaslan and Ajay (2008) has examined the risk-adjusted performance of US-based international equity funds from 1994-2003. The analysis was done for five-year period 1999-2003 and ten-year period 1994-2003. For this a sample of 50 large US-based international equity funds was taken and a new method of measurement Modigliani and Modigliani (M squared) was applied. The performance was compared with both domestic and international benchmark indices. The results showed that the risk has great impact on the attractiveness of Funds. Higher return funds may lose attractiveness due to higher risk while the lower return funds may be attractive to investors due to the lower risk. |
| Amporn Soongswang (2009) conducted study on 138 open ended equity mutual funds managed by 17 asset management companies in Thailand during the period of 2002-2007. The performance of mutual funds were measured using Treynor ratio, Sharp ratio and Jensen’s alpha, showed that performance of Thai open ended mutual funds significantly outperform the market. |
| Dietze, Oliver and Macro (2009) have conducted a research to evaluate the risk-adjusted performance of European investment grade corporate bond mutual funds. Sample of 19 investment-grade corporate bond funds was used for the period of 5 years (July 2000 – June 2005). Funds were evaluated on the basis of single-index model and several multi-index and asset-class-factor models. Both maturity-based indices and rating based indices were used to account for the risk and return characteristics of investment grade corporate bond funds. The results indicated that the corporate bond funds, on average, underperformed the benchmark portfolios and there was not a single fund exhibiting a significant positive performance. Results also indicated that the risk-adjusted performance of larger and older funds, and funds charging lower fees was higher. |
RESEARCH METHODOLOGY |
Research design |
| The study is both descriptive and analytical in nature. For the purpose of research, the researcher would be making comparison among different open ended equity diversified mutual fund and also analyzed the overall performance of various equity diversified funds. |
Data collection: |
| The study is purely based on secondary data which was collected through the official website of Mutual Fund India and National Stock Exchange of India Limited |
Sample size: |
| The data has been collected during the period of 2008-2012. For the purpose of the study the following selective equity mutual fund schemes were selected. |
| 1. HDFC top 200 fund(g) |
| 2. Reliance top 200(g) |
| 3. ICICI Prudential top 200(g) |
| 4. Canara Robeco equity diversified fund(g) |
| 5. Birla Sun Life frontline equity (g) |
| A period of 60 months data which in January 2008 to December 2012 were consider for analysis |
Tools and Techniques used: |
| The following tools and techniques were used to analyze the performance of the mutual fund These are as follows |
| • Co- variance. |
| • Beta. |
| • Standard deviation. |
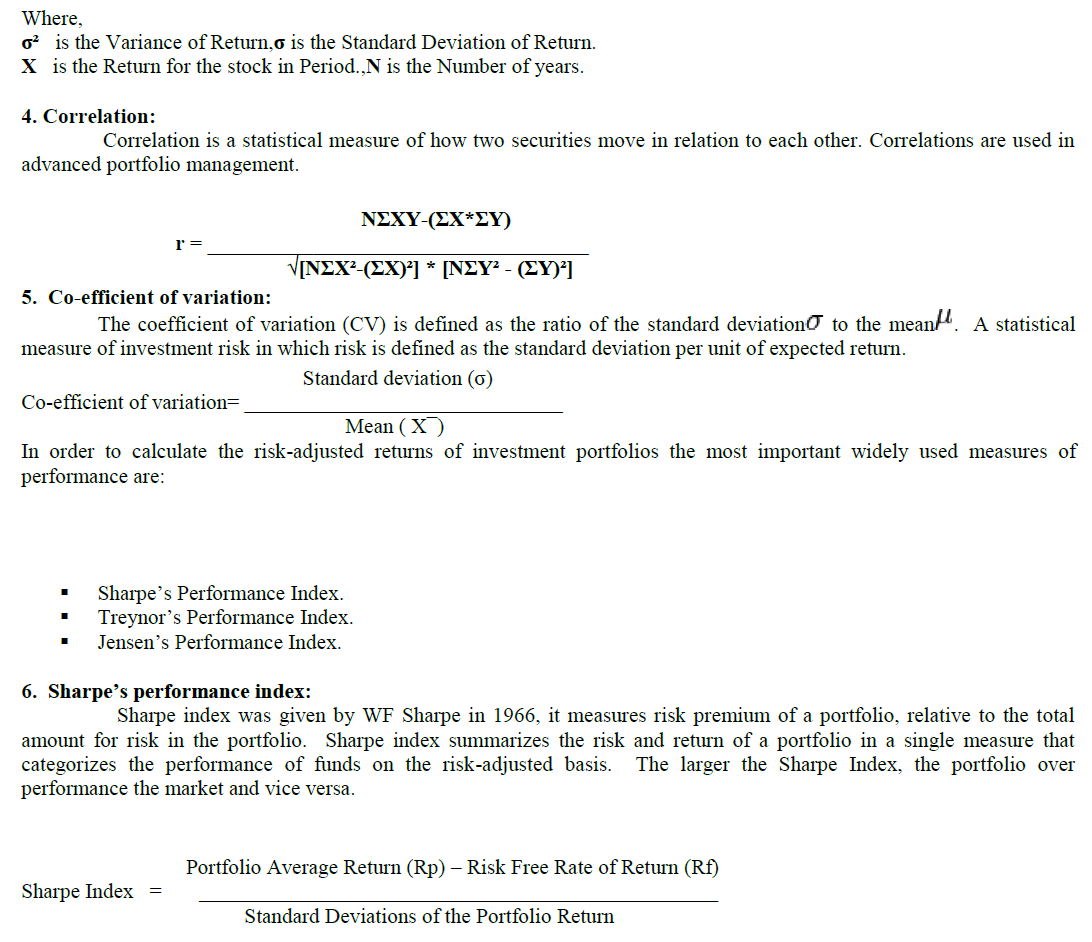
| • Correlation. |
| • Co-efficient of variation. |
1. Covariance: |
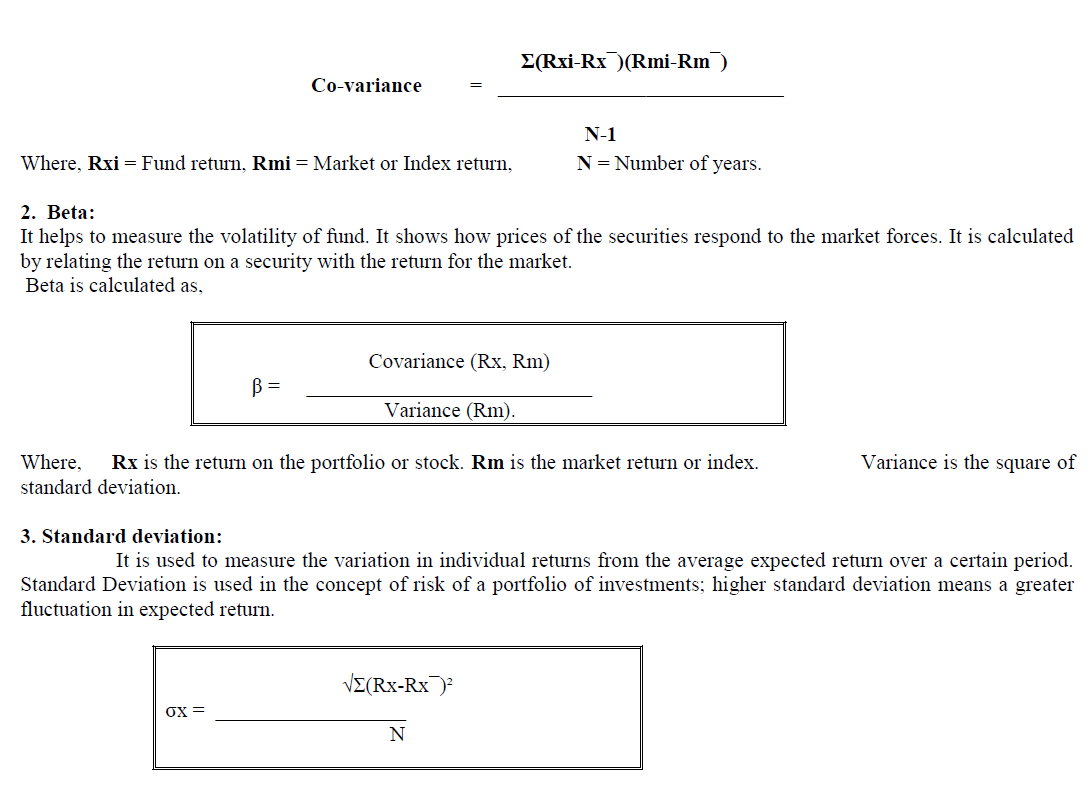
| Covariance measures the degree to which two variables are correlated. It is important in security analysis to determine how much or how little price movements in two companies or industries are connected. |
 |
 |
7. Treynor’s performance index: |
| It was given by Jack Treynor in 1965, it is expressed as a ratio of returns to systematic risk i.e. beta. It adjusts return based on systematic risk; therefore it is relevant for performance measurement when evaluating portfolios separately or in combination with other portfolios. |
 |
DATA ANALYSIS AND INTERPRETATION |
| The performance of top ten mutual fund schemes was measured based on various performance metrics |
 |
Return: |
| The above table exhibits that HDFC Top 200 fund- growth has yielded the highest returns (0.79%) of all selected mutual funds. Canara robeco equity diversified fund –growth has earned the next highest returns, followed by Birla Sun Life Front Line Equity Fund growth etc. ICICI Prudential Top 200 fund - growth has delivered the lowest return (0.33%) among all the funds. |
Standard Deviation: |
| Higher standard deviation means higher risk. HDFC Top 200 and Birla Sun Life Front Line equity fund-growth has the lowest Standard deviation which means it is comparatively less risky to the other funds as its returns are less volatile. Reliance Top 200 Fund has the next lowest SD, followed by ICICI Prudential Top 200 fund etc. Canara Robeco Equity Diversified-growth has the highest SD among all the funds which means it is comparatively more risky as its return are more volatile. |
Beta: |
| Since Beta value is less than 1 means the fund reacts less than the market reaction. All the funds has beta less than 1, which indicates that the security's price will be less volatile than the market. |
Co-variance: |
| The co-variance analysis between funds performance with market index performance shows that there is low variation exists between market index and fund performance of HDFC Top 200 Fund (0.00708). Hence it can be preferred as the risk of variation between fund and market performance is low. Birla Sun Life Front Line Equity fund-growth and Reliance Top 200 Fund- Growth has the next lowest variance. |
 |
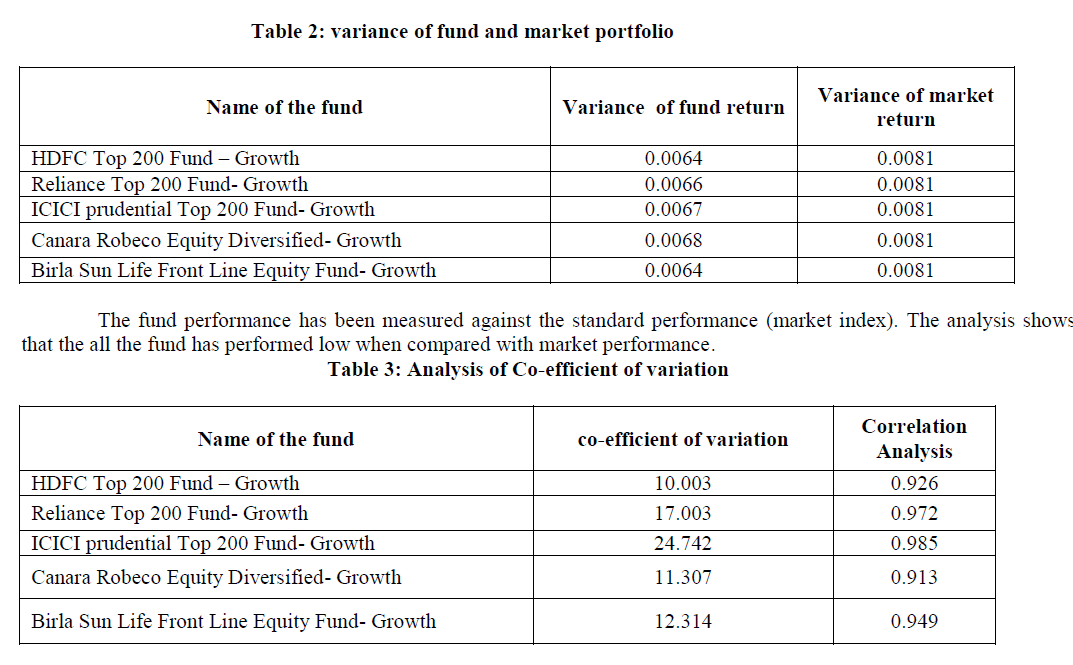
| The co-efficient of variation helps to measure the risk per unit of expected return. The risk per unit of expected return is low for HDFC Top 200 Fund – Growth (10.003) and Canara Robeco Equity diversified Fund – Growth(11.307) when compare to other funds hence it can be preferred. ICICI Prudential Top 200 Fund – Growth (24.742) is much risky when compared with other funds. |
| Correlation analysis shows how strong the relationship exists between fund performance and market performance. The above table reveals that, there is a high degree of perfect positive correlation exists between fund performance and market performance of every fund. |
 |
FINDINGS |
| • The HDFC Top 200 Fund has yielded the highest average return of 0.79% for the past 5 years when compared with all other funds. |
| • All the selected funds show beta value of less than 1 which means that the funds will be less volatile than the market. |
| • HDFC Top 200 fund and Birla Sun Life Front Line equity has the lowest standard deviation of (0.79) among all the other selected mutual funds |
| • The analysis shows that there is low variation exists between market index and fund performance of HDFC Top 200 Fund (0.00708). Hence it can be stated that the risk of variation between fund performance and market performance is low. |
| • The risk per unit of expected return is low for HDFC Top 200 fund Growth (10.003) and Canara Robeco Equity diversified Fund Growth(11.307) . |
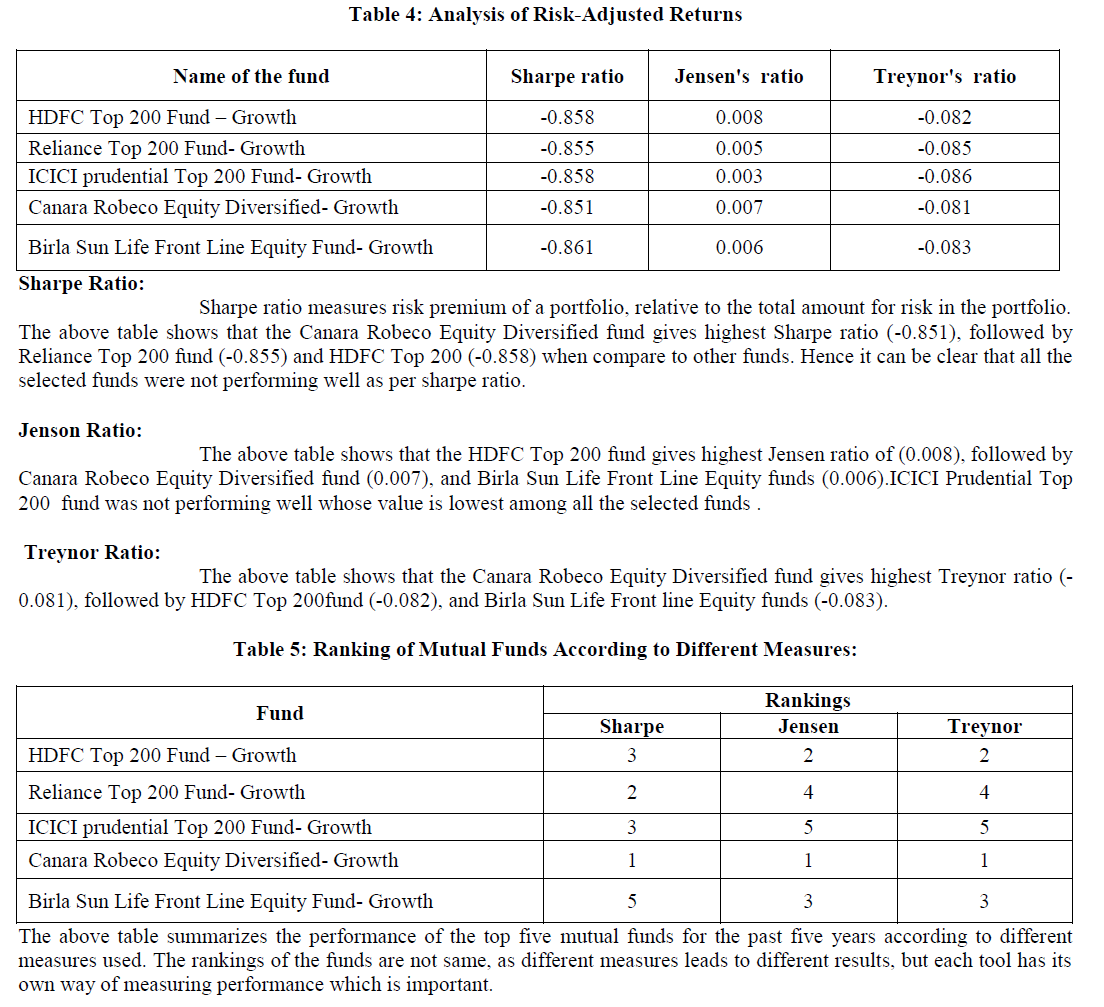
| • Canara Robeco Equity diversified Fund has the highest Sharpe’s ratio (-0.851), which means it is outperformed all the other funds, as higher the Sharpe ratio higher the performance of the fund. Based on Sharpe ratio all funds providing negative values so, it’s not performing well. |
| • The higher the Jensen’s measure value, the better the fund is performing. HDFC Top 200 fund is the best performing fund as it has the highest Jensen’s measure value (0.008) among all the funds. |
| • Based on Treynor ratio all the funds providing negative values so, it’s not performing well. |
SUGGESTIONS |
| • Investors who have a lower risk appetite should invest in HDFC Top 200 fund(0.88) and Birla Sun Life Front line Equity funds(0.88) as it has lowest beta among all the other funds. |
| • Investors who want the highest returns and are willing to take higher risk should invest their funds in HDFC Top 200 Fund, as it yielded the highest returns (0.79%) among all the other selected mutual funds and also it has low variations when compared with the market performance. So it can be preferred by risk averse investors. |
| • Investors who are interested in consistent returns also can invest in HDFC Top 200 fund, as it has the lowest standard deviation of (0.079) among all the other selected mutual funds. |
CONCLUSION |
| Investors can invest in a mutual fund that matches their investment objective and analyze the fund based on various criteria such as risk prevailing in the market, variations on the return and deviations occur in the returns etc. Risk appetite of an investor plays an important role in the selection of mutual fund. The investor who needs regular income can invest in HDFC Top 200 and Canara Robeco equity Diversified fund. The shape index concluded that majority of the funds showed negative returns and no fund exhibited extraordinary performance. |
References |
|