ISSN ONLINE(2319-8753)PRINT(2347-6710)
ISSN ONLINE(2319-8753)PRINT(2347-6710)
Murugalakshmi G.K1 and Selvakumar N2
|
| Related article at Pubmed, Scholar Google |
Visit for more related articles at International Journal of Innovative Research in Science, Engineering and Technology
The efficiency of the cooling system is critical in industrial sectors could damage the electrical equipments due to poor thermal conductivity. Nanofluids are novel class of fluids, prepared by dispersing the nanoparticles in liquids like water, ethylene glycol, oil and oleic acid etc., to increase the thermal conductivity of heated substrates. The liquid droplets are placed on the substrate and are heated to various levels, thereby hydrothermal waves are induced and it is observed in thin fluid layers. Using Infrared Thermography technique heat transfer, drop radius, drying of substrates and its wetting angle are measured. It is a non-contact, non-destructive test measurement technique which detects the emitted infrared radiation from the substrate above absolute zero according to black body radiation law. Three different metal oxide nanofluids (Copper oxide, Iron oxide and Aluminium oxide) were prepared and nanoparticles are characterized using SEM, AFM and FT-IR. Using TGA and DTA, thermal stability and weight loss of the nanoparticles are studied. Copper Oxide nano fluid shows reduced weight loss, enhanced thermal stability and thermal conductivity when compared to other fluids.
Keywords |
| Hydrothermal waves, Heat transfer fluids, Thermal stability, Infrared Thermography and Thermal conductivity. |
INTRODUCTION |
| Developments of many industrial and new technologies are limited by existing thermal management and it needs high performance cooling. Nanofluids, a new and innovative heat transfer fluids represent an emerging field. The heat capacity is high in electrical machines due to high temperature. It damages the electrical equipment and so the efficiency of system is critical and thus leads to energy losses. This is due to large sized particle, density, viscosity, sedimentation and concentration of the fluid used in the machines. Nanofluids are stable colloidal suspensions of nanoparticles, Nanofibres and Nanocomposites in common base fluids [1]. The smallest particles in the nanofluids exhibit thermo-physical properties such as thermal conductivity, thermal diffusivity, viscosity and heat transfer. The prepared nanoparticles are Aluminium oxide, Copper oxide and Iron oxide and are dispersed in base fluids such as Water, Oil and Ethylene glycol. Thermal conductivity and heat transfer of nanofluids are studied by varying the proportion of nanoparticles and volume concentration of base fluids. Then the best nanofluid is compared with maximum desirable properties. Using Infrared Thermography (IRT), the thermal conductivity, heat transfer, Wetting angle, drop radius and surface drying of substrates are studied. Infrared Technique is a noncontact, non-destructive test measurement method. It has inbuilt FLIR THERMACAM software which helps in detecting the Infrared radiations emitted from the substrate. Infrared Thermography is an Imaging Technique using Thermographic camera detects radiation in infrared range of electromagnetic Spectrum and produces |
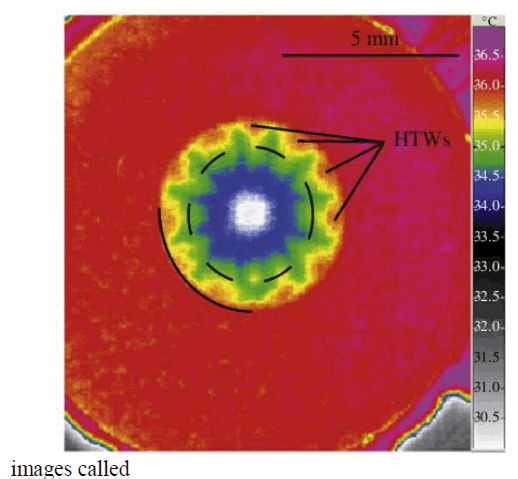 |
| ‘Thermograms’. IR radiation is emitted by all objects above absolute zero according To black body radiation law. The amount of radiation increases with the temperature. It utilizes a camera like device used for detecting Hot-Spots, which are temperature differentials [3]. The thermal treatment processes are characterised by DTA/TGA [10]. The morphological structure and properties of nanoparticles were characterized by SEM, AFM and FT-IR. A model shown in Fig 1 demonstrates that the hydrothermal waves on evaporating ethanol droplets [4]. |
| Fig 1. Hydrothermal waves |
MATERIALS AND METHODS |
Synthesis of nanoparticle |
| Iron oxide particle |
| The Iron Oxide nanoparticles were synthesized using self combustion method. About 8g of Iron Nitrate was dissolved in 100ml distilled water. 9g of Citric Acid was dissolved in 100ml distilled water. Both the solutions were mixed together and pH was maintained to 10 by adding Ammonia in to it. Then the solution was kept in hot bath, until the solution becomes ash by maintaining the temperature at about 80°C. Then the ash was collected and calcinated at 700°C for 3h. Iron oxide nanoparticle was obtained. |
Copper oxide particle |
| The copper oxide nanoparticle was synthesized using precipitation method [5]. 0.4 mol of copper acetate was dissolved in distilled water and 4ml of Acetic acid was added in round bottomed flask and magnetically stirred. After that 3g of Sodium Hydroxide pellets are dissolved in 60ml distilled water and it was poured in round bottomed flask continued with magnetic stirring. In the mean time the pH was maintained about 6-7. The colour of the solution become black and precipitate was formed. It was then washed 2-3 times with distilled water. It was configured to get pure precipitate and kept in oven for 2h at 80oC. The Copper Oxide nanoparticle was obtained. |
Aluminium oxide nanoparticle: |
| The Aluminium Oxide nanoparticle was synthesized by self combustion method. 8g of Aluminium nitrate was dissolved in 100ml distilled water and 9g of citric acid was dissolved in 100ml distilled water. Both the solutions were mixed and pH was maintained about 10. It is then kept in hot plate at 80oC. After sometimes, self combustion takes place and ash was collected in Black colour. Then the ash is calcinated at 800oC for 3h in muffle furnace. The white coloured aluminium oxide nanoparticle was obtained. |
Characterization of the sample |
| The calcined powder were identified using XRD (XRay Powder Diffractometer) with CuKα radiation and differential thermal analysis (DTA) and Thermogravimetric analysis (TGA) curves of the precursors were recorded by an equipment TG-DTG-DTA. The dispersion of powders and morphology of particles were characterized using Scanning Electron Microscope (SEM), and the particles arrangement are seen with the help of Atomic Force Microscope (AFM). |
RESULTS AND DISCUSSIONS |
XRD analysis of the samples |
| Iron oxide particle |
| Clearly the structural features of iron oxide are explored from the XRD data which is shown in Fig 2. The peak intensities show that the powder possesses the characteristics perfect crystal and purity. The XRD pattern of Fe2O3 powders revealed that well developed reflection of Fe2O3 nanoparticle (JCPDS. No. 89-8104). A number of strong Bragg reflections can be seen which corresponds to the reflection of Fe2O3 nanoparticle. The XRD pattern of the sample exhibits the characteristics peak at 2θ=24.213o, which corresponds to the (012) plane. It also exhibits peaks at 2θ=33.255o, 2θ=35.722o, 2θ=49.54o, 2θ=53.547o, 2θ=55.87o, 2θ=62.75o and 2θ=63.213o are indexed as planes (104), (110), (202), (020), (021), (022) and (311) respectively. The peak at 2θ=39.408o which corresponds to the (006) plane confirms the presence of Fe2O3 nanoparticle. |
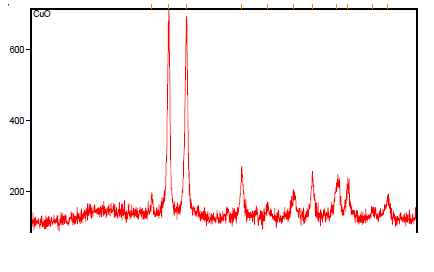 |
| Fig 2. XRD pattern of Iron oxide nanoparticle. |
Copper oxide nanoparticle |
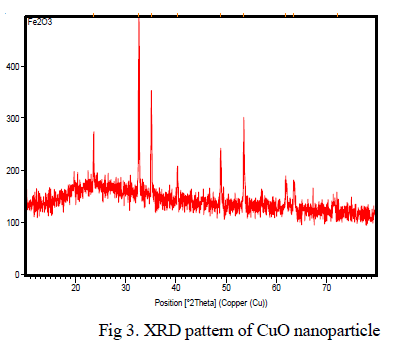
| The structural features of Copper Oxide are explored from XRD data which is shown in Fig 3. The XRD pattern of final powders revealed well developed reflection of CuO nanoparticle (JCPDS. No. 89-2838). A number of Bragg reflections can be seen which corresponds to the reflection of CuO nanoparticle. The XRD pattern of the sample exhibits the characteristics peak at 2θ = 34.97o, which corresponds to the (002) plane. It also exhibits peaks at 2θ = 48.25o, 2θ = 67.46o, 2θ=31.95o, 2θ=51.387o, 2θ=58.3o, 2θ=61.00o, 2θ=68.145o, 2θ=74.58o and 2θ=75.280o are indexed as planes (202), (113), (110), (112), (202), (310), (220), (004) and (222) respectively. The peak at 2θ = 38.17o which corresponds to the (111) plane confirms the presence of CuO nanoparticle. |
 |
SEM analysis of nanoparticle: |
| Iron oxide particle |
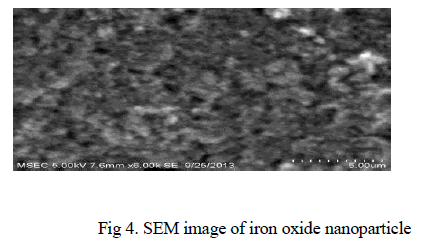
| The SEM image of iron oxide particle is depicted in Fig 4. The SEM image shows the particle size and reveals the presence and uniformity of the distributed particles. It was clear that the particles obtained were in nano size ranging from 100-200nm. |
 |
Copper oxide nanoparticle: |
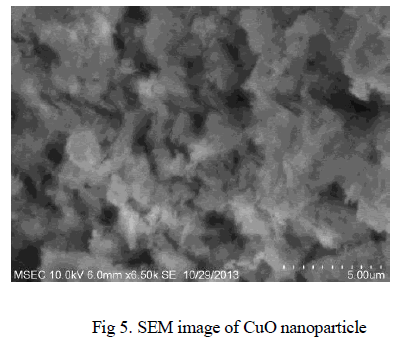
| The SEM image of CuO nanoparticle is depicted in Fig 5. The SEM image shows the particle size and reveals the presence and uniformity of the distributed particles with fibrous nature. It was clear that the particles obtained were in nano size ranging from 100-180nm. |
 |
Aluminium oxide nanoparticle: |
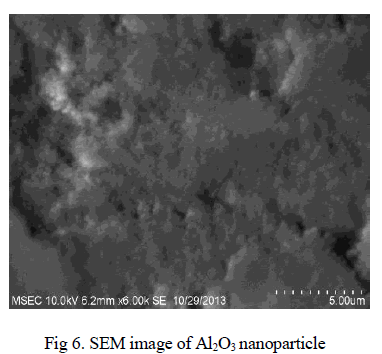
| The SEM image of Al2O3 nanoparticle is depicted in Fig 6. The SEM image shows the morphology of nanoparticles, particle size and reveals the presence and uniformity of the distributed particles. It was clear that the particles obtained were in nano size ranging from 125- 175nm. |
 |
AFM analysis of Copper oxide nanoparticle: |
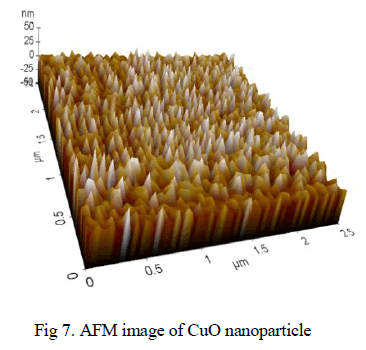
| It demonstrates 3D AFM images of CuO nanoparticle ablated in acetone with scanning area of 2.5μmx2.5μm. The average grain size reaches 50 nm in diameter. It can be noticed that the particles are regularly arranged with same morphologies as shown in fig 7. |
 |
FT-IR Analysis of Copper oxide nanoparticle: |
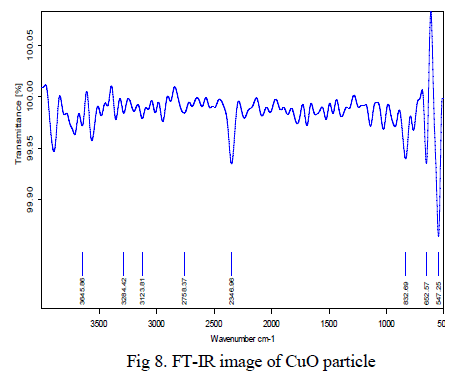
| The black coloured copper oxide powder was examined and it reveals that the powder has very less impurities. Also it was confirmed using XRD techniques. The peak 547 cm-1 proved that Cu-O bond stretching vibrations, the peak 2346cm-1 indicates the O-H bond stretching vibrations and between 3000- 3200 cm-1 indicates the C-H bond vibrations shown in Fig 8. |
 |
TG/DTA ANALYSIS: |
Copper oxide nanoparticle |
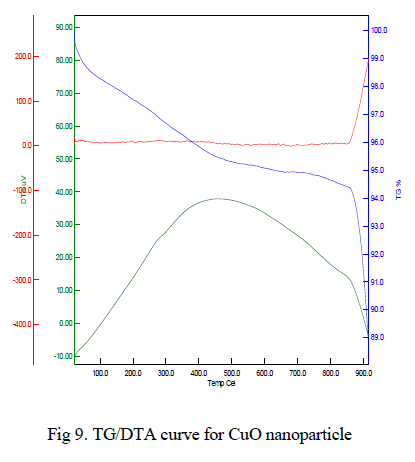
| The typical TG/DTA exothermic profile and characteristic temperatures of θ to α phase transformation takes place. DTA profiles were recorded with heating rate of 10oC/min-1. The thermal gravimetric analysis data of the given CuO nanoparticle shown in Fig 9 indicates that weight loss of the material is observed between the temperature range from 350-500oC of about 0.2%. This weight loss is mainly due to the evaporation of water in the sample. This compound is thermally stable and weight loss is reduced when compared to other samples. Above 800oC, the weight loss is reduced to 10%, it may be due to oxygen loss. |
 |
Aluminium oxide nanoparticle |
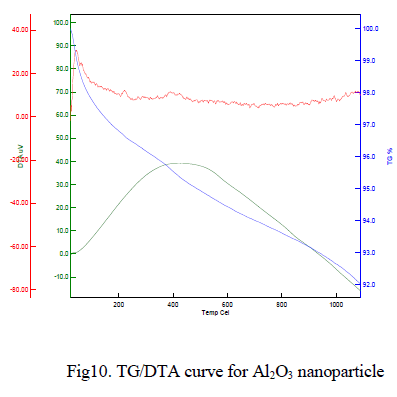 |
| The typical TG/DTA exothermic profile and characteristic temperatures of θ to α Al2O3 phase transformation. DTA profiles were recorded with heating temperature of 1050oC at heating rate of 10o C/min-1. The thermal gravimetric analysis data of the given Al2O3 nanoparticle shown in Fig 10 indicates that weight loss of the material is observed between the temperatures range from 50-150Ãâ¹ÃÅ¡C of about 7%. This weight loss is mainly due to the evaporation of water content in the sample. This compound is less stable and weight loss is high compare to other samples. Above 900Ãâ¹ÃÅ¡C, the weight loss is reduced to 5%, it may be due to oxygen loss. |
CONCLUSIONS |
| Nanofluids such as Iron oxide, Copper oxide and Aluminium oxide were prepared and its morphological structure and properties were analysed using SEM, AFM, FT-IR. The thermal stability and weight loss of the nanoparticles were tested using TG/DTA. The thermal stability of copper oxide was stable when compared to aluminium oxide and iron oxide nanoparticles. However, the weight loss is 0.2% less for copper oxide; it was thermally stable up to 800oC. It shows that performance like thermal stability and weight loss of copper oxide was better when compared to other metal oxide nanoparticles. |
ACKNOWLEDGEMENT |
| The work described in this paper was supported by Mepco Schlenk Engineering College, Centre for Nano Science and Technology branch. I thank my guide for the great success of work and Coworkers. |
References |
|