A survey on human activity recognition using wearable sensors used wired communication device. For a survey on human activity recognition using wearable sensors used wireless communication device. The recognition of human activities has been approached in two different ways, namely using external and wearable sensors. In the former, the devices are fixed in predetermined points of interest, so the inference of activities entirely depends on the voluntary interaction of the users with the sensors. In the latter, the devices are attached to the user. In the feature extraction technique, the image from the camera is feed into the system, where we use the classifiers to extract the features of the images. We use two techniques in this project, namely (i) Feed forward neural network (ii) General regression neural network. The feature extraction uses two techniques. Testing and training. In the training phase, couple of the user images are processed and updated in the system. So during the testing phase, when images are feed into the system, the system compares with the existing training data and validates the images.
Keywords |
| Wearable sensors, Patient monitoring system, Feature extraction, FFNN classifier, GRNN classifier |
INTRODUCTION |
| During the past decade, there has been an exceptional development of microelectronics and computer systems, enabling
sensors and mobile devices with unprecedented characteristics. Their high computational power, small size, and low
cost allow people to interact with the devices as part of their daily living. That was the genesis of Ubiquitous Sensing,
an active research area with the main purpose of extracting knowledge from the data acquired by pervasive sensors.
Particularly, the recognition of human activities has become a task of high interest within the field, especially for
medical, military, and security applications. For instance, patients with diabetes, obesity, or heart disease are often
required to follow a well defined exercise routine as part of their treatments . Therefore, recognizing activities such as
walking, running, or cycling becomes quite useful to provide feedback to the caregiver about the patient’s behavior.
Likewise, patients with dementia and other mental pathologies could be monitored to detect abnormal activities and
thereby prevent undesirable consequences . For a survey on human activity recognition using wearable sensors used
wireless communication device. The recognition of human activities has been approached in two different ways,
namely using external and wearable sensors. In the former, the devices are fixed in predetermined points of interest, so
the inference of activities entirely depends on the voluntary interaction of the users with the sensors. In the latter, the
devices are attached to the user. In the feature extraction technique, the image from the camera is feed into the system,
where we use the classifiers to extract the features of the images. We use two techniques in this project, namely (i) Feed
forward neural network (ii) General regression neural network. The feature extraction uses two techniques. Testing and
training. In the training phase, couple of the user images are processed and updated in the system. So during the testing
phase, when images are feed into the system, the system compares with the existing training data and validates the
images. |
LITERATURE SURVEY |
| F.FOERSTER, M.SMEJA, AND J.FAHRENBERG explains.,The suitable placement of a small number of calibrated
piezoresistive accelerometer devices may suffice to assess postures and motions reliably. This finding, which was
obtained in a previous investigation, led to the further development of this methodology and to an extension from the
laboratory to conditions of daily life. The intention was to validate the accelerometric assessment against behavior
observation and to examine the retest reliability. Twenty-four participants were recorded, according to a standard
protocol consisting of nine postures/motions (repeated once) which served as reference patterns. The recordings were
continued outside the laboratory. A participant observer classified the postures and motions. Four sensor placements (sternum, wrist, thigh, and lower leg) were used. The findings indicated that the detection of posture and motion based
on accelerometry is highly reliable. The correlation between behavior observation and kinematic analysis was
satisfactory, although some participants showed discrepancies regarding specific motions. |
| E.KIM, S.HELAL, AND D.COOK explains., In principle, activity recognition can be exploited to great societal
benefits, especially in real-life, human centric applications such as elder care and healthcare. This article focused on
recognizing simple human activities. Recognizing complex activities remains a challenging and active area of research
and the nature of human activities poses different challenges. Human activity understanding encompasses activity
recognition and activity pattern discovery. The first focuses on accurate detection of human activities based on a
predefined activity model. An activity pattern discovery researcher builds a pervasive system first and then analyzes the
sensor data to discover activity patterns. |
| A.TOLSTIKOV, X.HONG, J.BISWAS, C.NUGENT, L.CHEN, AND G.PARENTE explains., Ambient assistive living
environments require sophisticated information fusion and reasoning techniques to accurately identify activities of a
person under care. This paper explains, compares and discuss the application of two powerful fusion methods, namely
dynamic Bayesian networks (DBN) and Dempster-Shafer theory (DST), for human activity recognition. Both methods
are described, the implementation of activity recognition based on these methods is explained, and model acquisition
and composition are suggested. It also provides functional comparison of both methods as well as performance
comparison based on the publicly available activity dataset. Our findings show that in performance and applicability,
both DST and DBN are very similar; however, significant differences exist in the ways the models are obtained. DST
being top-down and knowledge-based, differs significantly in qualitative terms, when compared with DBN, which is
data-driven. These qualitative differences between DST and DBN should therefore dictate the selection of the
appropriate model to use, given a particular activity recognition application. |
WEARABLE SENSORS |
| Wearable sensor is a device that is always with the user, and into which the user can always enter commands and
execute a set of such entered commands, and in which the user can do so while walking around or doing other
activities. This transformation allows it to be worn constantly, with the goal of becoming a seamless extension of body
and mind, equipped with various sensors which measure heart rate, respiration, footstep rate etc, and can help in body
maintenance. The ‘wearable computer’ apparatus is embedded within nontransparent clothing which provides shielding |
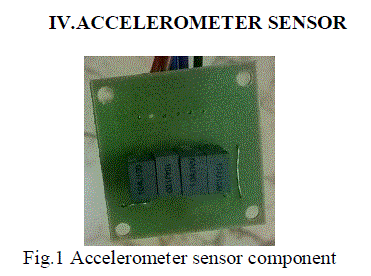 |
| In the Fig.1 and Fig.2 An accelerometer is a device that measures proper acceleration, the acceleration experienced
relative to free fall. Single- and multi-axis models are available to detect magnitude and direction of the acceleration as
a vector quantity, and can be used to sense orientation, acceleration, vibration shock, and falling. Micro machined
accelerometers are increasingly present in portable electronic devices and video game controllers, to detect the position
of the device or provide for game input. Triaxial accelerometers are perhaps the most broadly used sensors to recognize
ambulation activities (e.g., walking, running, lying, etc.) [27]–[29], [34]– [36]. Accelerometers are inexpensive, require
relatively low power [37], and are embedded in most of today’s cellular phones. Several papers have reported high
recognition accuracy 92.25% [29], 95% [38], 97% [35], and up to 98% [39], under different evaluation methodologies |
 |
TEMPERATURE SENSOR |
 |
| In the Fig.3 A thermistor is a type of resistor whose resistance varies with temperature. The word is a portmanteau of
thermal and resistor. Thermistors are widely used as inrush current limiters, temperature sensors, self-resetting
overcurrent protectors, and self-regulating heating elements. Thermistors differ from resistance temperature detectors
(RTD) in that the material used in a thermistor is generally a ceramic or polymer, while RTDs use pure metals. The
temperature response is also different; RTDs are useful over larger temperature ranges, while thermistors typically
achieve a higher precision within a limited temperature range [usually −90 °C to 130 °C]. Assuming, as a first-order
approximation, that the relationship between resistance and temperature is linear, then: |
 |
| Where, |
| ΔR = change in resistance |
| ΔT = change in temperature |
| k = first-order temperature coefficient of resistance |
 |
ELECTROCARDIOGRAM (ECG) |
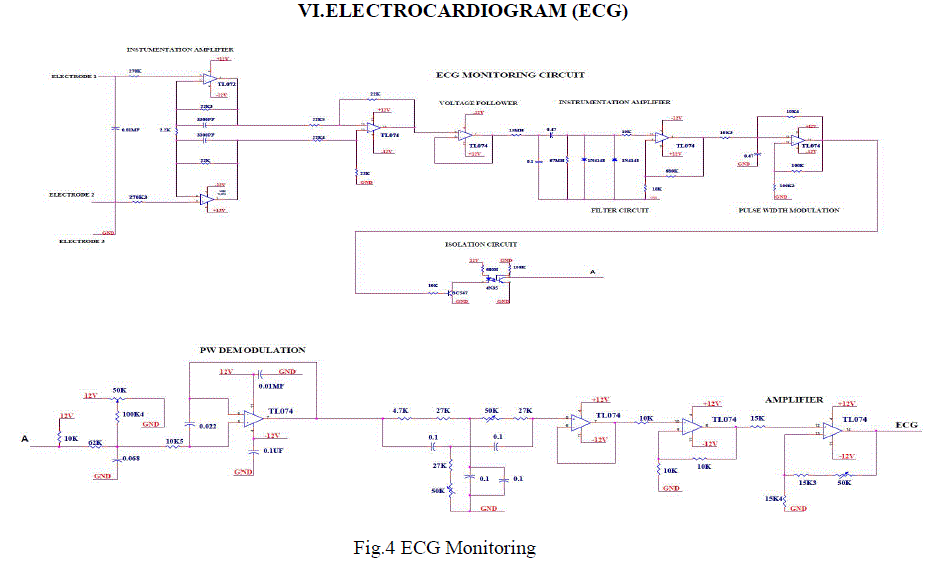 |
| In the Fig.4 An electrocardiogram (ECG or EKG, abbreviated from the German Elektrokardiogramm) is a graphic
produced by an electrocardiograph, which records the electrical activity of the heart over time. Analysis of the various
waves and normal vectors of depolarization and repolarization yields important diagnostic information. It is the gold
standard for the evaluation of cardiac arrhythmias. It guides therapy and risk stratification for patients with suspected
acute myocardial infarction. It helps detect electrolyte disturbances (e.g. hyperkalemia and hypokalemia). It allows for
the detection of conduction abnormalities (e.g. right and left bundle branch block). It is used as a screening tool for
ischemic heart disease during a cardiac stress test. It is occasionally helpful with non-cardiac diseases (pulmonary
embolism or hypothermia). |
ECG ON GRAPH PAPER |
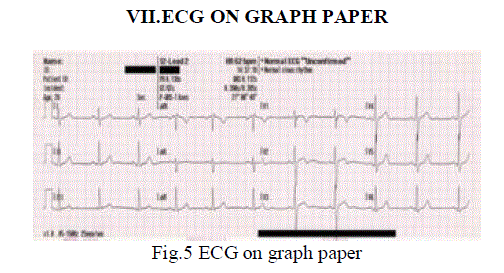 |
| In the Fig.5 A typical electrocardiograph runs at a paper speed of 25 mm/s, although faster paper speeds are
occasionally used. Each small block of ECG paper is 1 mm2. At a paper speed of 25 mm/s, one small block of ECG
paper translates into 0.04 s (or 40 ms). Five small blocks make up 1 large block, which translates into 0.20 s (or 200
ms). Hence, there are 5 large blocks per second. A diagnostic quality 12 lead ECG is caliberated at 10 mm/mV. |
POWER SUPPLY |
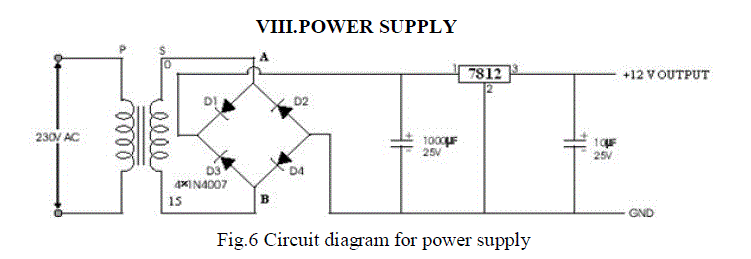 |
| In the Fig.6 The ac voltage, typically 220V rms, is connected to a transformer, which steps that ac voltage down to the
level of the desired dc output. A diode rectifier then provides a full-wave rectified voltage that is initially filtered by a
simple capacitor filter to produce a dc voltage. This resulting dc voltage usually has some ripple or ac voltage variation.
A regulator circuit removes the ripples and also remains the same dc value even if the input dc voltage varies, or the
load connected to the output dc voltage changes. This voltage regulation is usually obtained using one of the popular
voltage regulator IC units. |
RS232 SERIAL COMMUNICATION |
| In telecommunications, RS-232 is a standard for serial binary data interconnection between a DTE (Data terminal
equipment) and a DCE (Data Circuit-terminating Equipment). It is commonly used in computer serial ports. The
Electronic Industries Alliance (EIA) standard RS-232-C [3] as of 1969 defines: Electrical signal characteristics such as
voltage levels, signaling rate, timing and slew-rate of signals, voltage withstand level, short-circuit behavior, maximum
stray capacitance and cable length. Interface mechanical characteristics, pluggable connectors and pin identification.
Functions of each circuit in the interface connector . Standard subsets of interface circuits for selected telecom
applications. The standard does not define such elements as character encoding (for example, ASCII, Baudot or
EBCDIC), or the framing of characters in the data stream (bits per character, start/stop bits, parity). The standard does
not define protocols for error detection or algorithms for data compression. The standard does not define bit rates for
transmission, although the standard says it is intended for bit rates lower than 20,000 bits per second. Many modern
devices can exceed this speed (38,400 and 57,600 bit/s being common, and 115,200 and 230,400 bit/s making
occasional appearances) while still using RS-232 compatible signal levels. Details of character format and transmission
bit rate are controlled by the serial port hardware, often a single integrated circuit called a UART that converts data
from parallel to serial form. A typical serial port includes specialized driver and receiver integrated circuits to convert
between internal logic levels and RS-232 compatible signal levels. |
ZIGBEE |
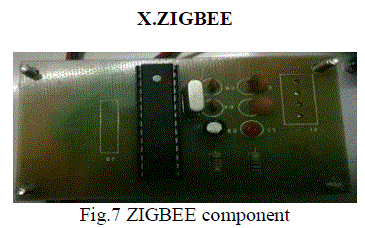 |
| In the Fig.7 Powerful digital features allow building a high-performance rf system. Using an inexpensive
microcontroller. Wake-on-radio functionality for automatic low-power rx polling. Burst mode data transmission with
high over-the-air data rate. reduces current consumption. Programmable data rate from1. 2-500kbps. Robust solution
with excellent selectivity and blocking performance. Ideal for multi-channels operation (50-800khz channels). Full
packet handling including preamble generation, sync. word insertion/detection ,add check, flexible packet. |
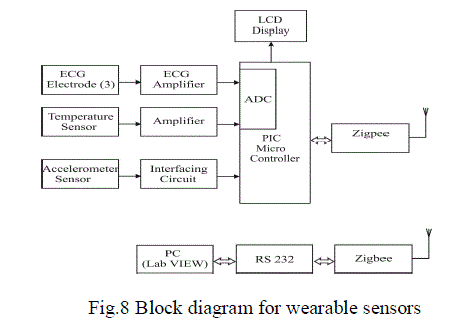 |
| In the Fig.8 The ECG, temperature sensors and accelerometer sensors were used. To read data the sensors will pass
through the amplifier. The output will get in analog form it converted into digital form. The result will appear in the
LCD display and the data will transceiver through zigbee. And the output will display in the labview through RS232
serial communication. |
FEATURE EXTRACTION |
| At first we are going to extract the features of the given input images (Eg. Both Normal & Abnormal Images). The
features going to be extracted are,[1]Entropy, [2]Energy, [3]Mean/Average Value, [4]Standard Deviation, [5]Variance,
[6]Covariance, [7]Kurtosis |
| 1) ENTROPY |
| Entropy is a measure of the uncertainty in a random variable |
| Entropy is defined as -sum(p.*log2(p)) |
| 2) ENERGY |
| Energy is also known as uniformity, uniformity of energy, and angular second moment. |
 |
| 3) MEAN/AVERAGE VALUE |
 |
| 4) STANDARD DEVIATION |
| The Standard Deviation is a measure of how spread out numbers are.Its symbol is σ (the greek letter sigma).There
are two common textbook definitions for the standard deviation s of a data vector X. |
| Where |
 |
| 5) VARIANCE |
| The variance is the square of the standard deviation (STD). |
 |
| 6) CO-VARIANCE |
| Covariance is a measure of how much two random variables change together |
 |
| 7) KURTOSIS |
| Kurtosis is a measure of how outlier-prone a distribution is. The kurtosis of the normal distribution is 3.
Distributions that are more outlier-prone than the normal distribution have kurtosis greater than 3; distributions that
are less outlier-prone have kurtosis less than 3. The kurtosis of a distribution is defined as |
 |
CLASSIFIER |
| Classifier going to be used is Neural network. Neural network consists of two phases. In the training phase we are
going to train the network using the features extracted from the input images. In the testing phase, the given input
image can be tested whether it is normal or abnormal. |
FEED FORWARD NEURAL NETWORK |
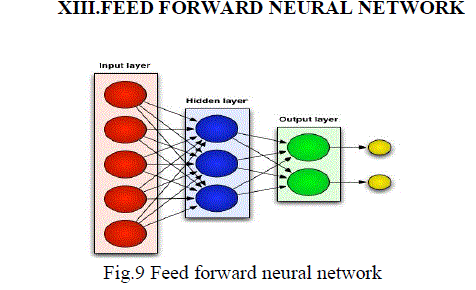 |
| In the Fig.9 A collection of neurons connected together in a network can be represented by a directed graph: Nodes
represent the neurons, and arrows represent the links between them. Each node has its number, and a link connecting
two nodes will have a pair of numbers (e.g. (1, 4) connecting nodes 1 and 4). Networks without cycles (feedback loops)
are called a feed-forward networks(or perceptron). Input nodes of the network (nodes 1, 2 and 3) are associated with the
input variables (x1, . . . , xm). They do not compute anything, but simply pass the values to the processing nodes.
Output nodes (4 and 5) are associated with the output variables (y1, . . . , yn). Hidden Nodes and Layers. A neural
network may have hidden nodes — they are not connected directly to the environment (‘hidden’ inside the network.
We may organise nodes in layers: input (nodes 1,2 and 3), hidden (4 and 5) and output (6 and 7) layers. Neural
networks can have several hidden layers. Numbering the Weights. |
| [a]. Calculate weighted sums in the first hidden layer: |
| v3 = w13x1 + w23x2 = 2 · 1 − 3 · 0 = 2 (9) |
| v4 = w14x1 + w24x2 = 1 · 1 + 4 · 0 = 1 (10) |
| [b]. Apply the activation function: |
| y3 = f(2) = 1 , y4 = f(1) = 1 (11) |
| [c]. Calculate the weighted sum of node 5: |
| v5 = w35y3 + w45y4 = 2 · 1 − 1 · 1 = 1 (12) |
| [d]. The output is |
| y5 = f(1) = 1 (13) |
GENERAL REGRESSION NEURAL NETWORK |
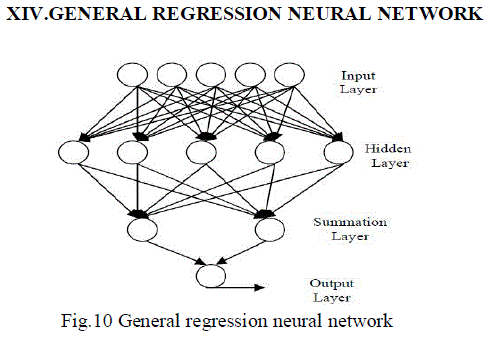 |
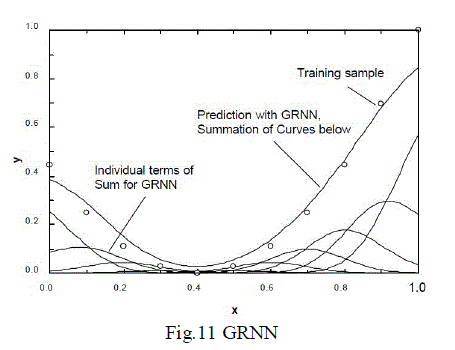
| In the Fig.10 and Fig.11 Extensive effort has been devoted to developing techniques for identification of linear timeinvariant
systems. The linear identification is based on measured input and output values of the system. Identification
for nonlinear systems is also based on measured input and output values, but it is more difficult. A procedure that uses
neural networks for identification and control of nonlinear systems. For identification, the input and output values of
the system are fed into a multilayer neural network. Although that paper used the back-propagation algorithm for
training the networks, the same identification and control framework can be used with neural networks having other
characteristics. One disadvantage of back-propagation is that it can take a large number of iterations to converge to the
desired solution. An alternative to back-propagation that has been used in classification is the probabilistic neural
network (PNN), which involves one-pass learning and can be implemented directly in neural network architecture. This
paper describes a similar one-pass neural network learning algorithm which can be used for estimation of continuous
variables. If the variables to be estimated are future values, then the procedure is a predictor. If the variable or variables
to be estimated relate output variables to input variables, then the procedure can be used to model the process or
system. Once the system has been modeled, a control function can be defined. If the procedure is taught samples of a
control function, it can estimate the entire control function, and it becomes a controller. |
 |
RESULTS AND DISCUSSION |
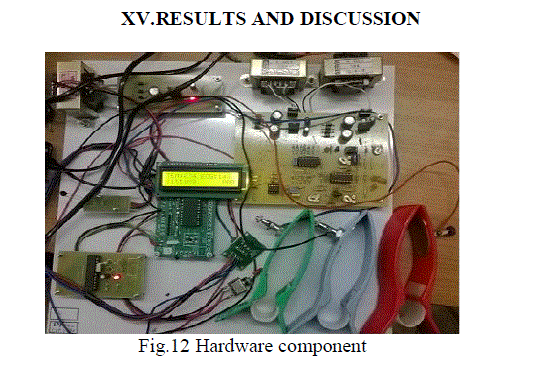 |
| In the Fig.12 These are the hardware component which I will use in this project to evaluate the human activity
recognition through wearable sensors. |
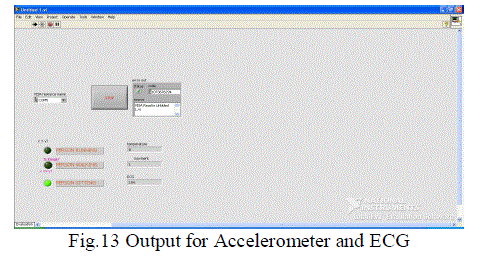 |
| In the Fig.13 While using hardware component will connect to the PC through RS232 serial communication to evaluate
the value for person sitting and ECG value will appeared. . This project surveys the state of the art in HAR based on
wearable sensors. |
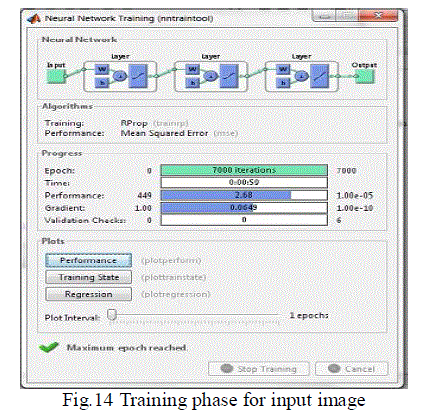 |
| In the Fig.14 In training phase, these are the window to trained the image to iterations. |
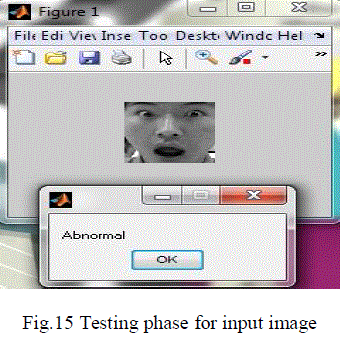 |
| In the Fig.15 In testing phase, the classifier of the given image to evaluate the image is normal or abnormal. |
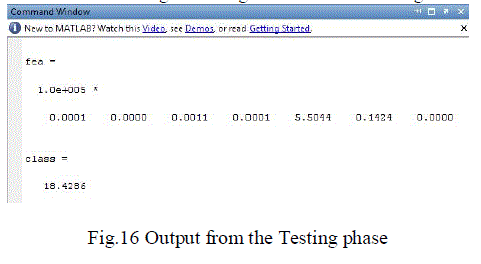 |
| In the Fig.16 The circles represent the data points or training samples used to predict the solid line going through most
of these samples. |
CONCLUSION |
| In this project, i implemented the state-of-the-art human activity recognition based on wearable sensors. The
fundamentals of feature extraction and machine learning are also included, as they are important components of every
HAR system. Systems like this will help in improving the field of human healthcare, safety and in many more areas.
The recognition of human activities has been approached in two different ways, namely using external and wearable
sensors. In the former, the devices are fixed in predetermined points of interest, so the inference of activities entirely
depends on the voluntary interaction of the users with the sensors. In the latter, the devices are attached to the user. The
feature extraction uses two techniques. Testing and training. In the training phase, couple of the user images are
processed and updated in the system. So during the testing phase, when images are feed into the system, the system
compares with the existing training data and validates the images. |
References |
- A. J. Perez, M. A. Labrador, and S. J. Barbeau, âÃâ¬ÃÅG-sense: A scalable architecture for global sensing and monitoring,âÃâ¬Ã IEEE Network, vol. 24,no. 4, pp. 57âÃâ¬Ãâ64, 2010.
- A. Khan, Y. Lee, and S. Lee, âÃâ¬ÃÅAccelerometerâÃâ¬Ãâ¢s position free human activity recognition using a hierarchical recognition model,âÃâ¬Ã in IEEE International Conference on e-Health Networking Applications and Services (Healthcom), pp. 296âÃâ¬Ãâ301, 2010.
- A. Khan, Y.-K. Lee, S. Lee, and T.-S. Kim, âÃâ¬ÃÅA triaxial accelerometer based physical-activity recognition via augmented-signal features and a hierarchical recognizer,âÃâ¬Ã IEEE Trans. Inf. Technol. Biomed., vol. 14, no. 5, pp. 1166âÃâ¬Ãâ1172, 2010.
- A. Tolstikov, X. Hong, J. Biswas, C. Nugent, L. Chen, and G. Parente,âÃâ¬ÃÅComparison of fusion methods based on dst and dbn in human activity recognition,âÃâ¬Ã J. Control Theory and Applications, vol. 9, pp. 18âÃâ¬Ãâ27, 2011.
- C. N. Joseph, S. Kokulakumaran, K. Srijeyanthan, A. Thusyanthan, C. Gunasekara, and C. Gamage, âÃâ¬ÃÅA framework for whole-body gesture recognition from video feeds,âÃâ¬Ã in International Conference on Industrial and Information Systems (ICIIS), pp. 4
- D. Choujaa and N. Dulay, âÃâ¬ÃÅTracme: Temporal activity recognition using mobile phone data,âÃâ¬Ã in IEEE/IFIP International Conference on Embedded and Ubiquitous Computing, vol. 1, pp. 119âÃâ¬Ãâ126, 2008
- D. Riboni and C. Bettini, âÃâ¬ÃÅCosar: hybrid reasoning for context-aware activity recognition,âÃâ¬Ã Personal and Ubiquitous Computing, vol. 15,pp. 271âÃâ¬Ãâ289, 2011.
- F. Foerster, M. Smeja, and J. Fahrenberg, âÃâ¬ÃÅDetection of posture and motion by accelerometry: a validation study in ambulatory monitoring,âÃâ¬Ã Computers in Human Behavior, vol. 15, no. 5, pp. 571âÃâ¬Ãâ583, 1999.
- J. Candamo, M. Shreve, D. Goldgof, D. Sapper, and R. Kasturi, âÃâ¬ÃÅUnderstanding transit scenes: A survey on human behavior-recognition algorithms,âÃâ¬Ã IEEE Trans. Intell. Transp. Syst., vol. 11, no. 1, pp. 206âÃâ¬Ãâ224, 2010.
|