ISSN ONLINE(2319-8753)PRINT(2347-6710)
ISSN ONLINE(2319-8753)PRINT(2347-6710)
Arunasakthi. K1 , KamatchiPriya.L2, Askerunisa.A3
|
| Related article at Pubmed, Scholar Google |
Visit for more related articles at International Journal of Innovative Research in Science, Engineering and Technology
The Support Vector Machine is a discriminative classifier which has achieved impressive results in several tasks. Classification accuracy is one of the metric to evaluate the performance of the method. However, the SVM training and testing times increases with increasing the amounts of data in the dataset. One well known approach to reduce computational expenses of SVM is the dimensionality reduction. Most of the real time data are non- linear. In this paper, F- score analysis is used for performing dimensionality reduction for non – linear data efficiently. F- score analysis is done for datasets of insurance Bench Mark Dataset, Spam dataset, and cancer dataset. The classification Accuracy is evaluated by using confusion matrix. The result shows the improvement in the performance by increasing the accuracy of the classification.
Key Terms |
| Support Vector Machine, Dimensionality Reduction, F- score Analysis, Confusion Matrix. |
INTRODUCTION |
| Now days, real world data such as electrocardiogram signals, speech signals, digital photographs has high dimensionality. In order to handle these high dimensional data in the analysis makes difficulty and complexity. To get the efficient access with these data, the high dimensional data should be transformed into meaningful representation of the low dimensional data. |
| A. Dimensionality Reduction |
| Dimensionality reduction is a process of extracting theessential information from the data. The highdimensional data can be represented in a more condensed form with much lower ,Dimensionality to both improve classification accuracy and reduce computational complexity. Dimensionality reduction becomes a viable process to provide robust data representation in relatively low-dimensional space in many applications like electrocardiogram signal analysis and content based image retrieval. Dimensionality reduction is an important preprocessing step in many applications of data mining, machine learning, and pattern recognition, due to the socalled curse of dimensionality.In mathematical terms, the problem we investigate can be stated as follows: Ddimensional data X = (x1 . . . . xD) is transformed into d dimensional data Y = (y1..... yd ). Dimensionality reduction captures the related content from the original data, according to some criteria. Feature extraction reduces the number of variables so that it can reduce the complexity which can improve overall performance of the system. |
| Data reduction can be applied on various applications like classification, regression, etc. In this paper, data reduction is applied on the classification problem and Support Vector Machine is used as the classifier. Accuracy is taken as a metric to evaluate the performance of the Support Vector Machine. |
| B. Dimensionality Reduction Techniques |
| Dimensionality reduction reduces the number of variables to improve the performance of the classification. High dimensional data is the major problem in many applications which increase the complexity by taking the more execution time. |
| There are number of techniques available for reducing the dimensionality of the data. Each and every technique reduces the dimensions of the data based on particular criteria. In recent years, Principal Component Analysis (PCA) , Linear Discriminant Analysis (LDA), and Independent Component Analysis(ICA) are regarded as the most fundamental and powerful tools of dimensionality reduction for extracting effective features from highdimensional vectors of input data. |
| In this paper, the feature selection is done by Fscore Analysis. F-score analysis is a simple and effective technique, which produce the new low dimensional subset of features by measuring the discrimination of two sets of real numbers. Minimizing the distance between the same classes and maximizing the difference between the different classes makes this feature selection effectively. Though many techniques available for classification problem most of the methods support only for linear data. But in the case of Support Vector Machine classifier, it can handle both linear and Non - linear data. The experiments give better performance with low dimensional data rather than the high dimensional data. |
| C. Objective |
| The main objective of this paper is to transform the high dimensional data into low dimensional data by reducing the number of variables on the dataset. In this paper, Dimensionality reduction improves the performance of the classification problem with the F-score analysis. Classification is the process of analysing the data that which belongs to which one of the class. There are number of techniques for the classification. Among these techniques, Support Vector machine handles both the linear and nonlinear data. On the other side, F-score is the simple and effective technique to select the meaningful information from the high dimensional data. |
| Dimensionality reduction reduces the dimension of the original data that will automatically increase the performance of the classifier by decreasing the execution time & space complexity. This paper mainly focuses on to improve the accuracy of the classifier by reducing the dimension of the original data. |
RELATED WORK |
| In this section, the various techniques which are already used in several applications are discussed. Linear Discriminant Analysis is one of the techniques which reduce the data by finding the linear discriminants. Zizhu [1] uses Linear Discriminant Analysis (LDA) to reduce the dimensions on linear data. It is found that, the major problems of LDA are Small Sample Size (SSS) Problem, Singularity and Common Mean (CM) Problem. LDA is extended Joint Global and Local Linear Discriminant analysis (JGLDA) [2] to represent both local and global structure of the data. It is found that, the major problems of LDA are singularity problem and Small Sample Size (SSS) Problem. LDA/QR composition method solves the problem of singularity [3]. Jing Peng [4] finds the linear discriminants using regularized least squares and Yuxi Hou [5] used null based LDA (NLDA) to solve the Small Sample Size problem. Fisher Linear Discriminants (FLD) [6] and Generalized Discriminant Analysis (GDA)[7] are some other techniques to handle linear data. |
| Principal Component Analysis (PCA) is an unsupervised technique projects the uncorrelated data. The major problem of PCA is sensitive to outliers. Two dimensional PCA (2D PCA), Robust Principal Component Analysis (RPCA) are used to overcome the problem of outliers [8][9]. PCA based on L1-norm is less sensitive to outliers rather than the PCA based on L2-norm [10]. |
| F-score analysis is a simple and effective technique to select the most relevant feature from the dataset. It finds the subset by analysing all the features and maximizing the distance between the different classes and minimizing the distance within classes. It can be used to handle the nonlinear data and removes the irrelevant and redundant data from the high dimensional space and gives the relevant data in the form of low dimensional data[11]-[14]. |
| Support Vector Machine (SVM) is an effective classifier, which is used to handle linear and non – linear data. By comparing with other techniques, SVM works very well in the presence of few data samples and exploits a margin-based geometrical approach rather than the statistical methods [15]-[19]. Though it works well, it is not suitable for the high dimensional data. The Performance of the SVM is degraded when the dimensions of the data is increased. The effetiveness of the feature reduction is shown on speaker verification and the accuracy is improved with the low dimensional data [20]. |
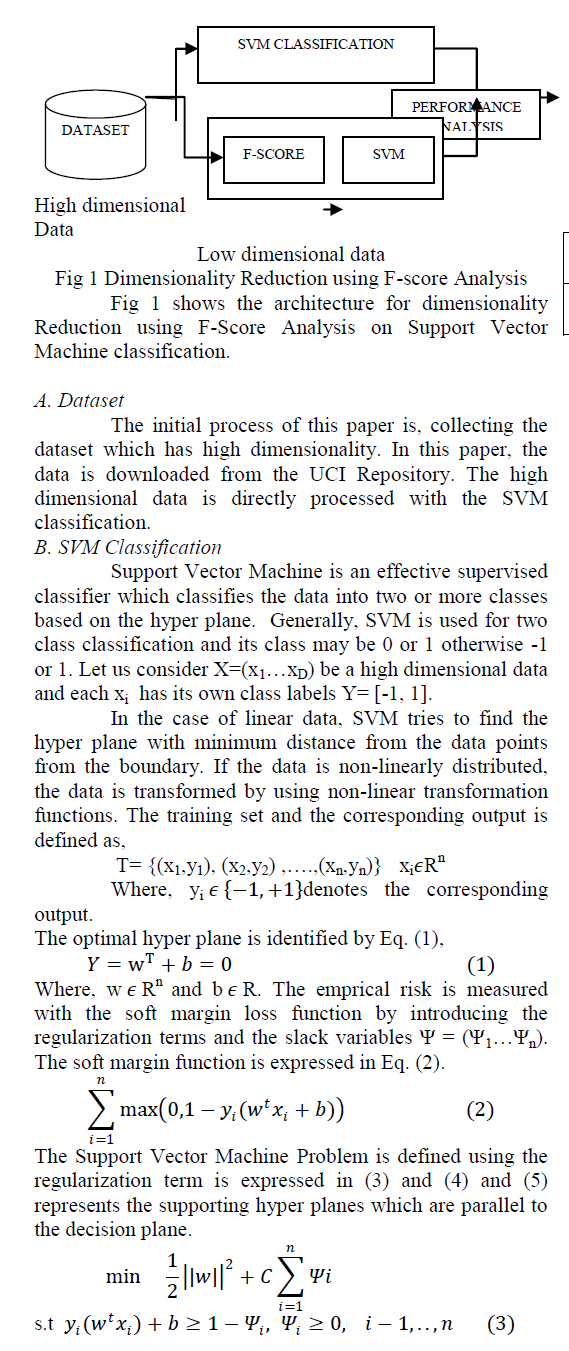
| In real world, most of the data is in the form of non-linear and high dimensionality. Taking all these data for the analysis cause to increase the complexity and it consumes more time for execution. To reduce the complexity of the system the dimensions of the data should be reduced into low dimesional data. In this paper, F-score analysis is chosed as a technique to reduce the dimensions of the data, which can handle the non-linear data. To show the effectiveness of the dimensionality reduction, it is applied on the Support Vector Machine Classifier. |
METHODOLOGY |
 |
 |
| a) Select features which are below the threshold. |
| b) Split the data into train data and valid data |
| c) X = train data; Go to step 5; |
| 7) Choose the threshold with lowest average validation error. |
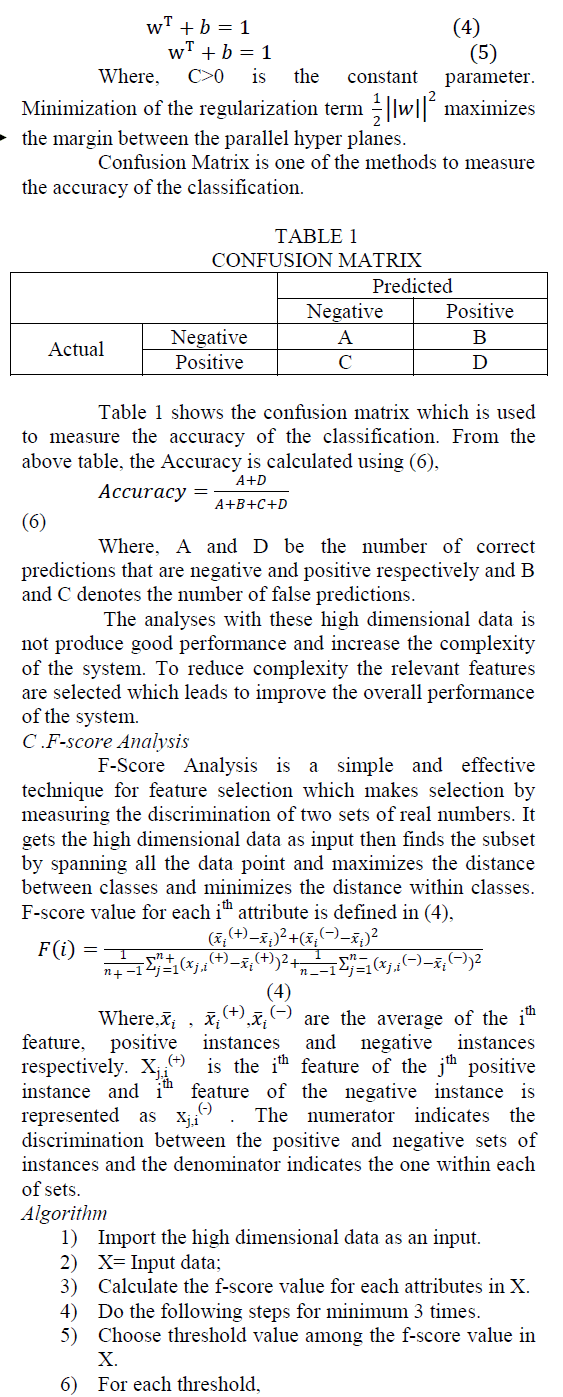
| 8) Drop features whose f-score values are below the threshold. |
| The data with low dimensions are again processed with the Support Vector Machine. SVM works on the new data and the performance of the classification is evaluated by measuring the accuracy. |
EXPERIMENTAL RESULTS |
| In this section, the performance of the SVM with high dimensional data and the low dimensional data is evaluated. The result shows the better performance with the low dimensional data which are the more relevant for the analysis. |
| In this paper, we utilize three datasets, „Insurance Bench MarkâÃâ¬ÃŸ, „Spam BaseâÃâ¬ÃŸ and „Lung-Cancer datasetâÃâ¬ÃŸ from the UCI repository. Result on these data shows the effectiveness of the proposed feature selection technique in terms of accuracy. |
| In Insurance Bench Mark dataset, there are 5822 instances and 86 attributes to analyse whether the person is eligible to get insurance. In each record of the dataset, 85 variables represent the personal details of each person. 86th attributes represents the class label. In Spam Base dataset, 4600 records with 58 attributes to analyse whether the mail is spam. 32 instances and 57 attributes are presented in the Lung – cancer dataset. This paper is done on Matlab environment. |
| A. Result of SVM |
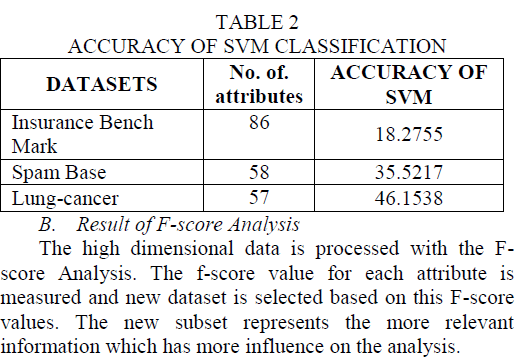
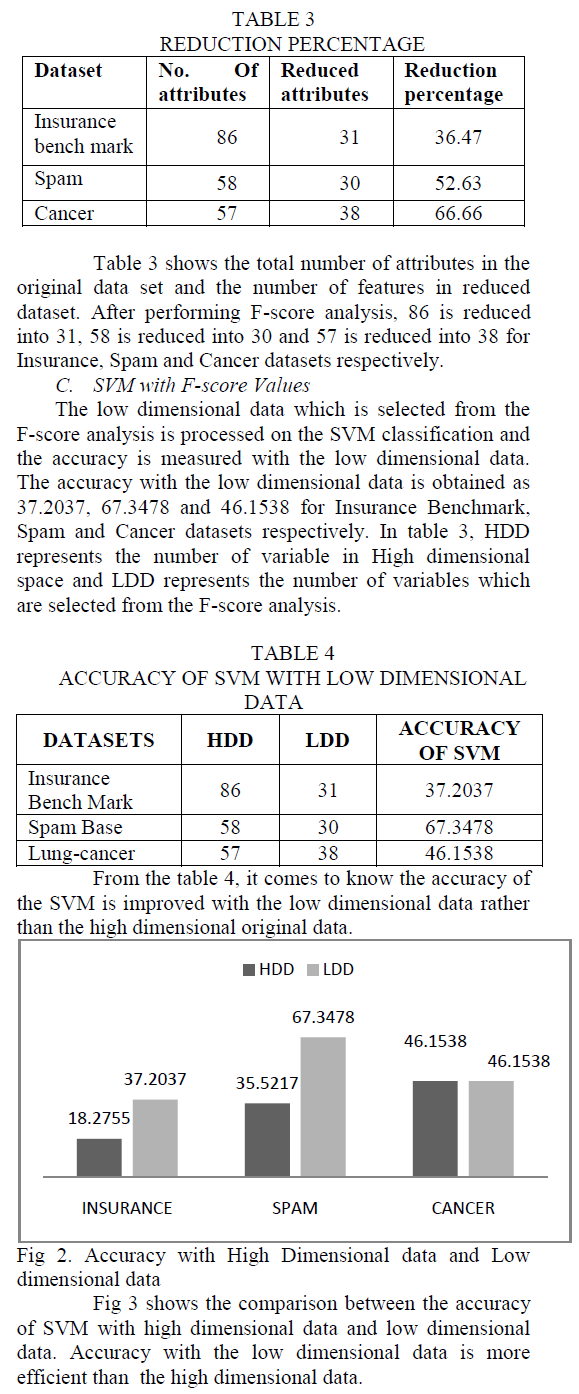
| These high dimensional data is processed on the Support Vector Machine Classification. Accuracy is taken as a, metric to evaluate the performance of the SVM classification. SVM with original data produce the accuracy as 18.2755, 35.5217 and 46.1538 for Insurance Bench Mark, Spam Base and Lung-cancer datasets respectively. The results are shown in table 2. |
 |
 |
CONCLUSION |
| In this paper, F-score Analysis is used as a feature selection technique to reduce the dimensions of the data which was validated on SVM classifier. The F-score feature selection works well by selecting the subset from the data based on the threshold value thereby eliminating the unwanted data. Though it improves the performance, there exists a problem that which is not suitable for redundant data. |
| This work can be continued by implementing hybrid techniques (F-score with machine learning techniques like Principal Component Analysis (PCA), Linear Discriminant Analysis (LDA), Independent Component Analysis (ICA), etc). Here we implement the analysis on classification; it can also be applied on regression problems. |
References |
|