ISSN ONLINE(2319-8753)PRINT(2347-6710)
ISSN ONLINE(2319-8753)PRINT(2347-6710)
Naseer M. Hadi1, Sabah H. Sabeeh 2 and Mustafa M. R. Sabhan3
|
| Related article at Pubmed, Scholar Google |
Visit for more related articles at International Journal of Innovative Research in Science, Engineering and Technology
In the present work, a pulsed Fe plasma generation by Q-switched Nd: YAG laser. The energy per pulse at the target surface was fixed at a level of (475 mJ, 6 ns), focused on Fe solid target at atmospheric pressure and vacuum pressure (1×10⁻¹ mbar).The plasma temperature was measured from Boltzmann plot using six Fe I spectral lines at the wavelengths (501.2, 534.1, 556.9, 576.2, 602.4 and 623.07) nm. The electron density was measured by means of Stark broadening formula (FWHM) for spectral lines Fe I at line transition 576.2 nm and for Fe I at line transition 556.9 nm as the reference electron density, at atmospheric pressure and vacuum pressure. The density was 8.2x1018 cm-3 and electron temperature 1.466 eV at atmospheric pressure, the electron density was 9x1018 cm-3 and the electron temperature 1.711 eV at pressure (1×10⁻¹) mbar. Measurements were done based on theory of local thermodynamic equilibrium (LTE) in the range (500-650 nm) of emitted spectrum
Keywords |
| Laser-produced plasma; Plasma parameters; Fe plasma; Temperature; Electron density. |
INTRODUCTION |
| Laser-produced plasma spectroscopy (LPPS) also called Laser Induced Plasma spectroscopy (LIPS) is one of the most fruitful methods using solid, liquid and gas target. LPPS uses a low-energy pulsed laser (typically tens to hundreds of mill joules per pulse) to generate a plasma which vaporizes a small amount of the sample [1]. The invention of the laser produced plasma in the mid-1970s led to increase in knowledge on interaction between electromagnetic fields and matter. Laser-produced plasmas applied to various areas in different fields of science. Laser produced plasma is better than an electric discharge because of the high efficiency, cleanliness and large collection angle [2]. Plasmas and laser-produced plasma applications classified as [3-6]. Plasma processing such as plasma surface cleaning, plasma thin film deposition, plasma hardening and plasma in medicine such as surface treatment, sterilization of medical instruments. Laser produced plasma has high temperature and high electron density gradient, this plasma is also high irradiative, it’s emitted a spectrum deepening on the target, the emitted spectrum gives information about the target. Spectroscopic method is one of plasma diagnostic, which can used it to measure the electron temperature and electron density from the emitted spectrum [7]. |
| Temperature is one of the most important parameters used to characterize the state of the plasma. Most important spectroscopic techniques, for electron temperature, are the ratio of lines produced in sequential charge states of a single species. An accurate knowledge of the temperature leads to an understanding of the occurring plasma processes, namely vaporization, dissociation, excitation, ionization and transition probability. Plasma electron temperature can be measured from the relative intensity of two or more optically thin lines having small separation in the emission wavelength and large separation in their upper excited states (Boltzmann plot method) [8]. Moreover, the ionization temperature can be calculated from the relative intensity of two or more lines originating from two consecutive ionization stages. This method enhances the precession in measuring temperature due to enhancement of the separation of the upper excited states by the ionization energy (Saha-Boltzmann plot) [9]. |
| On the other hand, the electron density can be measured using the Stark broadening formula of optically thin emitted spectral lines from neutral atoms or ions with the help of the precise Stark broadening parameters that can be found in different standard Tables [10,11]. |
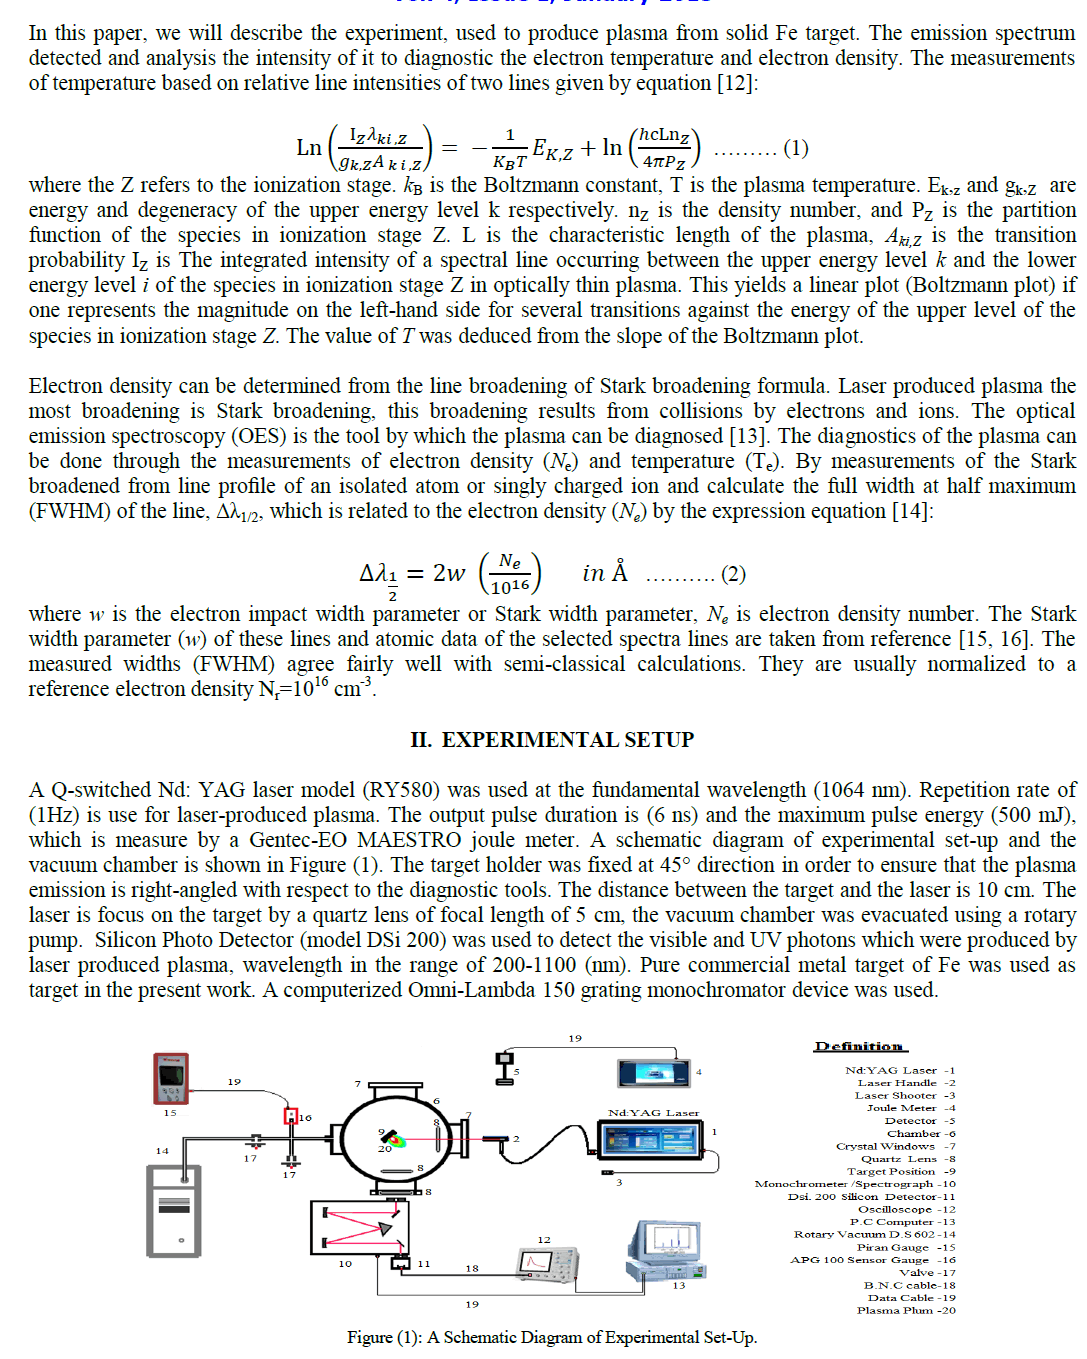 |
RESULTS AND DISCUSSIONS |
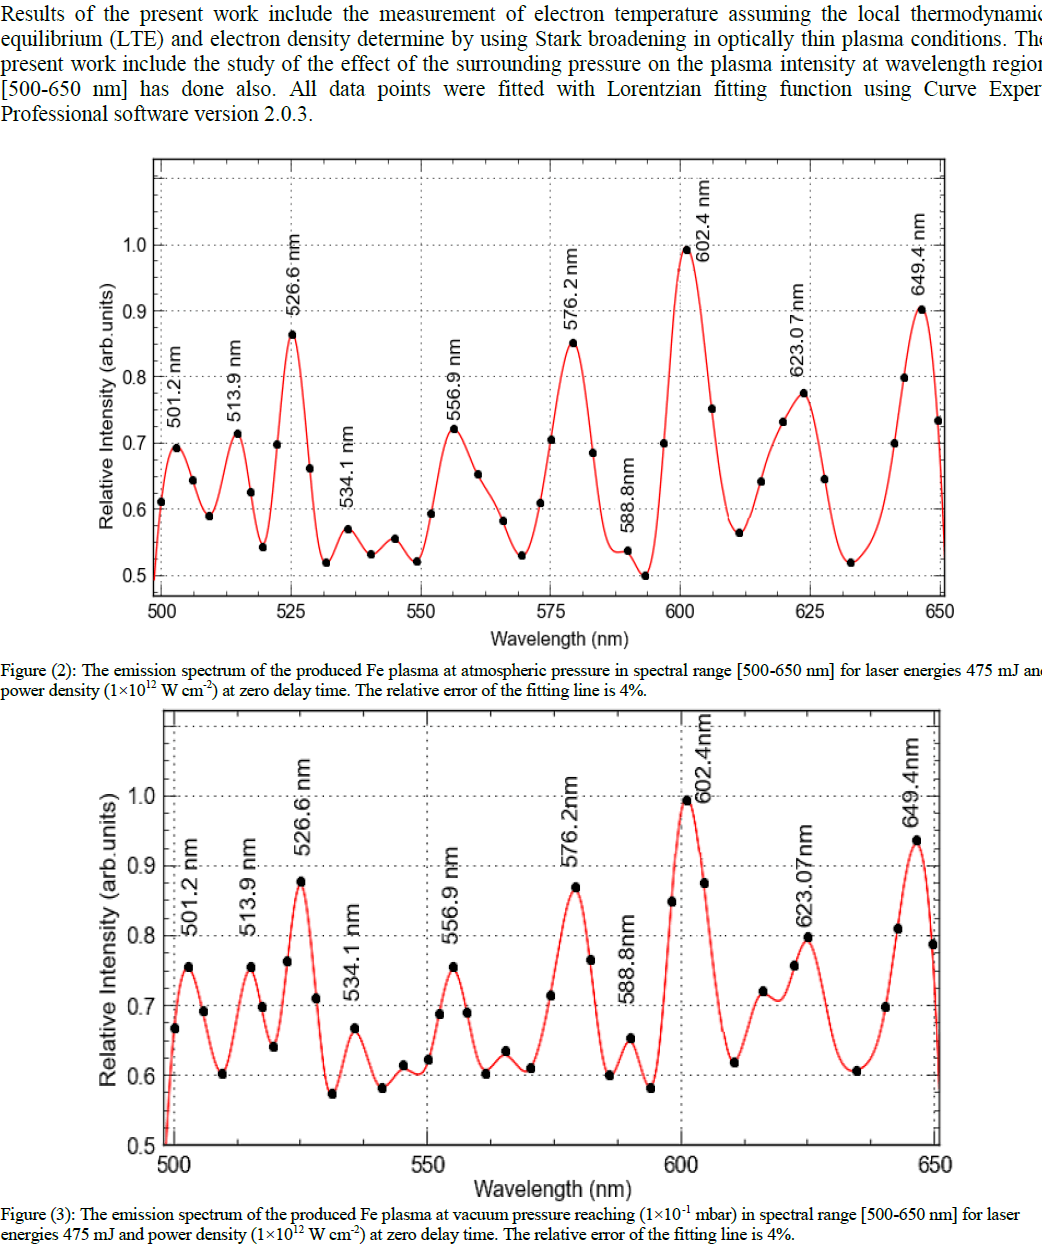 |
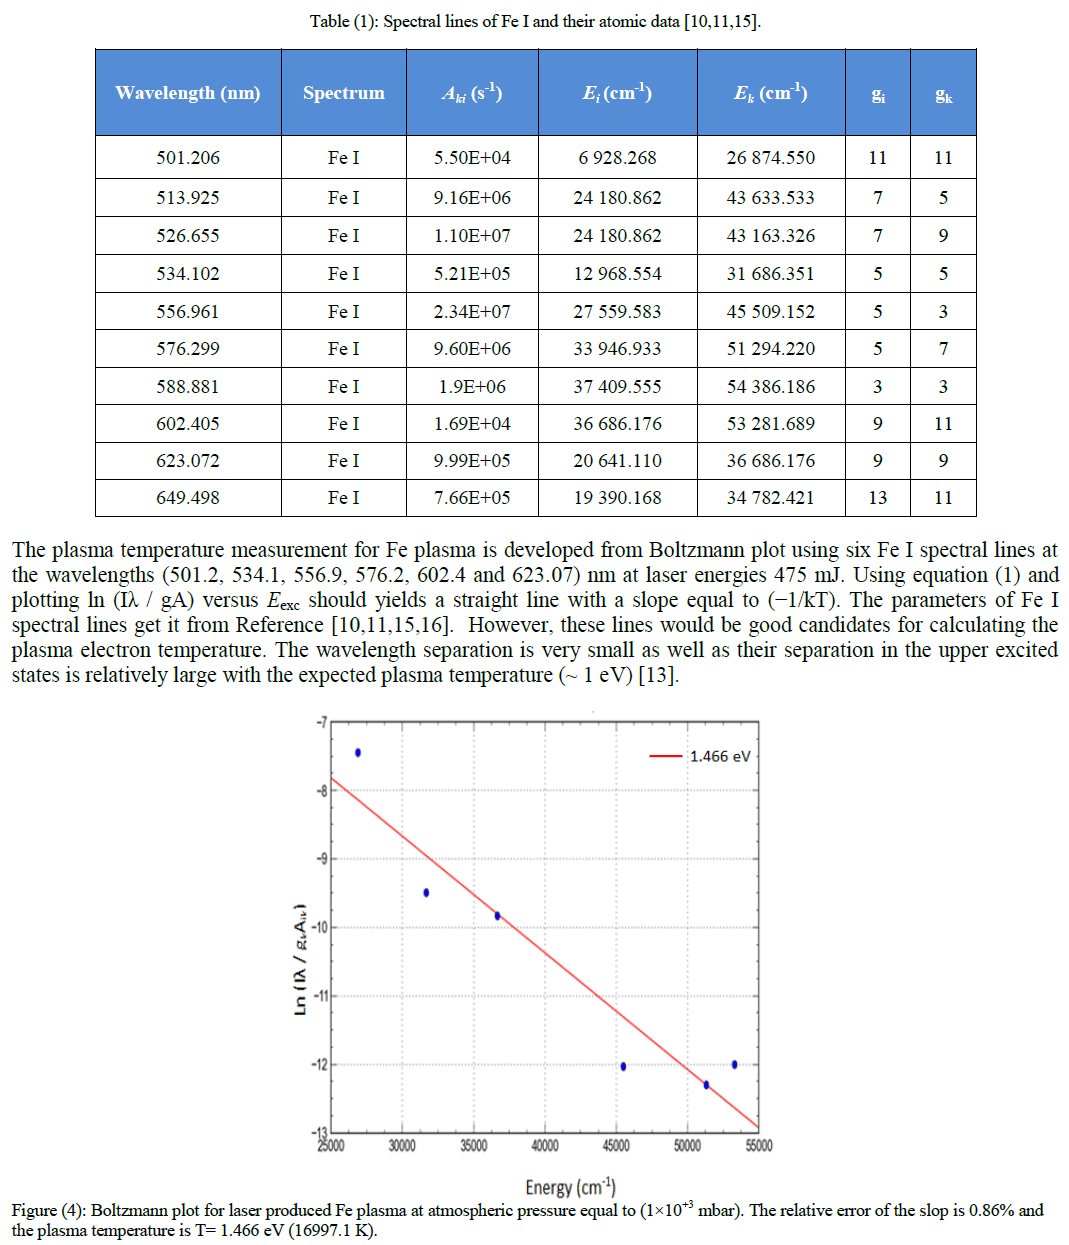 |
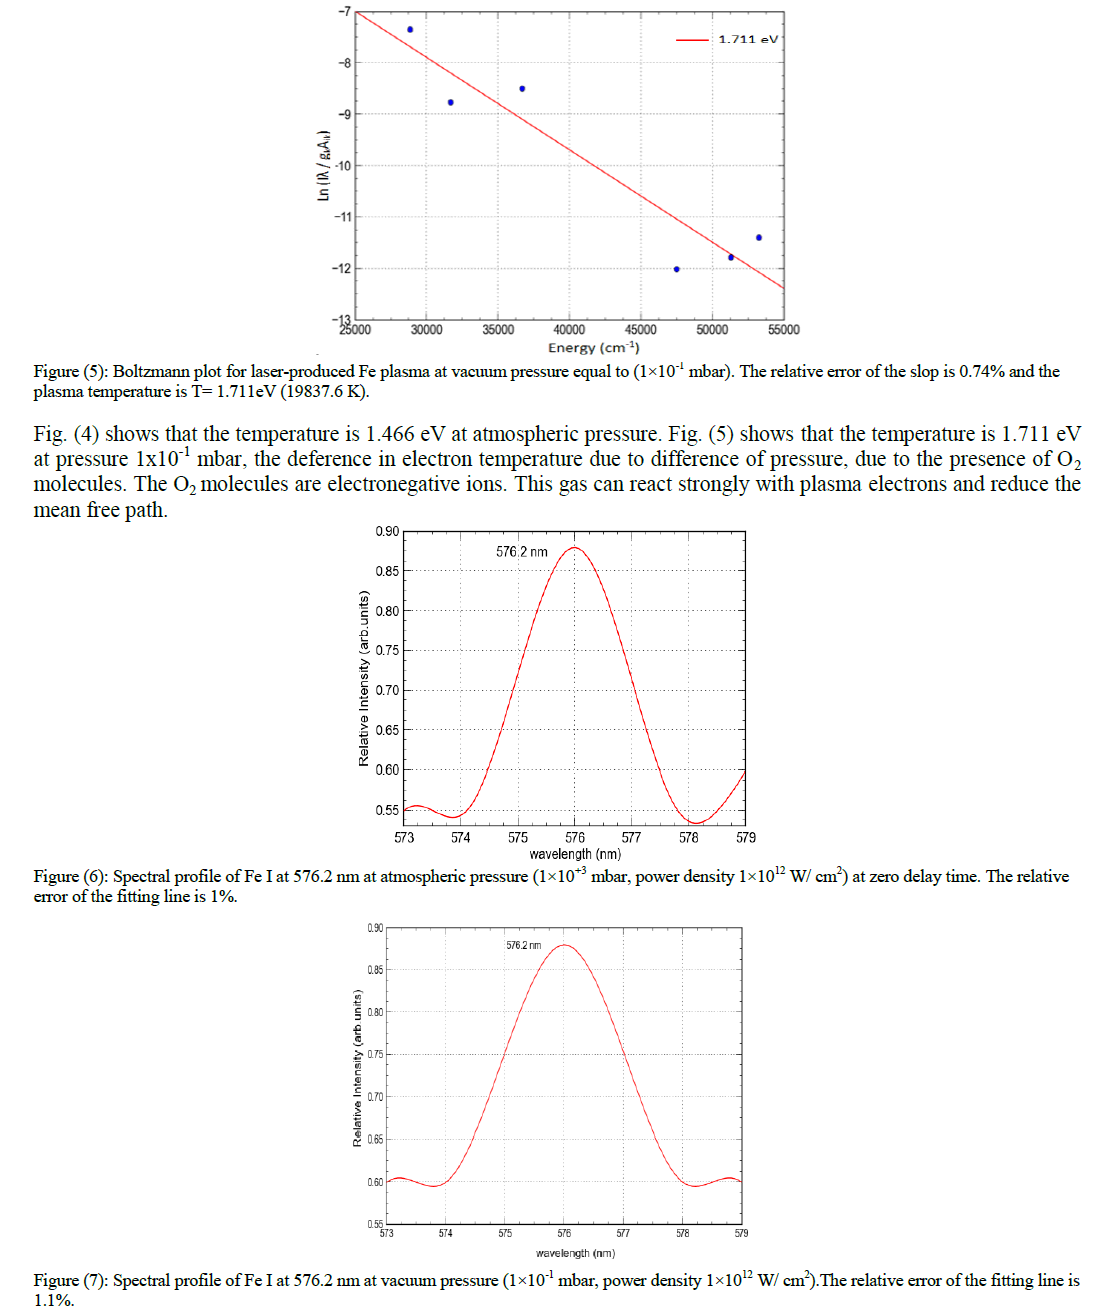 |
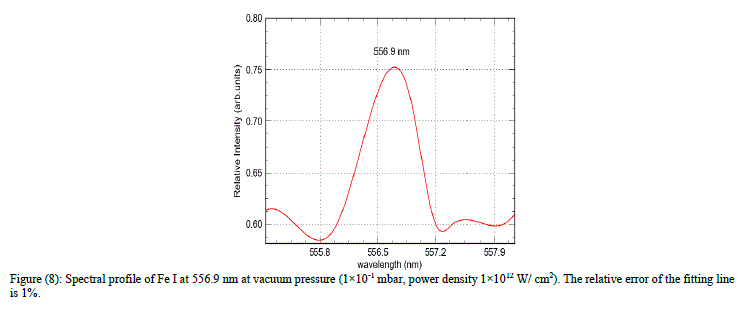 |
| Plasma generated by laser characterized by high density, so Stark effect is leads to a broadening of emitted lines. By using equation (2) we determine the electron density of spectral lines Fe I at line transition 576.2 nm at atmospheric pressure as shown in Fig. (6) and Fe I at 576.2 nm at pressure 10-1 mbar as shown in Fig. (7). The electron density is (8.2x1018 cm-3) at atmospheric pressure and at pressure 10-1 mbar the electron density is (9x1018 cm-3). Also the electron density measured for spectral lines Fe I at line transition 556.9 nm at pressure 10-1 mbar as shown in Fig. (8), the electron density is (9.2×1018 cm−3). Effect of O2 on the temperature can be seen also on the electron density. Results of the present work shows, the higher temperatures and electron densities are obtained in vacuum pressure (1×10⁻¹ mbar), and the lower ones are found in atmospheric pressure. The presence of this line was attributed to the existence of a very small concentration of water vapour (humidity) around the target [17]. |
CONCLUSION |
| We have measured the plasma electron temperature using six spectral lines for electron temperature measurement and two lines for electron density measurement emerging from iron in LPP experiment. Temperature was calculated from line intensity ratios of successive ionization stages of iron and using six Fe I spectral lines for measured the plasma electron temperaturein order to get more accuracy in measurement. The density was determined from the Stark broadening of iron lines from its first ionization stage, and results from both lines were identical within experimental error. Also compare the results generated under the two types of environment air, a first under atmospheric pressure and secondly under vacuum pressure. Results showed a higher temperature value and density at vacuum pressure compared to the results that appeared at atmospheric pressure. Because of oxygen molecules that constantly surround the plasma, where it leads to reduce the mean free path between molecules and leads to reduce the number of collisions between plasma molecules. Plasma expands rapidly, but this expansion is slowed down and finally stopped by the resistance of oxygen molecules around the target. The electron density were re-evaluated and compared to reference density utilizing the Fe I at line transition 556.9 nm. This comparison shows an excellent agreement between the reference density and the measured utilizing the iron emission lines. |
References |
|