Clustering is the unsupervised learning problem. Better Clustering improves accuracy of search results and helps to reduce the retrieval time. Clustering dispersion known as entropy which is the disorderness that occur after retrieving search result. It can be reduced by combining clustering algorithm with the classifier. Clustering with weighted k-mean results in unlabelled data. Unlabelled data can be labelled by using neural network and support vector machines. A neural network is an interconnected group of nodes, for classifying data whereas SVM is the classification function to distinguish between members of the two classes in the training data. For classification we use neural networks and SVM as they can recognize the patterns.
Keywords |
| Clustering, Weighted k-mean, Neural network classifier, SVM classifier, Entropy reduction system. |
I. INTRODUCTION |
| Web mining is the process of retrieving the data from the bulk amount of data present on web according to user need. This
is important to the overall use of data mining for companies and their internet/ intranet based applications and information
access. Usage mining is valuable not only to businesses using online marketing, but also to e-businesses whose business is
based solely on the traffic provided through search engines. The use of this type of web mining helps to gather the
important information from customers visiting the site. But in the search results, there is often a lot of randomness and
inaccuracy due to improper clustering and classification. |
| Clustering is the unsupervised learning problem. Clusters are made on the basis of similar characteristics or similar
features. Clustering is defined as the process to maximize the intercluster dissimilarity and minimize the intracluster
dissimilarity. After clustering, the classification process is performed so as to determine the labels for the data tuples that
were unlabelled (no class). But Entropy is the disorderness that occurs after retrieving search results. This occurs as due to
dispersion in clustering. |
II. RELATED WORK |
| A.CLUSTERING-The unlabelled data from the large dataset can be classified in an unsupervised manner using clustering
algorithms. Cluster analysis or clustering is the assignment of a set of observation into subsets (called clusters) so that
observations in same cluster are similar in some sense. A good clustering algorithm results in high intra cluster similarity
and low inter cluster similarity [1]. |
| B. TYPES OF CLUSTERING ALGORITHMS |
| Exclusive clustering-In this data are grouped in an exclusive way, so that if a certain datum belongs to a definite cluster
then it could not be included in another cluster. It includes k mean algorithm. |
| Overlapping clustering- the overlapping clustering, uses fuzzy sets to cluster data, so that each point may belong to two or
more clusters with different degrees of membership. It includes fuzzy c mean. |
| Hierarchical clustering- This is based on the union between the two nearest clusters. |
| Probabilistic clustering- This kind of clustering use a completely probabilistic approach. It includes the mixture of
Gaussian algorithm. |
III. NEED FOR HYBRID CLUSTERING AND CLASSIFICATION ALGO |
| Accuracy-search results must be accurate. |
| Fast retrieval-Data retrieval time must be fast. |
| Entropy reduction-Dispersion in the retrieved data leads to unreliability. |
| Outlier detection-Detection of irrelevant or exceptional data. |
IV. WEIGHTED K MEAN FOR CLUSTERING |
| In text clustering, clusters of documents of different topics are categorized by different subsets of terms or keywords. Data
sparsity problem is faced in clustering high-dimensional data. In this algorithm, we extend the k-means clustering process
to calculate a weight for each dimension in each cluster and use the weight values to identify the subsets of important
dimensions that categorize different clusters [2]. |
| It include three steps- |
| A. Partitioning the objects- After initialization of the dimension weights of each cluster and the cluster centers, a cluster
membership is assigned to each object [2].The distance measure minkowski is used over Euclidean distance because it can
be used for higher [2]dimensional data. |
 (1) (1) |
| where d=dimensionality of data |
| p=1 for manhattan metric. |
| xi,xj=distance betweentwo clusters. |
| B. Updating cluster centers-To update cluster centers is to find the means of the objects in the same cluster [2]. |
| C.Calculating dimensions weights-whole data set is analyzed to update dimension weights [2]. |
V. NEURAL NETWORK AS CLASSIFIER |
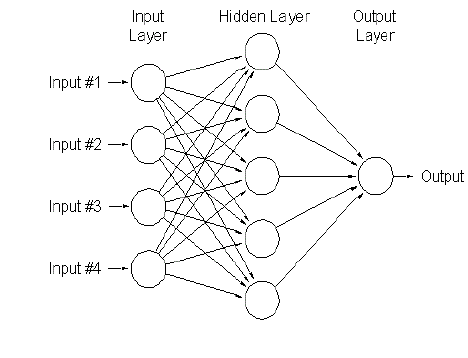
| A neural network is an interconnected group of nodes, a kin to the vast network of neurons in a brain. It is used for pattern
recognition. Here, each circular node represents an artificial neuron and an arrow represents a connection from the output of
one neuron to the input of another. Neural network is of two types- |
| Artificial method. |
| Feed forward method |
| A.Advantages of using neural- |
| High tolerance of noisy data [3]. |
| Can classify the data on which it has not been trained. |
| Classifier that can reduce entropy effectively. |
| Takes the input of clustering algorithm. |
VI. SVM AS CLASSIFIER |
| SVM
stands for support vector machine. It is very useful in Information retrieval (IR) target recognition [11]. It offers one
of the most robust and accurate results and is insensitive to the number of dimensions.SVM is the classification function to
distinguish between members of the two classes in the training data [9]. |
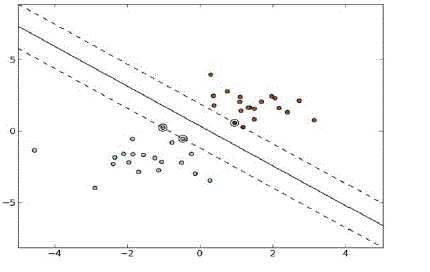
| A.Linear SVM-For a linearly separable dataset, a linear classification function is used that corresponds to a separating
hyper plane f(x) that passes through the middle of the two classes, separating the two. Once this function is determined, new
data instance xn is produced that can be further classified by simply testing the sign of the function f(xn). To ensure that
the maximum margin hyper planes are actually found, an support vector machine classifier attempts to maximize the
following function[9] with respect to w and b: |
 (2) (2) |
| where t is the number of training examples. αi,i = 1, . . . , t, are non-negative numbers ,Lp is called the Lagrangian,Vectors
w and constant b define the hyper plane [9]. |
| B. Non linear SVM |
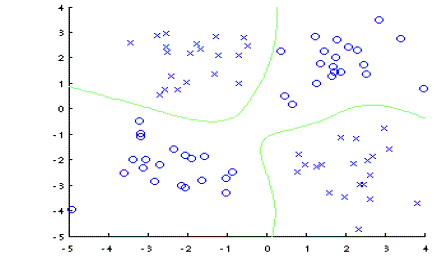
| In
this kernel function is added and it make SVM more flexible [10]. |
| C. Advantages of SVM- |
| 1) Can provide good generalization[10]. |
| 2) SVM can greatly reduce the entropy of retrieved results[10]. |
VIII. ENTROPY FACTOR OF CLUSTERING |
| It is very important theory in the case of information theory (IT), which can be used to reflect the uncertainty of systems.
From Shannon’s [4] theory, that information is the eliminating or reducing of people understanding the uncertainty of
things [4]. He calls the degree of uncertainty as entropy. |
| Supposing a discrete random variable X, which has x1, x2 ,..., xn , a total of n different values, the probability of xi appears
in the sample is defined as P( xi ), then the entropy of random[4] variable X is: |
 |
| Entropy value ranges between 0 and 1. If H (P) = 0 (means close to 0), it indicates the lower level of uncertainty, and the
higher similarity in the sample. On the other hand, if H (P) =1, it indicates the higher level of uncertainty, the lower
similarity in the sample. For instance, in the real network environment, for a particular type of network attack, the data
packets show a certain kind of characteristics. For example, DoS attacks, the data packets sent in a period of time are quite
more similar in comparison to the normal network packets, which show smaller entropy, that is, the lower randomness.
Another example is a network probing attack, which scans frequently a specific port in a certain period of time, so the
destination ports will get smaller entropy compared with the random port selection of normal packets.
As an effective measure of uncertainty, the entropy, proposed by Shannon [5], has been a useful mechanism for
characterizing the information content in various modes and applications in many diverse fields. In order to measure the
uncertainty in rough sets, many researchers have applied the entropy to rough sets, and proposed different entropy models
in rough sets. Rough entropy is an extend entropy to measure the uncertainty in rough sets. Given an information system IS
= (U, A, V, f), where U is a non-empty finite set of objects, A is a non-empty finite set of attributes. For any B⊆A, let
IND(B) be the equivalence relation as the form of U/IND(B) = {B1,B2, ...,Bm}. The rough entropy E(B) of equivalence
relation IND(B) is defined by[5]: |
 (3) (3) |
| where|Bi| |U| denotes the probability of any element x∈ U being in equivalence class Bi; 1 <= i <=m. And |M| denotes the
cardinality of set M. |
IX.CONCLUSION |
| In this paper, we have presented weighted k mean clustering algorithm as it is suitable for high dimensional data and also
outlier detection occur efficiently. In order to label the unlabelled data, we have presented classification by neural networks
because neural can be effectively used for noisy data and it can also work on untrained data. Using this hybrid technique,
entropy of the retrieved data can be reduced and also retrieval time, accuracy can be greatly enhanced. |
Tables at a glance |
 |
| Table 1 |
|
| |
Figures at a glance |
 |
 |
 |
| Figure 1 |
Figure 2 |
Figure 3 |
|
| |
References |
- Vipin Kumar, HimadriChauhan and DhirajPanwar, “K-Means Clustering Approach to Analyse NSL-KDD Intrusion Detection Dataset”, Vol.3, Issue-4, Sept 2013.
- LipingJing,Michaelk.Ng,JoshuaZhexue Huang, “ An entropy weighting k-mean algorithm for subspace clustering of high dimensional sparse data”,IEEE transactions on knowledge and data engineering,Vol.19,no.8,August 2007.
- Son lam Phung and Abdesselambouzerdoum, “A pyramidal Nueral network for Visual pattern recognition”,IEEE transactions on neuralnetworks,vol.18,no.2,March 2007.
- QuanQian, Tianhong Wang and Rui, Zhan, “Relative Network Entropy based clustering Algorithm for Intrusion detection”, Vol.15, No. 1,pp.16-22,Jan,2013.
- Xiangjun Li and Fen Rao “An rough entropy based approach to outlier detection”, Journal computational information systems, Vol. 8 ,pp. 10501-10508, 2012.
- J. Y. Liang, Z. Z. Shi., “The information entropy, rough entropy, knowledge granulation in rough set theory”, International Journal of Uncertainty, Fuzziness and Knowledge-Based Systems, 12 (1), pp. 37 – 46, 2004.
- Velmurugan T., and Santhanam T., "Performance Evaluation of K-Means and Fuzzy C-Means Clustering Algorithms for Statistical Distributions of Input Data Points," European Journal of Scientific Research, vol. 46, no. 3, pp. 320-330,2010.
- Z. Deng, K. Choi, F. Chung, and S. Wang, “Enhanced Soft Subspace Clustering Integrating Within-Cluster and Between Cluster Information,” Pattern Recognition, vol. 43, no. 3, pp. 767-781, 2010.
- Xindong Wu, Vipin Kumar ,J. Ross Quinlan , JoydeepGhosh , Qiang Yang,Hiroshi Motoda , Geoffrey J. McLachlan, Angus Ng, Bing Liu,Philip S. Yu ,Zhi-Hua Zhou ,Michael Steinbach , David J. Hand ,Dan Steinberg , “Top 10 algorithms in data mining” ,knwlinfsyst,Vol 14,pp.1-37,2008.
- Laura Auria and Rouslan A. Moro, “Support Vector Machines (SVM) as a Technique for Solvency Analysis”,2008.
- Feng Wen-ge , “Application of SVM classifier in IR target recognition” ,Physics procedia,Vol.24.pp. 2138-2142,2012.
|