ISSN ONLINE(2319-8753)PRINT(2347-6710)
ISSN ONLINE(2319-8753)PRINT(2347-6710)
P. Jamuna, G. Mohana Prabha
|
| Related article at Pubmed, Scholar Google |
Visit for more related articles at International Journal of Innovative Research in Science, Engineering and Technology
Finding the patterns and outliers is one of the major problems in the field of data mining. Especially in the field of health care analysis has become difficult to predict the patterns and decision making. Classification techniques are used to identify the transaction label. The classification techniques are used to collect the patterns in the learning phase and detect the outliers in training phase. In health care analysis, only classifications are limited with two class levels as positive and negatives. The symptoms of patients are collected and categorized into patterns then by using the patterns; they detect the severity level of diseases. The proposed system mainly focuses on detecting the severity level of patients by enhancing the boundary classifications. This idea can be achieved by critical nuggets which is a record or attribute used to define classification where that attribute considered as the deciding authority. The classification accuracy can be improved with critical nuggets and enhancing to support multi class (low, medium, high and normal) and multiple attribute environment.The critical nuggets identification and classification scheme is improved to support multiple classes. The system can be adopted to handle mixed attribute data values. The boundary approximation algorithm is enhanced to reduce the detection complexity. Post processing operations are tuned to identify classes for multiple category data environment.
Index Terms |
| Database management, Data mining, Classifications, Patterns mining, Outliers, Critical nuggets, Bayesian classification, Decision tree classification, Distance based outliers detection |
INTRODUCTION |
| In recent times, database management systems are widely used in many fields for storing the data. The collection of data, usually referred to as the database, where information used to an enterprise. The primary goal of database management systems is to provide a way to store and retrieve database. Database systems are designed to manage large bodies of information. The data management involves both defining structures for storage of information and providing mechanisms for the manipulation of information. |
| Then in addition, the database system must ensure the safety of the information stored, if there exists system crashes or attempts at unauthorized access. |
| Due to wide availability of huge amounts of data in forms and imminent need for turning such data into useful information and knowledge for broad applications including marketing analysis, business management and decision support, where Data mining plays an important role in the information industry. Data mining is the process of sorting through large amounts of data and picking out relevant information[8]. It has been described as “the non-trivial extraction of implicit previously unknown and useful information from data” and “science of extracting useful information from large dataset”.The advantages of data mining is handling huge information in an efficient manner. |
| Data mining in relation to enterprise resource planning is the statistical and logical analysis of large set of transaction data, looking for pattern that can aid decision making. And some of applications of data mining, where prediction of values based on past examples, and associations between purchases are found, and clustering of people and movies are done automatically. Data mining attempts to discover patterns and rules of the databases. However, it differs from machine learning andstatistics in that it deals with large volumes of data, stored primarily on disk. |
 |
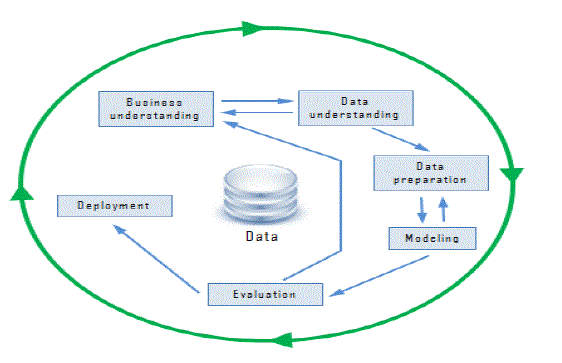
| Fig No: 1.1 Process of Data mining |
| There are a variety of possible types of patterns that may be useful, and different techniques are used to find different types of patterns. Usually there is a manual component to data mining, consisting of pre-processing data to a form acceptable to the algorithms and post processing of discovered patterns to find novel ones that could be useful. There may also be morethan one type of pattern that can be discovered from a given databases and manual interaction may be needed to pick useful types of patterns. |
OVERVIEW |
| Data mining are mainly used to provide the overall goal of the process is to extract information from datasets and transform it into an understandable structure. It involves six classes of task are 1.Anomaly detection which is the identification of unusual records. 2. Association rule mining which searches for relationship between variables and sometimes referred to as market basket analysis. 3. Clustering which is the task of discovering groups and structures in data that are in some way or another similar without using known structure in data. 4. Classification which are the task of generating known structure to apply to new data. 5. Regression which attempts to function which models that data with the least error. 6. Summarization which is providing a more compact representation of data set including visualization and report generation. Further it describes briefly about tasks with example below. |
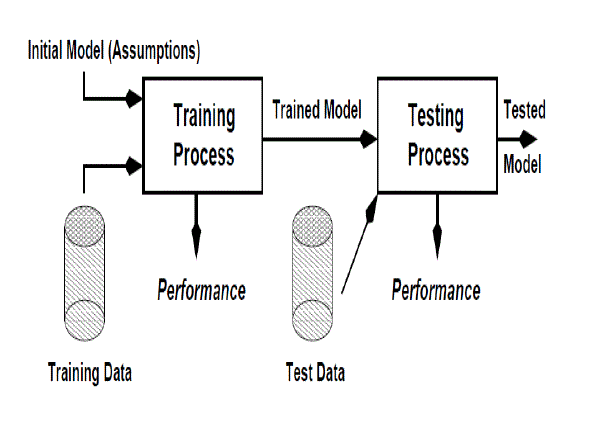
| 1. Classifications- The classifications are used assign the label to unclassified data. It involves two basic phases are learning or training phase and testing phase. In learning or training phase, collects the trained datasets are patterns learned in which the patterns means the repeated items. This can be achieved by using Bayesian classification or decision tree classification. In testing phase, outliers are detected by using distance based outlier detection. It can be done by finding rules that partition the given data into disjoint groups. |
 |
| Fig No: 2.1 Classification Processes |
| For example, suppose that a credit card company wants to decide whether or not give a credit card to an applicant. The company has a variety of information about the person such as age, educational qualifications, annual income and current debts that can use for decision making. To make the decisions, the company assigns a credit worthiness level of excellent, good, average, or bad to each of sample set of current customers according to each customer’s payment history. Then company attempts to find the rules that classify its current customers into excellent, good, average, or bad on the basis of information about the person other than actual payment history. |
| 2. Associations- The association information can be used in several ways. When customer buys a particular book, an online shop may suggest associated books. The association rule must have an associated population and the population consists of set of instances. In the case of bookstore, the population may consist of all people who made purchases, regardless of when they made purchase. Each customer is an instance. Here, the analyst has decided that when a purchase is made is not significant, whereas for the grocery store, the analyst may have decided to concentrate on single purchases, ignoring multiple visits by the same customer. Rules have an associated support, as well as an associated confidence. |
| Support is a measure of fraction of the population satisfies both the antecedent and consequent of the rule. For instances, suppose only 0.001 percent of all purchases include milk and screw drivers. The support for the rule milk => screw drivers is low. Confidence is a measure of how often the consequent is true when the antecedent is true. For instances, the rule bread=> milk has a confidence of 80 percent if 80 percent of the purchases that include bread also include milk. A rule with a low confidenceis not meaningful. |
| Another important class of data mining applications is sequence associations. Time series data, such as stock prices on a sequence of days, form an example of sequence data. Stock market analysts want to find associations among stock market price sequences. |
| 3. Clustering- The clustering refers to the problem of finding clusters of points in the given data. The problem of clustering can be formalized from distance metrics in several ways. One way is to phrase it as the problem of grouping points into K sets so that the average distances of points from the centroid of their assigned cluster is minimized. Another way is to group points so that the average distance between every pair points in each cluster is minimized. There are three types of clustering as hierarchical clustering, agglomerative clustering and divisive clustering. |
| Hierarchical clustering is also useful for clustering documents. It can be classified as agglomerative clustering, which start by building small clusters and then create higher levels. Divisive clustering which first create higher levels of the hierarchical clustering then refine each resulting cluster into lower level clusters. |
LITERATURE REVIEW |
| [1]. The system is designed to detect anomalies from distributed data sources. Fast distributed outlier detection strategy is intended for datasets containing mixed attributes. Anomaly detection with high accuracy. Complex straining process. [2].The system is designed to assign class labels and detect anomalies for time series data. Intelligent outlier detection algorithm (IODA) is used to perform outlier detection on time-series data. Class detection latency is reduced. Data values are not performed. [3].The system analyses the performance of different classification techniques for breast cancer patients. Naïve Bayes, the back-propagated neural network, and the C4.5 decision tree algorithms are used for the breast cancer prediction process. Efficient prediction model with minimum time complexity. [4].Optimal models are used to predict the survival rate of breast cancer patients. Neural network and decision tree based algorithms are used to predict breast cancer severity. Accuracy is high. Domain knowledge is required for training process. |
EXISTING SYSTEM |
| Now a day the health care system or the field of medicine has been using more number of technologies. Information technologies in the health care field producing the written records of each patient into electronic document. This information includes patient demographics, records on the treatment progress, prescribed drugs, previous medical history, lab results, details of examination. Health institutions are able to use data mining applications for a variety of areas, such as doctors who use patterns by measuring quality indicators, customer satisfaction and economic indicators from multiple perspectives to optimize use of resources, identifying high-risk patients and optimize health care, cost efficiency and decision making based on evidence.Integration of data mining in healthcare institutions reduce subjectivity in decision-making and provide a new useful health care knowledge. The models of predictive type provide the best knowledge support and experience to the workers of healthcare. Data mining is using a technique of predictive modeling to determine which diseases and conditions are the extending ideas. Then which requires a review of medical documentation of a healthcare institution and prescription drugs to determine which problems are the most common. The problem of prediction in medicine can be divided into two phases: learning phase and the phase of decision making. In the phase of learning, a large data set is transformed into a reduced data set. Number of features and objects in this new set is much smaller than the original set in several different ways. |
| The major problems in data mining in medicine are that the raw medical data is voluminous, and heterogeneous. These data can be gathered from various sources such as from conversations withpatients, review and interpretation of doctors, laboratory results. Eachof these components can have a majorimpact on prognosis, diagnosis and treatment of the patient, and should not be omitted. The scope andcomplexity of medical data is one of the barriers to handle the data mining in a successful way. Missing, incorrect, inconsistent such as pieces of information saved in different formats from different data sources createa major obstacle to develop data mining in a successful manner. It is very difficult for people to process gigabytes of records,although working with images is relatively easy for doctors are being able to recognize patterns, toaccept the basic trends, and formulate rational decisions. |
| The classification used to detect the severity level of diseases by enhancing the boundary classification. The patterns are collected using trained datasets. This can be achieved by using Bayesian classification and decision tree classification. The decision tree classifier is widely used technique for classification. As the name suggests, decision tree classifiers use a tree; each leaf node has an associated class, and each internal node has a predicate with it. To classify the new instances, we start at the root and traverse the tree to reach a leaf; at an internal node we evaluate the predicate on the data instance, to find which child to go to. The process continues till we reach a leaf node. The most common way of doing so is to use a greedy algorithm, which works recursively, starting at the root and building the tree downward. Initially there is only one node, the root, and all training instances are associated with that node. At each node, if all, or almost all training instances associated with the node belong to the same class, then the node becomes a leaf node associated with that class. Otherwise, partitioning attribute and partitioning conditions must be selected to create child nodes. The data associated with each child node is the set of training instances that satisfy the partitioning condition for that child node. |
| The main idea of decision tree construction is to evaluate different attributes and different partitioning conditions, and pick the attribute and partitioning condition that results in the maximum information gain ratio. The same procedure works recursively on each of the sets resulting from the split, thereby recursively constructing a decision tree. Several of the algorithms also prune sub trees of the generated decision tree to reduce over fitting. A sub tree is over fitted if it is has been so highly tuned to specifies of the training data it makes many classification errors on other data. A sub tree is pruned by replacing it with a leaf node. There are different pruning heuristics; one heuristics uses part of the training data to build the tree and another part of the training data to test it. |
| There are several types of classifiers other than decision tree classifiers. Two types that have been quite useful are neural net classifiers and Bayesian classifiers. Neural net classifiers use the training data to train artificial neural nets. Bayesian classifiers find the distribution of attribute values for each class in the training data; when given a new instance d, they use the distribution information to estimate, for each class, the probability that instances d belongs to class. The symptoms of each patient are collect and the similar symptoms of them are classified into pattern. According to collected patterns the severity levels of diseases are detected into two classes such as positive and negatives. These patterns analyzed using three algorithms are GetNuggetScore, FindBoundary and FindCriticalNugget. The GetNuggetscore algorithm used to calculate CRscore value. The FindBoundary algorithms are used to identify class boundary. The FindCriticalNugget algorithm to detect the critical nuggets for two classes. |
PROBLEM DESCRIPITION |
| The main problem of the existing system is that analysis of the severity level of the patients and delay in treatment of disease. Now a days the severity level of disease is analyzed and reported as categories such as positive and negative. If the patient is affected by the disease then the analyzed report is positively shown. If the patient is not affected by disease then the analyzed report is negatively shown. Using these two distinguish the severity level of the patients are not analyzed clearly. Because if the patient is having low level symptoms such as fever and indigestion then those patients are also shown as positive. Then treatment is taken according to the positive condition but does not consider whether the disease is low, medium or high. This causes some problem in giving the medicines. For example, analysis of the severity level of the cancer patients. The symptoms of cancer are fever, fatigue, indigestion, persistent cough, difficulty swallowing, inflammations, bloating, skin changes and unexplained weight loss. Considering out of 200 patients, if 20 patients are having similar symptoms such as fever, fatigue and indigestion then those patients are categorized into one patterns and named as low level symptoms. If 30 patients are having similar symptoms such as persistent cough and difficulty swallowing then those patients are categorized into one patterns and named as medium level symptoms. If 40 patients are having similar symptoms such as unexplained weight loss, skin changes and bloating are categorized into one patterns and named as high level symptoms. According to the analysis of the severity level of the patients there are categorized into three levels such as low, medium and high. If the patients is considered at low level symptoms then treatment is taken according to that and diagnosis it. If 2 patients are having similar symptoms then they are not considered into pattern which causes problem in diagnosis. |
PROPOSED SYSTEM |
| The critical nuggets identification and classification scheme is improved to support multiple classes. The system can be adopted to handle mixed attribute data values. The boundary approximation algorithm is enhanced to reduce the detection complexity. Post processing operations are tuned to identify classes for multiple category data environment. |
| The critical nuggets based classification system is designed to classify multi-class data values. Multi attribute data analysis mechanism is applied to handle all attribute types. Classification is performed with the support of critical nuggets extracted from the learning process. The system is divided into five major modules. They are data pre-process, nuggets identification, class boundary analysis, classification on bi-class data and classification on multi-class data. |
| Data Pre-process |
| Lung cancer data values are collected and analysed in the data pre-process. Noisy data elements are corrected with suitable values. Aggregation based data substitution mechanism is used to assign values for missing elements. Learning and testing data values are partitioned in the preprocess. |
| Nuggets Identification |
| Nugget identification process is performed on the labelled transactions. Criticality score is estimated for the attributes and transactions with class information. Nugget score values are verified with associated class information. Critical nuggets are identified for each class levels. |
 |
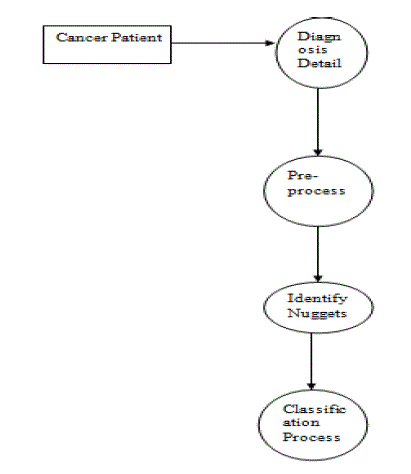
| Fig. No: 6.1. Class Chunk Identification and Categorization |
| Class Boundary Analysis |
| The nuggets and their class boundaries are identified under the class boundary analysis process. Centroid for each class is estimated with the weight value for the nuggets. Similarity analysis mechanism is used to identify the cluster boundaries.Class boundary identification algorithm is used to estimate the cluster ranges. |
| Classification On Bi-class Data |
| The nugget based classification algorithm is designed to detect two class levels only. The systems select nuggets for two class levels from the labelled transactions. The unlabelled transactions are compared with the nuggets associated with the classes. Similarity analysis is performed between the nuggets and unlabelled transactions for the class assignment process. |
| Classification On Multi-class Data |
| The nugget based classification scheme is tunes to detect multiple class labels. Class boundary identification is also enhanced to support multiclass environment. Multi attribute based classification is performed on the binary, categorical and continuous attributes. Nugget similarity analysis is applied for each class levels. |
PERFORMANCE EVALUATION |
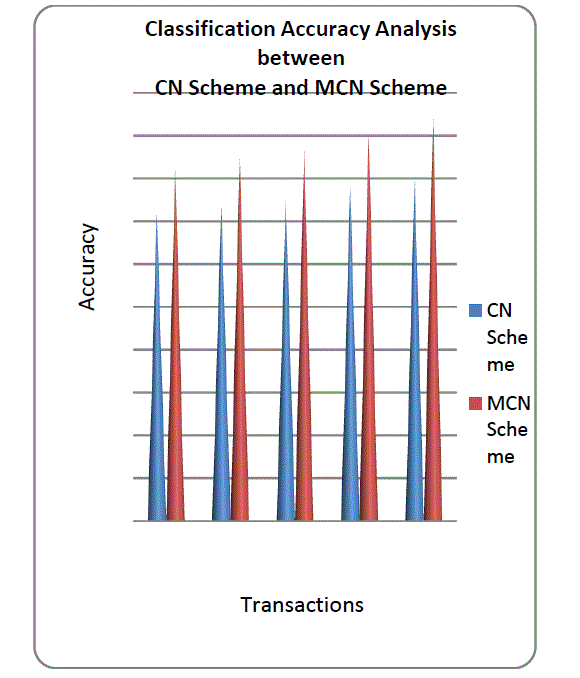
| The performance evaluation of proposed system can be compared with the Critical nuggets scheme (CN scheme) and Multi attribute based Critical Nuggets Scheme (MCN scheme). The CN scheme explains the accuracy levels of the nugget based classification algorithm is designed to detect two class levels only. The systems select nuggets for two class levels from the labelled transactions. The unlabelled transactions are compared with the nuggets associated with the classes. The MCN scheme explains the accuracy levels of the nugget based classification scheme is tunes to detect multiple class labels. Class boundary identification is also enhanced to support multiclass environment. Multi attribute based classification is performed on the binary, categorical and continuous attributes. The fig7.1 explains Classification Accuracy Analysis between CN Scheme and MCN Scheme. According them MCN scheme classification provides the high level of accuracy. |
 |
| Fig. No: 7.1 Classification Accuracy Analysis betweenCN Scheme and MCN Scheme |
CONCLUSION |
| Classification techniques are used to identify the transaction label. Critical nuggets are used to represent the domain knowledge of the data collection. Classification accuracy is improved with critical nuggets and class boundary algorithm. The system is enhanced to support multiple class and multi attribute environment. False positive and false negative errors are reduced in the classification process. Classification accuracy is improved by the nuggets based classification scheme. The system reduces the Computational complexity. The system supports mixed attribute data for classification process. |
References |
|