The power quality, mainly voltage sag performance and power factor of a distribution system have been evaluated. The analysis of voltage sag uses the Monte-Carlo procedure implemented in the Electrical Transient Analysis Program (ETAP) to construct the sag density table and to estimate the probable number of critical voltage sags per annum at a given node. These calculations have taken into account the entire system comprising the transmission, sub transmission and distribution subsystems. Also, the various improvement methods for sag performance have been suggested. To improve power factor, a scheme for automation of power factor correction using Programmable Logic Controller (PLC) based on actual installations has been developed. For automation, Boolean logic circuit has been developed and ladder diagram has been drawn. From the ladder diagram, program for the PLC has been written.
Keywords |
| Power factor correction, voltage sag, power quality, PLC |
INTRODUCTION |
| Energy crisis is a serious issue bothering our future. The main reason behind this problem is that generation cannot
meet the ever increasing demand. Also the quality of power being transmitted is diminishing. Power Quality means to
maintain purely sinusoidal current wave form in phase with a purely sinusoidal voltage wave form. |
| In modern scenario, the power quality of the ac system has become a great concern due to the increased numbers of
electronic equipment, power electronics, computer control and high voltage power system. The importance of electrical
supply has reached a state where protection of power system is inevitable and maximum continuity of supply is ensured.
The work has been done in a petrochemical industry where there are two sources of electricity. One is from the state
power grid feeder line and the other from the Captive Power Plant (CPP) within the company. The industry is a leading
producer of fertilizers and chemicals in the country, so the proper working of the plants is crucial. Major economic losses
result when such critical loads are subjected to frequent shutdowns and restarts due to failure of power supply. So the
power required for the operation of these plants is provided by the CPP in the company whereas the non-critical loads are
supplied from the state power grid. Thus consistency of supply to the critical loads is achieved. |
| All the plants in the industry make use of highly advanced technology, critical operation and highly critical
equipment. These plants are facing power quality issues such as voltage sag, harmonics, frequency variation, low power
factor etc. and the power cost is very high. |
| Power factor is the cosine of the angle between the voltage and current in an ac circuit. For fixed power and voltage,
the load current is inversely proportional to the power factor. Lower the power factor, higher is the load current and
vice versa. |
| Entire operation of existing system in the industry is manual and it requires frequent supervision. It is necessary to
automate the power factor correction in the industry. In this paper, PLC has been used to maintain power factor within
range of 0.93-0.99. As this industry is already equipped with significant number of capacitor banks, the best economic
way to automate power factor correction here is to implement PLC instead of other automatic power factor correction
devices. |
| The design and development of a three-phase power factor corrector using Programmable Interface Circuit (PIC)
micro-controlling chip have been discussed in [1]. In [2], the implementation of a Power Factor Controller (PFC) for a
3-phase Induction Motor utilizing PLC has been explained. Alternative cost-effective applications of power factor
correction have been discussed in [3] |
| Voltage sag is a decrease in rms voltage from 0.1pu to 0.9pu at the power frequency for durations from half a cycle
to a few seconds, reported as the remaining voltage. The amplitude of a voltage dip is defined as the difference between
the voltage during the voltage dip and the nominal voltage of the system expressed as a percentage of the nominal
voltage. |
| Voltage sags are mainly caused by faults in the power system and, occasionally, by the energization of large
induction motors. As industrial loads are extensively implemented with computer control, loads are becoming very
sensitive to voltage sags. A sensitive load should be protected against voltage sags. It is disconnected when the sag
magnitude and duration exceed specified limits. Also, the financial losses due to interruptions caused by voltage sags
could be substantial. |
| Accurate estimates of sag magnitude and duration probabilities can help the system designers to select suitable
specifications of equipment for critical processes and evaluate alternate strategies and prevent complications and
danger. |
| The voltage sag performance of a distribution system has been studied in [4]. A Monte-Carlo procedure has been
used to create the sag density table and evaluate the number of unacceptable sags per annum at a sensitive load bus. |
| The Monte-Carlo method along with the method of fault positions can be used to assess the voltage sags. This
technique has been applied in [5] to evaluate the probability distribution of sag magnitudes at any bus in the IEEE
Reliability Test system. |
| The voltage sag performance of a theoretical distribution system has been evaluated in [6]. The Monte-Carlo
procedure implemented in a powerful time-domain simulation program named Alternative Transients Program (ATP)
is used in the study. Precise and complete modeling of the system is made possible by the ATP. The Information
Technology Industry Council (ITIC) curve has been used to get the degree of unacceptable sags for 1000 faults. One of
the key conclusions in this study is that proper coordination of the protective devices could reduce the number of
intolerable sags. The method of critical distances has been applied to radial systems, and the sag density table has been
constructed in [7]. |
| The effects of uncertainty in the sensitivity characteristic of equipment have been assessed and this has been detailed
in [8]. A method for stochastic prediction of voltage sags caused by faults in a large power system has been presented
in [9]. An effective method to determine the area of vulnerability in a large meshed network has been described. |
| The voltage sag performance of distribution system in the petrochemical industry has been analysed. This analysis
uses the Monte-Carlo procedure implemented in the Electrical Transient Analysis Program (ETAP), which is a
powerful time-domain simulation program. Accurate and complete modeling of the system has been done by the ETAP.
The Information Technology Industry Council (ITIC) curve has been used to count the number of critical sags per
annum in a run of 100 faults. A Monte-Carlo procedure has been used to estimate the possible number of unacceptable
voltage sags per annum at a given node. Also, the various improvement methods for sag performance have been
suggested. |
| Thus, the main objectives that have been focused in this paper are to eliminate these power quality problems,
improvement of plant efficiency and cost effective utilization of electric power. |
DESCRIPTION OF THE SYSTEM |
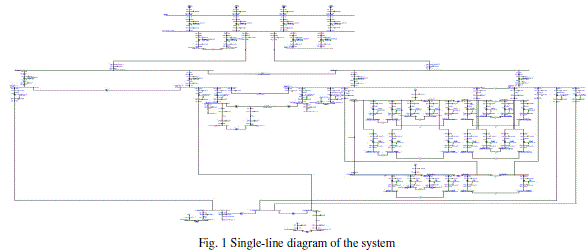
| Fig. 1 shows the single line diagram of a 93-bus system comprising of state power grid and the petrochemical
industry that has been studied. The major components of the system include transmission lines, sub transmission lines,
distribution lines, substations, and switchyards. The present system comprises a 1-bus 220kV transmission system, a 7-
bus 110kV sub transmission system, a 3-bus 66kV sub transmission system, a 44-bus 11kV distribution system, a 22-
bus 3.3kV distribution system and a 16-bus 0.415kV distribution system. The details of the system, such as grid details,
line impedances, transformer connections and impedances, CT ratios, primary and backup protective relay
characteristics, substation equipment details etc. have been collected from the industry for research purpose. |
 |
AUTOMATION OF POWER FACTOR CORRECTION |
| A. Present System in the Industry |
| Due to heavy inductive loads, the power factor of the system falls to a very low value. The power factor of the entire
company without using any power factor control equipment is found to be 0.75. State power grid had set a minimum
cut off for the power factor and is 0.9. The existing system achieves this by using manual operation of six capacitor
banks that have been installed and important drawback of the present power system in the industry is that it requires
frequent supervision. The power factor of the system is read periodically and the capacitor banks are switched on and
off as per the requirements. It is necessary to automate the power factor correction in the industry. |
| B. Limitations of the Existing System |
| In the present system, a staff member must examine power factor variation periodically (one hour) and switch on and
off the capacitor banks as per the requirement. The effect is that the efficiency of the system is low. |
| C. Power Factor Control by PLC |
| In this paper, to control the power factor of the existing system, Programmable Logic Controller has been used. The
reactive power of the system is read from the incoming feeder by means of a transducer. The transducer used for this
purpose is 4700 Power Meter developed by SIEMENS. 4700 Power Meter is capable of reading the power factor, kWh,
kVARh, voltage and current from the system bus. The reactive power read is then fed to PLC. This input to the PLC is
analog in nature. But normally PLC’s are digital devices i.e. they take digital inputs and their outputs are also digital in
nature. But here, the input is analog in nature and is to be compared with a preset value. The PLC used must have
analog input and analog control. For that reason, PLCs of series CQM1 developed by OMRON has been used. These
are capable of taking analog inputs and processing them to produce the required analog or digital output. This involves
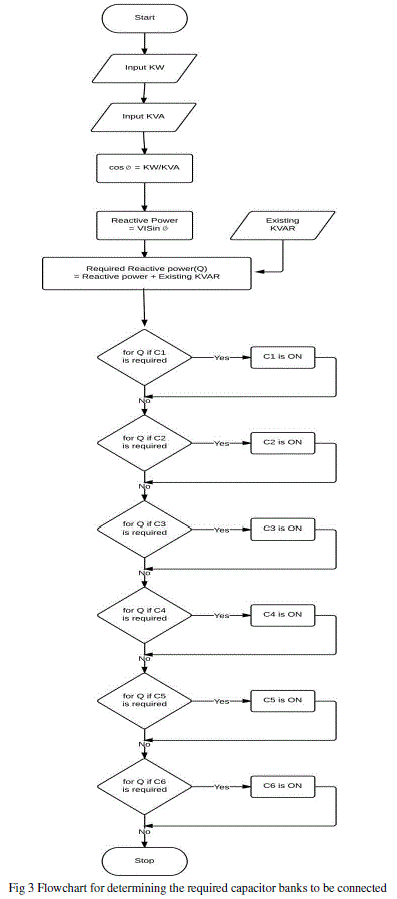
sensing and measuring the power factor value from the load using PLC. Proper algorithm has been used to determine
and trigger sufficient switching capacitors in order to compensate excessive reactive components. |
| D. Proposed System with PLC |
| This paper proposes a PLC based on actual installations in service for up to sixty years to maintain power factor
within range of 0.93-0.99. A compelling reason for power factor correction is the penalty clause in the electric power
bill. So the industry may get incentives from state power grid at 0.25% for every 0.01 increase from 0.9 in power factor. |
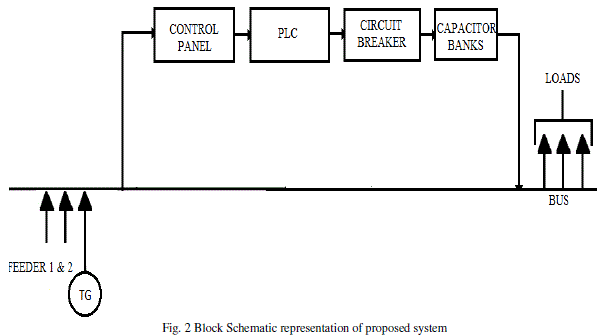 |
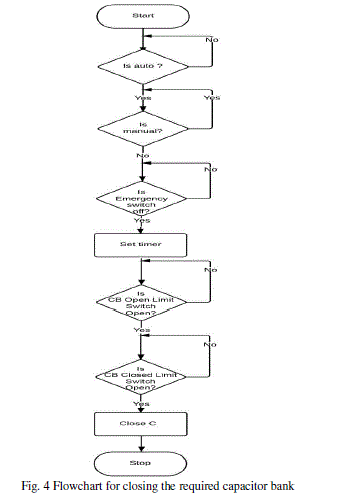
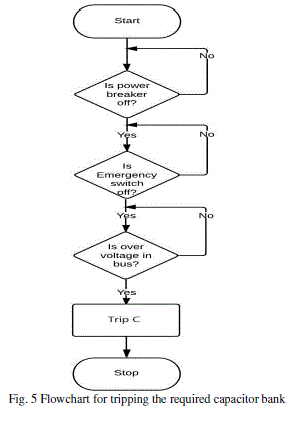
| The circuit for closing and tripping the capacitors have been developed using Boolean logic circuit and ladder
diagram was drawn. From the ladder diagram, program for the PLC has been written. By implementing this system, the
power factor has been improved from 0.75 to 0.99 approximately. As a result, higher efficiency and better quality ac
output have been acquired. |
 |
 |
 |
ESTIMATION OF VOLTAGE SAG |
| A. Sag Density Table |
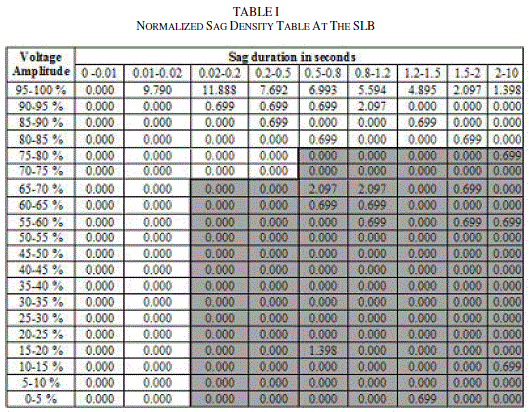
| The sag density table is effective for a particular location in the system where a prospective load is possible to be
connected. This location is the sensitive load bus (SLB). In the sag density table, the residual rms voltage during faults
is divided into several ranges, and they constitute rows of the table. The columns of the table can be formed by dividing
the sag duration into several ranges. Thus, a cell in the table corresponds to certain ranges of residual voltage and sag
duration during faults. The number of sags per annum at the SLB that have residual voltage magnitude and duration
within suitable ranges is entered in a cell. |
| The residual voltage during a fault is denoted as the magnitude of voltage sag, and it depends on the topology of the
system and line impedances, winding connections of transformer and their impedances, and the fault location and fault
impedance. The protection system is responsible for the duration of voltage sag |
| B. Voltage Acceptability Curve |
| A voltage acceptability curve is the locus of the sag magnitude as a function of sag duration. Fig. 6 shows the curve
suggested by the Information Technology Industry Council. Therefore, it is referred to as ITIC voltage acceptability
curve. |
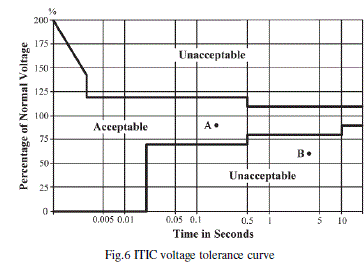 |
| The acceptable and unacceptable regions are shown in fig. 6. In this work, only the sag magnitudes and durations
have been considered for analysing the sag performance of the distribution system. The voltage acceptability curve
indicates the ability of a load to withstand momentary low-voltage events. The curve quantifies the acceptability of the
distribution system’s power as a function of the voltage sag magnitude and the duration of us voltage fluctuations. The
ITIC curve has been used as the acceptability criterion in this study. |
| C. Selection of Type and Location of Fault for Voltage Sag Analysis in the Industry |
| In this study, loads are not taken into account. The statistics of system fault were collected over a period of 5 years
and is presented below. |
 |
| D. Calculation of magnitude and duration of voltage sag |
| This analysis uses the Monte-Carlo procedure implemented in the Electrical Transient Analysis Program (ETAP),
which is a powerful time-domain simulation program, to estimate the possible number of critical voltage sags per
annum at a given node. Accurate and complete modeling of the system has been done using ETAP. The subsystem,
type and location of the fault have been chosen in random. Then, short-circuit calculations are carried out to determine
the fault currents and the voltage at the SLB during the fault. Magnitude and duration of voltage sag have been
obtained from the transient stability analysis in ETAP. The response of the protection system has been found to be the
responsible for duration of the voltage sag at the SLB. The ITIC voltage tolerance curve has been used to count the
number of unacceptable sags for 100 faults randomly applied in the system. Some faults result in the interruption of the
sensitive load, and these are avoided. For a certain number of the randomly applied faults, the sensitive load will be
subjected to voltage sags and these events are counted in the analysis. |
| E. Construction of sag density table and number of critical sags per annum |
| To estimate the number of critical sags for faults randomly applied in the system, the faults are distributed among
the cells of the sag density table. |
| In the analysis, 1 fault event has resulted in the interruption of the sensitive load and rest 99 events have resulted in
voltage sags and have been distributed in the cells. As per the data collected, there are 69 sag events per annum in the
system. Therefore 99 sag events correspond to 1.43 years of data. The normalized sag density table shown in Table Iis
obtained by dividing each cell entry by the number of years, as shown in table 1. It is convenient to superpose the ITIC
curve on the sag density table. The sum of the values in the cells of the table below the ITIC curve is the total number
of unacceptable or critical sags per annum at the SLB. By summing the cell values in the unacceptable region of ITIC
curve, the number of critical sags is obtained as 11.883 per annum. As this value is high, it can be a serious concern for
the industry. |
 |
| F. Improvement of Voltage Sag Performance |
| Different methods for improvement of the sag performance of the distribution system are: |
| (I) Proper coordination of the protective relays |
| (II) Washing the insulators of selected 110kV sub transmission lines |
| (III) Applying surge protective devices in selected 11kV feeders |
CONCLUSION |
| In order to estimate the sag performance, power systems of the industry and 220kV state power grid have been
modeled using ETAP. The construction of the sag density table for a distribution system has been described. A Monte-
Carlo procedure that randomly applies faults in the system has been used in the construction. Short-circuit calculations
are carried out to determine the fault currents and the voltage at the SLB during the fault. The magnitude and duration
of the voltage sag have been obtained from the transient stability analysis in ETAP and no: of unacceptable sags per
annum has been found out using ITIC curve as the voltage acceptability criterion. Various improvement methods for
voltage sag performance have been suggested. For power factor correction, in order to obtain reactive power
compensation, an effective algorithm for switching sufficient capacitor banks has been developed. Then circuits for
closing and tripping the capacitors were drawn. Boolean logic circuit has been developed and ladder diagrams were
drawn. From the ladder diagram, program for the PLC has been written. Finally, the scheme for switching on and off of
capacitor banks for power factor correction has been designed and power factor has been maintained near unity. The
work can be extended to reduce the effect of harmonics in the distribution system using appropriate designing of
harmonic filters. |
ACKNOWLEDGMENT |
| The satisfaction and euphoria that accompany the successful completion of a task would be incomplete without the
mention of the people who made it possible, whose constant guidance and encouragement crowned my effort with
success.I thank the Almighty for bestowing his blessings and grace which enabled me for the successful completion of
this seminar.I am deeply indebted to my project guide Er. V. A Shajan, Manager Maintenance (Electrical), Fertilizers
and Chemicals Travancore Ltd,for his valuable advice and guidance. I would like to express my sincere thanks to all
the members of faculty of EEE department for their co-operation.Last but not the least, I am greatly acknowledged by
understanding and co-operation prevailed in me throughout the course of the thesis that helped for its successful
completion. |
References |
- Nader Barsoum, âÃâ¬ÃÅProgramming of PIC micro-controller for power factor correctionâÃâ¬ÃÂ, IEEE Conf. in Modelling and Simulation, pp. 19-25, 2007
- A. R. AL-Ali, M. Kassas, and M. M. Negm, âÃâ¬ÃÅA PLC based power factor controller for a 3-phase induction motorâÃâ¬ÃÂ, IEEE Conf. Ind. Appl., pp. 1065-1071, 2000
- Richard A. Fuselier, âÃâ¬ÃÅAlternative Cost-Effective Applications of Power Factor CorrectionâÃâ¬Ã IEEE Trans. Ind. Appl., vol. 25, no. 1, pp.10-18, January/February 1989.
- Edson G. da Costa, Gilvan V. de Andrade, Jr., and S. R. Naidu, âÃâ¬ÃÅVoltage Sag Performance of a Distribution System and Its ImprovementâÃâ¬Ã IEEE transactions on industry applications, vol. 48, no. 1, pp. 218-224, January/February 2012
- R. Billinton, S. Aboreshaid, and S. O. Faried, âÃâ¬ÃÅStochastic evaluation of voltage sag and unbalance in transmission systems,âÃâ¬Ã IEEE Trans. Power Del., vol. 20, no. 4, pp. 2631âÃâ¬Ãâ2637, Oct. 2006.
- J. A. Martinez and J. Martin-Arnedo, âÃâ¬ÃÅVoltage sag studies in distribution networksâÃâ¬ÃâPart II: Voltage sag assessment,âÃâ¬Ã IEEE Trans. Power Del., vol. 21, no. 3, pp. 1679âÃâ¬Ãâ1688, Jul. 2006.
- J.Wang, S. Chen, and T. T. Lie, âÃâ¬ÃÅSystem voltage sag performance estimation,âÃâ¬Ã IEEE Trans. Power Del., vol. 20, no. 2, pp. 1738âÃâ¬Ãâ1747, Apr. 2005
- C. P. Gupta and J. V. Milanovic, âÃâ¬ÃÅProbabilistic assessment of equipment trips due to voltage sags,âÃâ¬Ã IEEE Trans. Power Del., vol. 21, no. 2, pp. 711âÃâ¬Ãâ718, Apr. 2006
- C.-H. Park and G. Jang, âÃâ¬ÃÅStochastic estimation of voltage sags in a large meshed networks,âÃâ¬Ã IEEE Trans. Power Del., vol. 22, no. 3, pp. 1655âÃâ¬Ãâ1664, Jul. 2007.
|