Keywords
|
| Differential Pressure, Fluctuation, Blockage, Impulse Line. |
I.INTRODUCTION
|
| Due to its simplicity, the combination of orifice plate and differential transmitter is widely used for flow measurement in process industries. Figure 1 shows a typical example of an installation for liquid measurement. For ease of maintenance, the transmitter is generally set up near the ground using long impulse lines. |
| But process connection using impulse line are easily blocked by accumulations of impurities from the fluid or by congelation of the measured fluid due to problems with heat tracing which is necessary when measuring high-meltingpoint fluid. If process connections become blocked, the DP transmitter won’t measure actual process pressure accurately, so will output an inaccurate pressure values to the controller. |
| A study of the detection of blockages in process connection using fluctuating component of differential pressure computed by FFT has been reported. This time we studied the simple and practical method that can even detect which connection – high (upstream) side or low (downstream) side or both – is/are blocked, by maximum/minimum signal analysis using the fluctuating component but also high pressure. |
II.LITRATURE REVIEW
|
| Differential pressure transmitter with orifice plate has achieved great success in flow measurement. However, blockage in impulse line attached to transmitter is sometime caused by precipitating or solidifying liquids. In 1994 Amadi- Echendu, Zhu anf higham publish paper on “Signal Analysis to detect blockage in pressure and differential pressure measurement system” this paper deals with the analysis of noise signal in conventional output signals from pressure and differential measurement system to detect blockage in process connection . This paper initial emphasis on the integrity of the measurement system, this means that in addition to the measured signal, measurement system should provide an indication of its operational status as the main task in this paper elaborate is to extract information from the measurement signal and present it in concise format for change detection. |
| In 1995 Taya and Kuwayama publish paper on “ Detecting the blockage in process connections of Differential pressure transmitter” this paper talk about the study of detection of blockage in process connection using fluctuating component of differential pressure computed by FFT. This paper talked about the upstream and downstream or both –is/are blocked by maximum/minimum signal analysis using the fluctuating component of not only differential pressure but also static pressure. |
II. BLOCKAGE TYPES
|
| There are four types of blockage state. Diagnose for impulse line blockage is based on decrease in the fluctuation of high side or low side pressure. However fluctuation of is much affected by flow rate furthermore the change of differential pressure fluctuation is complicated. Fluctuation of differential pressure does not necessary decrease when one side blockage occurs because one side blockage makes its fluctuation in large most cases. It is difficult to tell whether the blockage occurs when flow rate changes then we developed a maximum/minimum analysis method for one side blockage in impulse line. |
III.EXPERIMENTAL SETUP
|
| The experimental set up shown in Fig.4 the major fluid was water. Process line size was 4 inches in diameter. Orifice type was concentric tap. Vibrations of impulse line are detected by using accelerometer sensor Bruel & Kjær which operates in the range of -54Ãâ¹ÃÅ¡C to + 121Ãâ¹ÃÅ¡C at resonant frequency 18 KHz with sensitivity of 100 mV/g. Vibration analyzer is having five channels so at a time five sensors can be configured to analyzer. Pulse Labshop software is used to monitor vibration. There are four windows configuration, measurement, function and Display. |
| Configuration window contains details of the inputs and outputs on the Pulse Front-end and to specify what instruments are connected to this Front-end. Measurement window is used to setup signal grouping and to specify which analysers are to be used. Function window is used to setup the outputs from the analysers and how they are to be used. Display window show which measurements are currently displayed and allows modifications to be made to the way the measurements are displayed. |
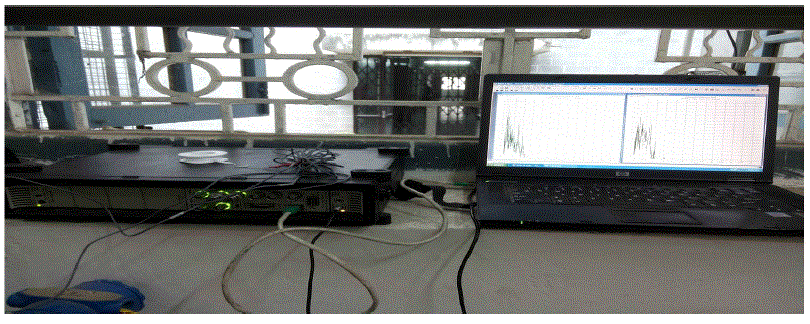
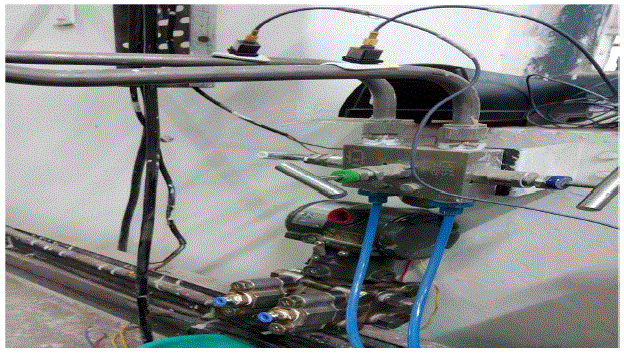
| Figure 2 show the actual experimental set up for vibration analyzer with display PC. Ethernet is used for communication. Figure 3 actual installation of accelerometer sensor by using three needle valves we are creating blockage at upstream and downstream for diagnosis purpose. Accelerometer sensor is externally mounted on impulse line for detection of vibrations due to blockages. |
IV. FLUCTUATING COMPONENT & ALGORITHM FOR ONE SIDE BLOCKAGE
|
| The fluctuating component of vibration signal should decrease with build up of deposits (blockage), because flow resistance increases as effective diameter of process connection decreases, and as result the response to vibration change is smaller if the process connection is completely blocked, the fluctuating component vanishes altogether. By operating needle valves, we stimulated three types of blockages: 1.Complete blockage of connection (called “bothside- blockages”) by closing both upstream and downstream needle valve, 2. Blockages of only upstream connection (called “H- side blockage”) by closing the upstream needle valve, 3. Blockages of only downstream connection (called “L-side blockage”) by closing the downstream needle valve. Blockage Factor is calculated depending upon fluctuating signals generated on impulse line. Four types of signals are needed to calculate blockage factor. Value of Blockage Factor ‘F’ indicates Blockage location and F varies from -1 to +1. Table 1.Shows Fluctuations are collected by manually creating impulse line blockage. |
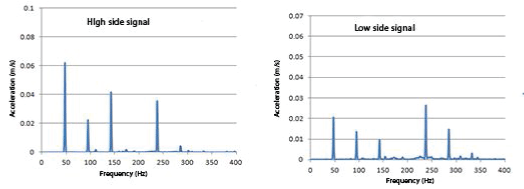
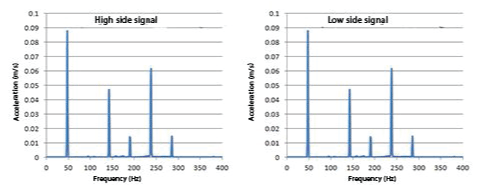
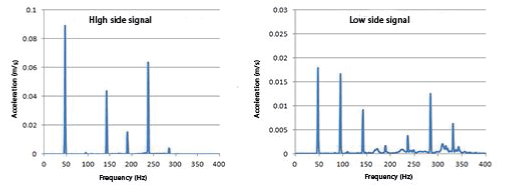
| The experimentally measured values of high side vibration and low side vibration signal are shown in Fig. 4. This shows that the fluctuations of HP, LP and DP (calculated by subtracting LP from HP) are different under each blockage status. Three kinds of fluctuation are needed in order to calculate Blockage Factor which can indicate low side and high side blockage. Three kinds of R.M.S of fluctuation DP, LP & HP are defined in equation (3), (4) & (5). These fluctuations are calculated by secondary differential fluctuation. |
 |
 |
 |
 |
 |
| Where N = total sampling number |
| In case of low side blockage, It is expected that fluctuation of DP is similar to fluctuation Of High side vibration because FLP(i) is nearly zero. Therefore, Correlation between two vibrations is useful for evaluating one side blocking states. To calculate Blockage Factor two kind of correlation must be defined as in following equation. |
 |
 |
 |
 |
| Where |
| CorL: correlation coefficient between Fdp and FLP |
| CorH: correlation coefficient between Fdp and FHP |
| Making an intermediate valuable Z which combines two correlation coefficients and converting Z into Blockage Factor F, F can be normalized ranging from -1 to +1. Typical set of values of different terms is shown in following Table 2. |
V. RESULTS OF EXPERIMENT OF ONE SIDE BLOCKAGE
|
| There is a strong correlation between fluctuation of different pressure and low side vibration in case of high side blockage. This result implies that Blockage Factor F detects one side blockage. The value F varies from -1 to +1 as we expected in Table 3. In case of both side blockage, F take an uncertain value. Even if there is both side blockage, high side blockage and low side blockage are not completely the same. |
VI.CONCLUSION
|
| The diagnosis based on Blockage Factor is superior to convention method of diagnosis which compares RMS of fluctuation in normal condition with that in blockage. Blockage Factor F is little affected by flow rate. One side blocking state is simply classified because F value range is normalized form -1 to +1 according to blockage at low side vibration and high side vibration respectively. |
ACKNOWLEDGMENT
|
| We express my sincere thanks to my mentor, Mrs. Meera A. Khandekar for her expert guidance, encouragement and motivation during the development of this work, without which this work would not have developed to its present form. We are thankful to Dr. S. L. Patil for his support and help. Last but not the least; we are grateful for the endurance from my family and friends who silently supported me. |
| |
Tables at a glance
|
|
|
| |
Figures at a glance
|
 |
 |
 |
 |
| Figure 1 |
Figure 2 |
Figure 3 |
Figure 4a |
 |
 |
 |
| Figure 4b |
Figure 4c |
Figure 4c |
|
| |
References
|
- Eiji Taya, Hideki Kuwayama,” Detecting Blockage in Process Connections of Differential Pressure Transmitters”, Proceedings of the 34th SICEAnnual Conference International Session Papers, pp. 1605-1608, sapporo, July 26-28, 1995.
- Mr. Yoshitaka Yuki, Dr Kenichi Kuromori, Mr. Nobuo Miyaji, Dr. Takumi Hashizume, Mr. Jyun-ichi Eino, Dr, Tetsuya Wakui,” Impulse LineBlocking Diagnosis of Digital differential pressure transmitter” , International Joint Conference Oct 18-21, 2006 in Bexco, Busan, Korea.
- J. E. Amadi-Echendu , Hengjun Zhu and E. H. Higham,'' Signal Analysis Applied to Detect Blockages in Pressure: and Differential PressureMeasurement Systems ", 1994 IEEE Instrumentation and Measurement Technology Conference. Conference Proceedings, Vol. 2, pp. 741-744, May10-12, 1994.
- N. MIYAJI, K. SONODA, H. AKAHORI, "Impulse Line Blocking Diagnosis of Differential Pressure Transmitters", Yokogawa TechnicalReport, Vol.48, No.1, (2004), pp.33-36, (in Japanese).
|