ISSN ONLINE(2319-8753)PRINT(2347-6710)
ISSN ONLINE(2319-8753)PRINT(2347-6710)
Abhinav Sharma1, Jyoti Lalotra2, Saleem khan3, Parveen Lehana4
|
| Related article at Pubmed, Scholar Google |
Visit for more related articles at International Journal of Innovative Research in Science, Engineering and Technology
The research work is carried out to study and analyze the effect of impedance with varying inductance on the power factor of designed system. Eight different combination of load are taken inductance ranging from approximate value of 1232.0mH to 269.1mH keeping resistance 124 Ω and capacitance 15μF. Load voltage and current waveforms were recorded for all combinations by using Gold wave software having duration of 1s with sampling rate of 16,000. From the investigations it is observed that the amplitude of the current in the load is inversely proportional to the inductance and also the power factor is inversely proportional to it.
Keywords |
| Power factor, impedance, active power, load effect, power system. |
INTRODUCTION |
| Power factor may be defined as the ratio of „real or active powerâÃâ¬ÃŸ used in the circuit measured in watts or kilowatt to the „total or apparent powerâÃâ¬ÃŸ measured in volt-amperes or kilo volt-amperes. There is generally a phase difference between voltage and current waveform is called the power factor [1-3]. Power factors above 95% are considered good and power factor below 90% are considered poor [4]. It is a measure of how effectively the current is being converted into useful work output and a good indicator of the effect of the load current on the efficiency of the supply system [5]. Low power factor increases the apparent current from the source; the amount of useful power that can be drawn from the circuit is lowered due to thermal limitation. Low PF also increases not only the apparent line current but also the additional current capacity cost money [6]. Below are other disadvantages of low power factor [6-8]: |
| ïÃâ÷ KVA rating of the electrical equipments increases due to low power factor as power factor is inversely proportional to the KVA rating of the equipment. This increases the size and cost of the equipment. |
| ïÃâ÷ Conductor size increases due to transmit the same amount of power at low power factor at constant voltage needs to carry high current. So to keep the current density constant conductor area increases. |
| ïÃâ÷ Copper loss of the equipment increases. |
| ïÃâ÷ Voltage regulation becomes poor because the Current at low lagging power factor causes greater voltage drop in alternators, transformers and transmission lines causing to have low power supply at the receiving end. |
| ïÃâ÷ Handling capacity of the equipment decreases because the reactive component of current prevents the full utilization of the installed capacity. |
| The research work is carried out to investigate the effect of impedance i.e. change in the inductance keeping capacitance and resistance constant on the designed power system. Signal processing technique is used to evaluate the effect of the impedance and calculation of power factor. |
II. CONDITIONS OF POWER FACTOR |
| There are the different conditions of the power factor in different circuits [9-11]. |
A. Unity power factor |
| A circuit with a unit power factor will have equal actual and apparent power, so that the current remains in phase with the voltage and hence some useful work done. The vector diagram of unity power factor is shown in Fig.1 (a). |
B. Leading power factor |
| circuit will have leading power factor if the current leads voltage by an angle of ïÃÂæ electrical and the true power will be less than apparent power. The vector diagram of leading power factor is shown in Fig.1 (b). |
 |
C. Lagging power factor |
| A circuit the true power is also less than the apparent power and the current lag behind the voltage by an angle of ïÃÂæ electrical. The vector diagram of lagging power factor is shown in Fig.1(c). |
D. Zero power factor |
| When there is a phase difference of 900 between the current and voltage, the circuit will have zero power factor and no useful work can be done. The vector diagram of zero power factor as shown in Fig.1 (d). |
METHODOLOGY |
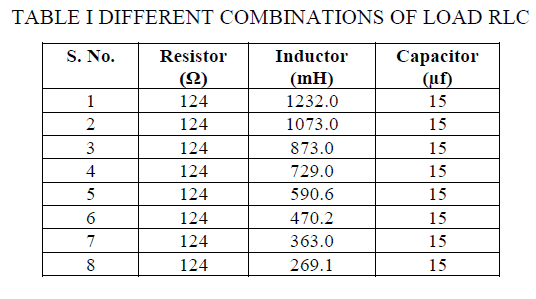
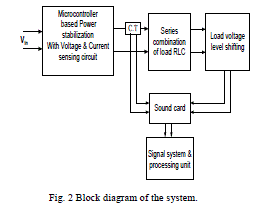
| porposed research work can be explained in this form of block diagram is shown in Fig. 2. It shows five blocks: Microcontroller based power stabilization with voltage and current sensing circuit, variable loads section, load voltage & current measurement, sound card, and signal storage and processing unit. Input is applied to the system and its voltage and current are mearsured using the first block. The elevation or drop in the input voltage caused by the fluctions are stablized by the stablization block consists of microntroller and driver circuitry. The controller used in the circuit is PIC16F72 and the volatge stabliztion is done using MOSFET IC P90NF03L with other peripehal devices. The output from the stablization block is applied to the load. Load consists of series combinations of resistor, capacitor and inductor. Different combinations of impedance are taken shown in Table 1. |
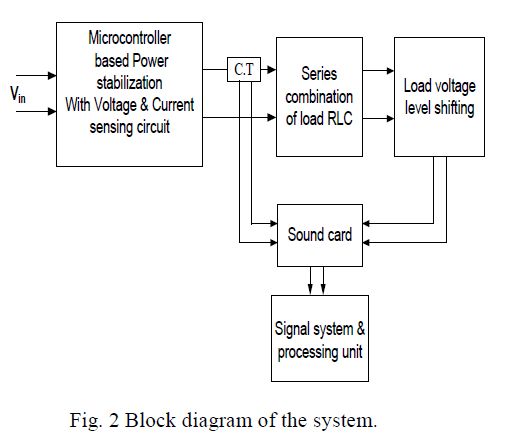 |
| Load current and voltage for different combinations is measured using current transformer (CT) and load voltage level shifting block. Further these signals are stored and processed in PC through sound card. Since the value of output load voltage is in tens of volts, thus cannot be directly applied to the sound card, a circuit is developed to bring down the amplitude of the out voltage from volts to milli volt. These signals are recorded in the PC using Gold wave software. The sampling rate and duration of measurement are kept at value of 16000 and 1s respectively. If the inductor are varying then loads obtained the output pulses of pure sinusoidal sine wave are display in computer through sound card and calculate the load phase angle, ïÃÂæL between the fundamental components of the load voltage and current (V and IL respectively.) |
 |
IV. RESULT AND DISCUSSION |
| The experiment is carried out to investigate the effect of power factor due to loading has been evaluated and analysed. Calculations of the power factor are carried out using signal system and processing unit. Various combinations of load i.e. capacitive, inductive and resistive are shown in Table 1 and their total impedance is calculated using following formula [12-15]: |
 |
 |
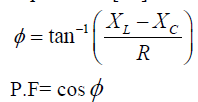
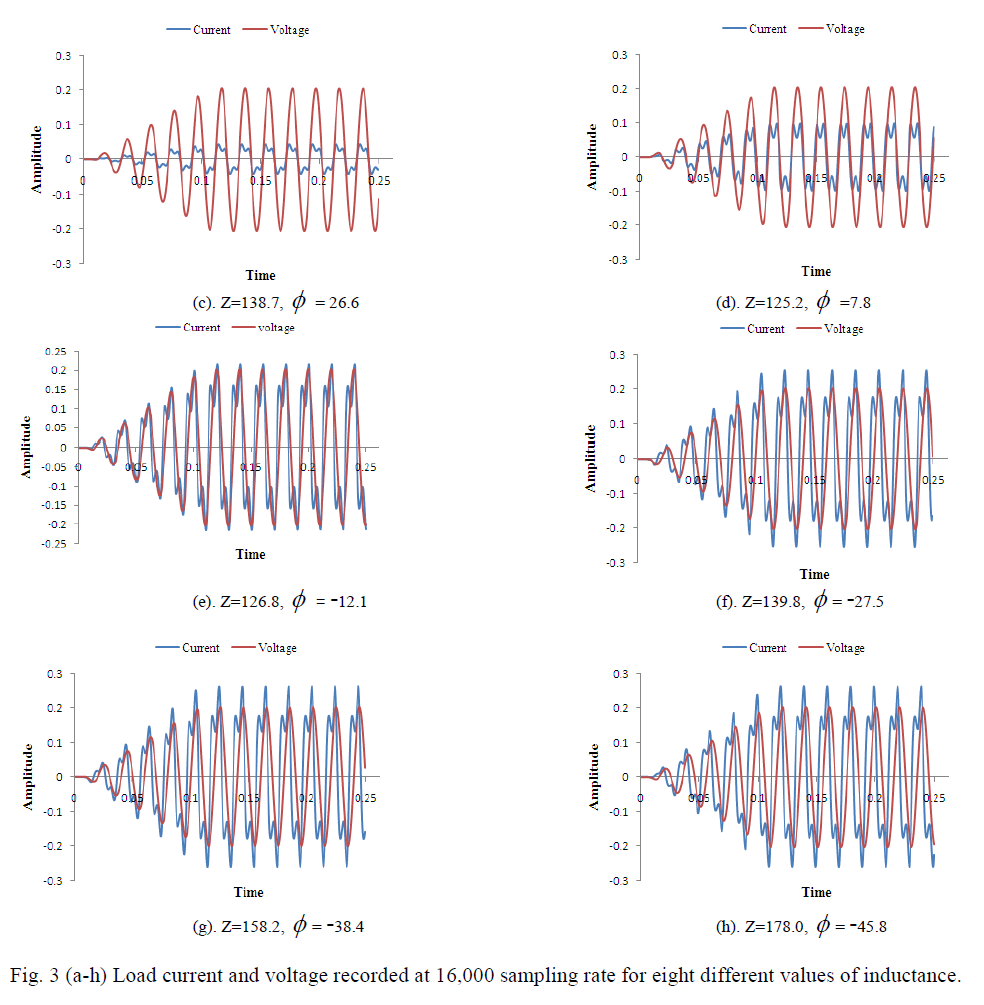
| Load voltage and current through it are segmented for 0.25s for eight combinations of impedance are shown in Fig. 3(a) to Fig. 3(h). From these plots it can be analysed that inductance shows a prominent effect on the amplitude of the current but as far as voltage is concerned its amplitude remains constant for all the combinations of the load. Current amplitude is inversely proportional to the magnitude of the inductor. Theoretical values of the power factor were calculated using following formula given below with all the values of the inductor, capacitor and resistor taken in the experiment [16]: |
 |
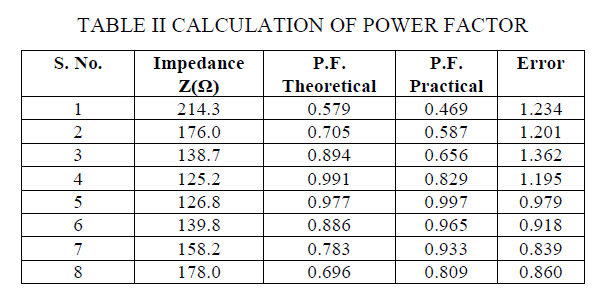
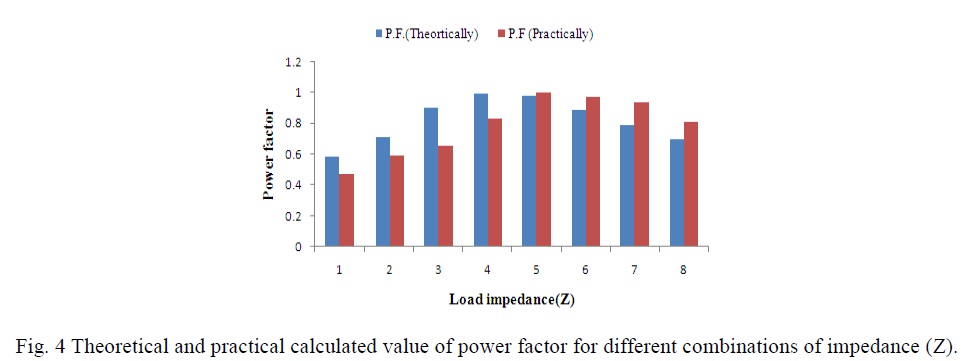
| The practical values of the power factor were obtained from the output waveforms of current and voltage. Both theoretical and practical calculated values of power factor are shown in Table 2. Also the error calculated by dividing theoretical and practical calculated values is shown. The calculated theoretical and practical values are plotted in Fig. 4 with different impedance values. As the values of the impedance is decreased i.e. variation in the value of inductance from Henry (H) to mH, the power factor value rises giving minimum and maximum values of 0.469 and 0.997 respectively. As the values of the impedance is increased, the power factor value falling maximum and minimum values of 0.997 and 0.809 respectively. There is also some difference in theoretical and practical calculated values are seen in the plot for certain combinations which may arise due to leakage of the inductive or capacitive components. |
 |
 |
 |
V. CONCLUSION |
| The research work is carried out to study the effect of the variation in the load on power factor. Eight different combinations of the load are taken with different values of inductance keeping resistance and capacitance constant. Load voltage and current are recorded for all combinations in the PC using Gold wave software. The sampling rate and duration of measurement are kept at value of 16000 and 1s respectively. From the analysis it is observed that the current through the load is inversely proportional to the values of inductance and similar is the case for power factor. The Practical values for power factor are rises from minimum and maximum value of 0.469 and 0.997 respectively. |
References |
|