| |
INTRODUCTION
|
| Infrared thermography is the technique that uses an infrared imaging and measurement camera to see and measure invisible infrared energy being emitted from an object. Thermal, or infrared energy, is not visible because its wavelength is too long for the sensors in our eyes to detect. It is the part of the electromagnetic spectrum that we perceive as heat. Unlike visible light, in the infrared spectrum, everything with a temperature above absolute zero emits infrared electromagnetic energy. Even cold objects such as ice cubes, emit infrared radiation. The higher the temperature of the object, the greater the infrared radiation emitted. The Infrared camera allows us to see what our eyes cannot. |
| In the industrial/commercial environment, almost everything gets hotter or cooler before it fails, making infrared cameras extremely valuable diagnostic tools with many diverse applications. And as industry strives to improve manufacturing efficiencies, manage energy, improve product quality, and enhance worker safety, new applications for infrared cameras continually emerge |
II. BASIC OF INFRARED ENERGY
|
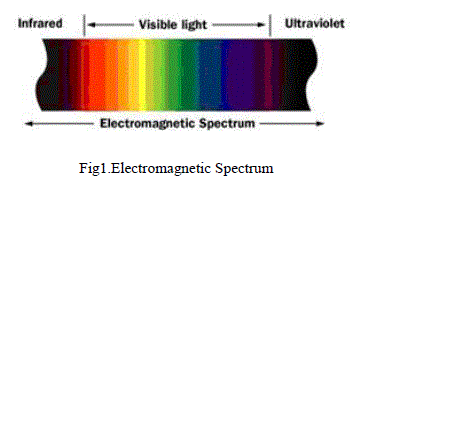
| All objects, cold or hot, radiate heat in the form of infrared energy. As an object increases in temperature, it radiates more energy, and the wavelength gets shorter. Infrared radiation, visible light and ultraviolet light are all forms of energy in the electromagnetic spectrum. The only difference is their wavelength or frequency. |
| The human eye can only see a narrow range of wavelength in the electromagnetic spectrum. These wavelengths range in length from 0.4 to 0.7 microns, a micron is one millionth of a meter. Most of what the eye sees is reflections from objects that high energy from the sun or an incandescent light bulb is striking. If the temperature an object gets hot enough however, above 525°C the energy from that object will radiate energy in the visible spectrum and we will see it. |
| The infrared camera can detect infrared energy well before we can see it with our eyes. Most cameras can image temperatures from -20 to 500°C, and can be extended down to -40°C, and up to 2000°C. The camera converts this invisible infrared energy into a two-dimensional visual image and displays this on a standard TV monitor. Most industrial cameras can also make temperature measurements, with accuracies to around ±2% at 30°C. The thermal information is stored onto a disc and is later downloaded into a computer to create report. This technique is useful for the objects which are moving or very hot, difficult to reach ,impossible to shut-off, dangerous to contact, contaminated through contact. |
| Infrared thermography is an effective, Condition Monitoring (CM) technology that quickly, accurately and safely locates problems, prior to failure, indicated by thermal anomalies |
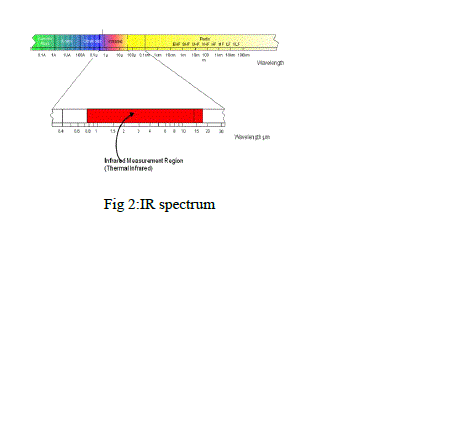
| As an object warms up, it radiates more energy, as photons, based temperature & Emissivity Infrared radiation is electromagnetic radiation, similar to light and radio waves. Wavelengths between 2-15 microns are called thermal infrared radiation |
A.The electromagnetic spectrum
|
| Infrared radiation, like light and radio waves, is a form of electromagnetic energy. |
| Infrared band comprises near infrared waves of about 1.0 um ,short waves of 2 to 5 um and long wave of 8 to 14 um . All wave are not capable of transmitting thermal energy on detector because those wave length thermal energy are absorb by environment |
B:IR THERMAL CAMERA
|
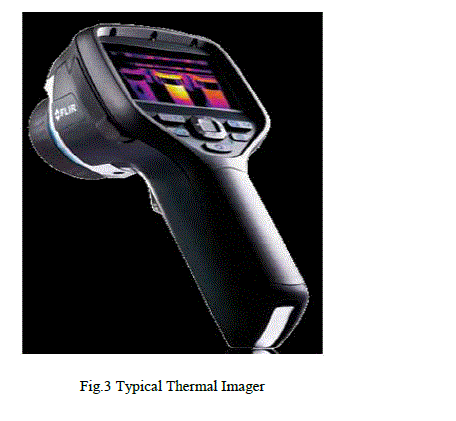
| An infrared camera is a non-contact device that detects infrared energy (heat) and converts it into an electronic signal that is then processed to produce a thermal image on a video monitor. The signal can also be used to and perform temperature calculations .Heat sensed by an infrared camera can be very precisely quantified, or measured, allowing us to not only monitor thermal performance, but also identify and evaluate the relative severity of heat-related problems. Recent innovations ,particularly detector technology, the incorporation of built-in visual imaging, automatic functionality and infrared software development deliver more cost-effective thermal analysis solutions than ever before. |
| Thermal cameras create pictures of heat rather than light. They measure infrared (IR) energy and convert the data to corresponding images of temperature. A temperature difference, usually an abnormal hot spot, is typically associated with a problem due to high electrical resistance or excessive friction. The look, feel and operation of thermographic cameras are similar to a digital camera with one key difference, instead of CCD sensors (charge-coupled device); most thermal imaging cameras today use microbolometer arrays. Their resolution is considerably lower than digital cameras, commonly only 160 x 120 or 320 x 240 pixels. When looking for a thermal imager, select one that is fully radiometric. This means that each pixel is recording temperature values, which can be recalled later in software. |
III. MEASUREMENT TECHNIQUES & THERMAL IMAGING APPLICATION
|
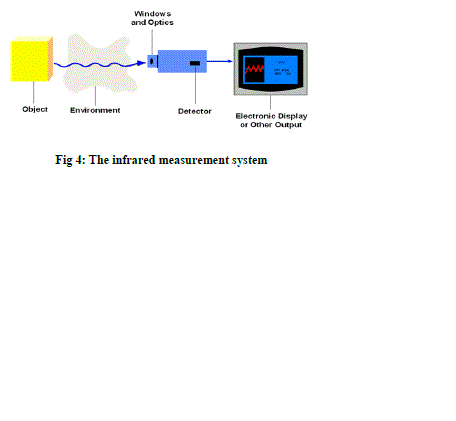
| Measurements were carried out on Testo thermal analyzer .Thermal image of Transformer radiator, Electronic circuit board,D.C motor were studied & analysed.Fig 4. Shows typical measurement setup for IR Thermography. |
A.APPLICATIONS
|
a)Printed Circuit Board Evaluation
|
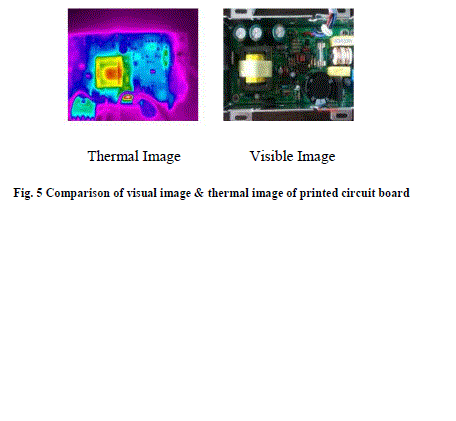
| Currently, the main failure mode of electric facilities is thermal failure. According to the statistics, temperature exceeding the limit value consists 55% of the causes of the electric facility failures. In general, the performance reliability of electric components is very sensitive to temperature. If the temperature increases 10C above the level of 70~800C, its reliability will drop by 5%.In the process of circuit development, besides the routine test tools. Thermal imager can be used for PCB detection. Through the different temperature points displayed, engineers can have an overall understanding of the current and voltage loaded on the components. This will help achieving circuit improvement, higher conversion efficiency, lower power consumption, reduced internal circuit temperature rise and high circuit reliability. |
b)Diagnosis of Electrical System
|
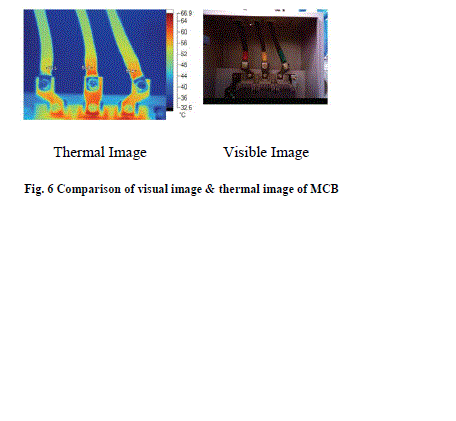
| Fig 6 shows R-Y-B connections of MCB. Its thermal image shows corresponding surface temperature of each phase. Since approximately same temperature is observed in all phases in thermal image , there is no problem connectivity or overload. |
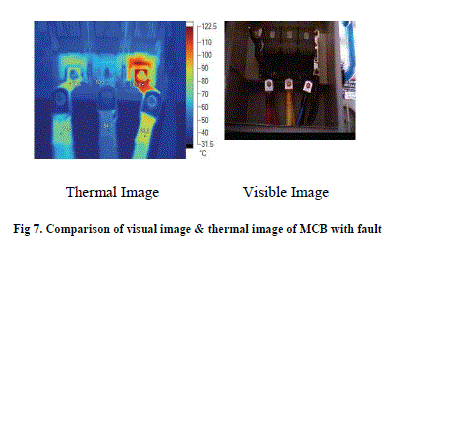
| Fig 7 shows R-Y-B connections of MCB. Its thermal image shows corresponding surface temperature at each phase. Above image shows High temp on B- Phase than other two phases . It indicates the problem of either connectivity or overload |
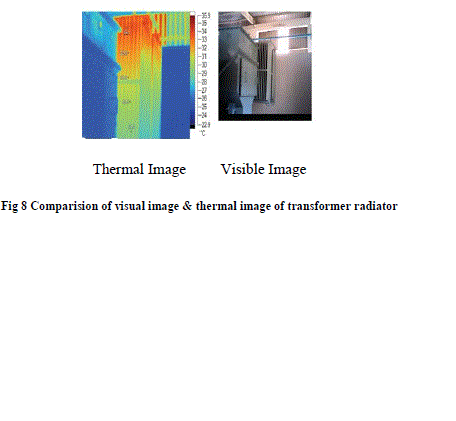
| There should be even heating on all radiator fins, except for variation due to air flow, loading and ambient temperatures. If some fins are cold, there are two possible problems, low oil level or oil flow blockage, either of which can be disclosed by thermo graphic inspection. |
| Fig 8 shows One side of Transformer radiator . In transformer radiator hot oil flowing from top side and cool oil is coming out from bottom side . After getting thermal profile for surface of fins , it gives heat distribution .In above image hot temp is on top side & comparatively cool on bottom side . Also no fin blockages are observed . |
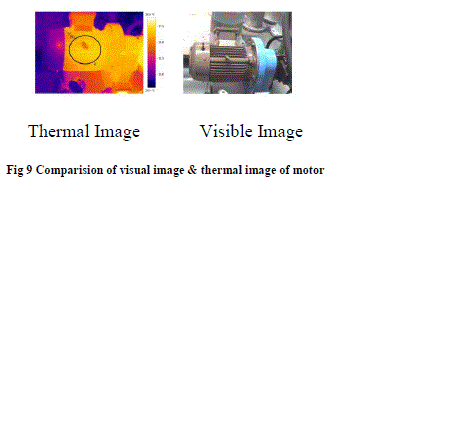
| Motors convert electromagnetic forces into mechanical forces. The three common types of motors are induction, synchronous and direct current. Problems in motors usually occur within “T” box connections, visible conductor connections, rotors or bearings. All of these problems involve overheating that is readily documented by an infrared camera monitor. Three-phase motor loads should be balanced, but lighting and single-phase loads may be unbalanced. Bearings are devices used to reduce the friction between two moving surfaces. The most commonly used bearings are sleeve, roller, ball or thrust bearings. Problems can be found by comparing surface temperature. Overheating conditions are documented as hot spots and are usually confirmed by comparing similar equipment. |
| Fig 9 Shows A thermal profile of a Motor . Using this thermal profile operating condition of motor can be studied . For each 10ºC rise over maximum rated temperature, Insulation life is reduced by 50% . We can also check the electrical connection of Motor & Bearing temp using thermography to avoid catastrophic failure of Motor. |
c) Process monitoring
|
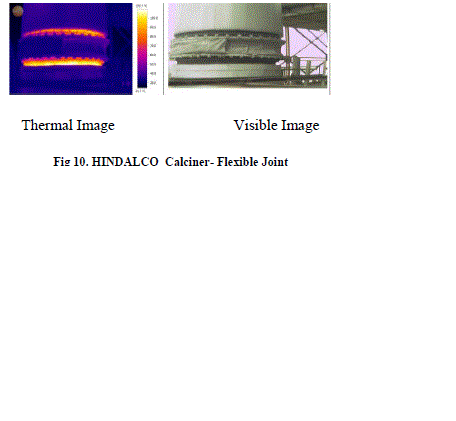
| Fig 10 Shows A thermal profile of a calciner flexible joint , Using this thermal profile & heat distribution operating conditions of entire plant can be monitor &if surface temperature is above reference value IR Thermography is useful in industrial electronics area since it is non-contact method. It uses remote sensing. Keeps user out of danger. Does not intrude upon or affect the target at all. It gives two dimensional display so that comparison between areas of the target is possible. Thermal patterns can be visualized for analysis. It is real time technique which enables fast scanning of stationary targets & also capture fast changing thermal patterns |
IV.CONCLUSION
|
| The infrared camera or thermal imager has many different applications in an electrical components manufacturing facility. Whether it is facilities upkeep, engineering support, or simply helping production lines to continue to flow products, thermal imaging is an important component to help maintain a viable and safe manufacturing operation. There are many ways to use the infrared camera as a maintenance tool. Whether it concerns scanning circuit boards, looking for “hot spots” on a substrate curing heater, or learning how the heat is exhausted on a product conditioning tester, innovative new troubleshooting applications will further cement the infrared camera as a must-have tool for manufacturing plants. |
Figures at a glance
|
 |
 |
 |
 |
 |
| Figure 1 |
Figure 2 |
Figure 3 |
Figure 4 |
Figure 5 |
 |
 |
 |
 |
 |
| Figure 6 |
Figure 7 |
Figure 8 |
Figure 9 |
Figure 10 |
|
| |
References
|
- Brent Griffith,DanielTurler,Howdy, “Infrared Thermographic Systems”,The Encyclopedia of imaging and Technology”,July,
- M.Hechtl,G.Steckert,C.Keller, “ Localization of Electrical shorts in diesand Packages using Magnetic Microscopy and Lock-in-IR Thermography
- ]D.S Prakash Rao “ IR Thermography &its applications in civil Engineering”The Indian concrete journal. www.infraredinstitutes.com
|