ISSN ONLINE(2319-8753)PRINT(2347-6710)
ISSN ONLINE(2319-8753)PRINT(2347-6710)
| HailuWeldekirosHailu,DanangHariKristiyanto, Ali Ramadan Ali ALatawi and SalehMuhammedRaqib P.G. Students, Bioscience postgraduate program, Department of Biology, Faculty of Mathematics and Natural Sciences, SebelasMaret University,Surakarta, Indonesia. |
| Related article at Pubmed, Scholar Google |
Visit for more related articles at International Journal of Innovative Research in Science, Engineering and Technology
Reed (Imperatacylindrical) is tall woody perennial grass with hollow slender stems and sharp leaves. In Indonesia it is traditional medicinal plant used as treatment for lowering high blood pressure and pain reliever.The objectives of this research were to compare morphometric differences based on altitude adaptations among reeds (Imperata cylindrical) and to analyze adaptation of reeds (Imperata cylindrical) to different altitudes based on the Isozyme electrophoresis patterns. For the morphometric studyheight, wet and dry body mass, dry root to shoot mas ratio were measured. Additionally, Peroxidase Isozyme electrophoresis pattern was studied. The result showed thatthe valuesof altitudes1905m>1500m>1000m>500m for all morphometric parameters.Based on morphometric measurements it was found that reeds prefer higher altitudes for their development. Although Isozymes are powerful molecular tools for gene variability within and between populations of plants, they are independent of altitudinal differences. Generally, biological markers such as morphology, biochemical and molecular genetic markers are useful biotechnology tools that can be used to study plant taxonomy and adaptation.
Keywords |
| Biological markers, Electrophoresis, Morphometry, Peroxidase,Reeds. |
INTRODUCTION |
| Reed (alang alang, local name) is tall woody perennial grass with hollow slender stems. Its scientific name is Imperatacylindrica, and placed in the family Graminae and Subfamily Panicoideae. Indonesians use the roots, rhizomes, leaves and flowers of this plant as traditional herbal treatment for lowering high blood pressure, pain reliever, urine laxative, to stop bleeding, blood cleanser, appetite enhancer, treatment against hepatitis, kidney disease, etc. due to the presence of large amount of secondary metabolites such as flavonoids. |
| Biological marker based study of adaptation of reeds to different altitudes is therefore very important in order to cultivate the plant in its optimum environment. There are three main types of Biological markers: morphological, biochemical and DNA based molecular markers. [5]. Markers can exhibit two modes of inheritance: dominant/recessive or co-dominant. Generally co-dominant markers are more informative than the dominant markers. Morphology characterization of plants includes: range of plants, plant’s height, stolon’s number, stolon’s length, leaf shape of basalt, the dominant position of leaves, leaf edges, leaf color, leaf blade edge color, pattern Petiole junction, crossing the color, the color of the liquid at the tip of the leaf blade, the main color of the leaves of bone, bone leaf pattern, the ratio petiole length/leaf blade length, color Petiole upper third, middle third Petiole color, lower third Petiole color, color Petiole lines, color Petiole ring bottom, bottom Petiole transverse incision, midrib length ratio/display total Petiole, leaf midrib color, waxy coating on leaves. Manifestation cormus, cormus length, branch cormus, cormus shape, weight, cortex color, and the flesh color the middle, the color of the meat fibers, cormus skin surface, skin thickness cormus, cormus fiber levels, and color shoots.[20]. |
| Genetic and molecular markers generally have contributed to the study of plant biology by providing methods for detecting genetic differences among individuals Molecular techniques in the field of biology have helped researchers to establish genetic relationship between the members of different taxonomic categories and construct phylogenetic trees. [17].Accordingto [8],biochemical markers detect variation at the gene product level such as changes in proteins and amino acids. Molecular markers on the other hand detect variation at the DNA level such as nucleotide changes: deletion, duplication, inversion and/or insertion. |
| Molecular markers work by highlighting differences (polymorphisms) within a nucleic sequence between different individuals. These differences include insertions, deletions, translocations, duplications and point mutations. The use of biochemical markers involves the analysis of proteins and isozymes. This technique utilizes enzymatic functions and is a comparatively inexpensive yet powerful method of measuring allele frequencies for specific genes. |
| Allozymes, being allelic variants of enzymes, provide an estimate of gene and genotypic frequencies within and between populations. This information can be used to measure population subdivision, genetic diversity, gene flow, genetic structure of species, and comparisons among species out-crossing rates, population structure and population divergence, such as in the case of crop wild relatives.[10]. |
| Isozyme is a molecular marker system based on the staining of proteins with identical function, but different electrophoretic mobility. Isozyme pattern is genetically controlled and constant for a tissue and development stage. Apart from being the popular research tool for, general protein and specific isozyme electrophoresis has led to cultivar identification and increased understanding about the changes occurred during course of adaptation of the species when grown at different locations [12]. |
| Isozymes (or isoenzyme) are powerful molecular tool for gene variability within and between populations of plants and animals. Isoenzymes are able to solve other questions of population biology, conservation biology, ecology and plant historical relationships.[9][14]. |
| According to [9], the main points of the concept of isozymes perceived by researchers are: A) multiple molecular forms of enzymes (isozymes) are common in organisms, B) Isozymes share a common catalytic activity, C) Isozymes often exhibit tissue or cell specificity, D) Molecular heterogeneity of enzymes confers flexibility, versatility and precision upon an organism in terms of metabolic functions, E) Molecular multiplicity is desirable for biological efficiency. |
| Researchers in different areas like taxonomy, genetics, molecular biology, biotechnology, etc., used Isozyme electrophoresis in combination with other techniques to make accurate and authentic conclusions. For example, Genetic diversity among Ocimum populations using morphological, seed proteins and Isozyme polymorphism [4],isozyme and RAPD analysis [11], Isozyme and protein banding pattern [1] [3][12][16],soluble protein and isoenzyme electrophoretic patterns [13],Anatomical, Isozymic and Saponin Constituents [2], Seed protein and esterase isozyme profile [15]. |
| Isozymes can be used for genetic conformity of in vitro plants. Genetic conformity of two micro-propagated medicinal plants using five isoenzyme systems namely peroxidase, esterase, acid phosphatase, alkaline phosphatase and polyphenol oxidase was Studied.[5]. Esterase showed maximum polymorphism followed by acid phosphatase, alkaline phosphatase, peroxidase, and polyphenol oxidase with 11, 4, 3, 2, 2 bands patterns, respectively. Observation of genetic conformity experiments had shown that in vitro grown plantlets exhibit more similarity to the mother plant and the callus of both plants In [7],it was studied the genetic affinities and variation among three Plumbago species by means of three different isoenzymes namely, esterase, peroxidase, poly phenol oxidase and Restriction Fragment Length Polymorphism. The finding showed 32 isozyme and 7 RFLP band patterns. Cladogram analysis indicated that P.auriculatahad 100 % divergence. Electrophoresis is the controlled motion of charged molecules using an electrochemical cell that is used to move the molecules through the gel matrix. Gel electrophoresis is a method for separation and analysis of macromolecules (DNA/RNA, proteins and Enzymes) and their fragments, based on their size, charge and pH. Electrophoresis of positively charged particles (cations) is called Cataphoresis whereas electrophoresis of negatively charged particles (anions) is called Anaphoresis. The technique of electrophoresis is generally known to most biologists and the protocols will differ slightly from one lab to another. |
| There are three types of Gel Electrophoresis Media: |
| 1. Starch Gel : are swollen potato starch granules (little used now except for prep isoelectric focusing) |
| 2. Agarose Gel: purified large MW polysaccharide (from agar) ==> very open (large pore) gel used frequently for large DNA molecules |
| 3. Polyacrylamide Gels: are the most commonly used gel because they are very stable and can be made at a wide variety of concentrations or even with a gradient of concentrations and havelarge variety of pore sizes |
| The use of isozyme markers have the advantage because isozymes regulated by a single gene and are co-dominant and inheritance, normally segregated according to Mendel ratio is collinear with genes and gene products directly. This marker is stable because it is not influenced by environmental factors more quickly and accurately because it does not wait until the plants reproduce. According to [9], among others isozyme excess produces more accurate data because the end of the gene expression. Isozyme is relatively simple, requiring relatively low cost when compared with other molecular markers.[6]. The objectives of this research are to compare morphometric differences based on altitude adaptations among reeds (Imperata cylindrical) and to analyze adaptation of reeds (Imperata cylindrical) to different altitudes based on the Isozyme electrophoresis patterns. |
METHODS AND MATERIALS |
Place and time |
| The sampling site was in Tawangmangu while the research activities for Morphometric measurement and Isozyme electrophoresis were done at Biology laboratory, Faculty of Mathematics and Natural Science, SebelasMaret University on October 2013. |
Morphometric-comparison |
| Materials such as GPS (to measure the altitudes), scissor, analytic Balance, Meter, and writing materials were used for morphometric measurements and documentation.Height, dry and wet root and shoot mass, dry shoot to root ratio was measured for reed plant samples taken from four different altitudes namely:500m, 1000m, 1500m and 1905m. |
Isozyme Electrophoresis |
| Leaf Sample collection, Preparation and extraction |
| Fresh reed leaves samples were collected, cut using scissor and labeled. The samples were kept plastic bag at 40 C for until for later extractionSamples should not be kept for long days because enzymes will die the longer be active again. 0.25 grams of each fresh tissue of reed leaf weretaken and mixed with 1ml extraction buffer with based on 1:4 (w/v) ratios. The mixtures were crushed using a mortar and pestle with extraction buffer.After finely crushing, the samples were transferred to four different centrifuge tubes of 15 ml size labeled according to the respective altitudes.Then it was centrifuged with a speed of 3600 rpm for 6 minutes.Supernatant was takenas 10-20 μl for peroxidase into the prepared gel. |
Buffer Preparation |
| Buffers that were used in electrophoresis are basedon [18] and[19]. The preparation method of is as follows: |
| 1. Buffer Tank (borax buffer): This solution is made by dissolving 14.4 grams of borax acid and 31.5 grams of borax in distilled water to reach a volume of 2 liters. |
| 2. Extraction Buffer: This solution is made by dissolving 0.018 grams of cysteine, 0.021 grams of ascorbic acid, and 5 grams of sucrose in 20 ml of pH 8.4 buffer tanks. |
Preparing Polyacrylamide gel |
| Preparation of gel begins by assembling gel mold, glass mold is equipped with spacers (separators) are placed behind glass mold smaller. The glass mold casting mounted on the frame, then in pairs on the casting stand. |
Preparation of polyacrylamide Stock Solutions |
| Two stock solutions are used,as following: |
| 1. Stock Solution A: This solution is made by dissolving 4.5 grams of TRI (Hydroxymethyl) methylamine (PURISS), 0.51 g Citric Acid and 500 ml aquabides. |
| 2. Stock Solution B: This solution is made by dissolving 30 grams of acrylamide; 0.80 grams N N ' methylene - bis - acrylamide and 100 ml aquabides. |
| Making Polyacrylamide solution: Preparation of gel by mixing 3.5 ml of stock solution A and 1.5 ml of stock solution B (N.B: if for two Isozymes multiply the above values by two).Then 10 mL of N , N , N ' , N' - tetramethyl - ethylenediamine ( TEMED ) was added and mixed. To polymerize gel needs to be done adding and mixing 110 mL of ammonium persulphate (APS) with a dilution ratio of 1:10 (N.B. there is no need of heating because APS polymerizes the gel). Then the mixture was stirred using a spatula before the solution is poured into electrophoresis. |
| Running Electrophoresis: electrophoresis tool used is set of BIO - RAD Mini Protean 3 series 041BR62447 vertical type of USA product. Polyacrylamide solution was poured on the electrophoresis tank and allowed to harden. 10 ml of the above solution can be used to make 2 gels. Hardened Polyacrylamide gel can be retrieved and ready for use.Comb Gel electrophoresis tank was installed on. Once gel formed, the comb was removed from the mold. 10-20 μlthe extracted sample mixture form the different altitudeswere poured into the well on Polyacrylamide gel for peroxidase and labeled accordingly. Formed gel was transferred to the clamping frame and put in a buffer tank and then filled with running buffer until submerged. Then electrophoresis tank was closed and connected to power supply.The sample was then run by electrophoresis with constant voltage 100 volts, 400A at room temperature for 3 hours minutes. (Hint: if the number of gels is increased from 2 to 4 or more, the 3 hour time can be reduced to 2 hours).Then the gel plastic tray wastaken out for the next staining procedure/ Completed running gel was transferred to a staining dish to be colored with enzyme dyes. |
Peroxidase Staining and gel documentation |
| Peroxidase was made according to the method in [18] and [19] that means:0.0125 grams of o-Dianisidine, dissolved in 2.5 ml of acetone in 50ml Erlenmeyer/glass beaker. Then 20ml of acetatebuffer pH 4.5 added. And 4 drops of H2O2 (hydrogen peroxide) will be added. Finally samples which were electrophoresed was separated and submerged into peroxidase staining solution .The gels were gently shaken every 2 minutes for±30 minutes to get full staining. After bands emerge staining solution was be discarded.The gels were washed with distilled water. Photo was taken using camera. |
Analysis Method |
| Morphometry data arepresentedin bar graphs and in analyzed descriptively. The data on isozymic banding pattern is analyzed qualitatively based on the presence or absence of bands appeared on the gel, and then dendogram is formed. The morphometric and Isozyme data helps to trace if there is speciation as result of altitude difference. Analyzing the results of the band is highly dependent electrophoresis of what topics studied. |
RESULT AND DISCUSSION |
Morphometric result |
| The measurements of morphometric parameters used are presented in bargram forms. After formulating the bargrams, the results are compared and analyzed accordingly. |
 |
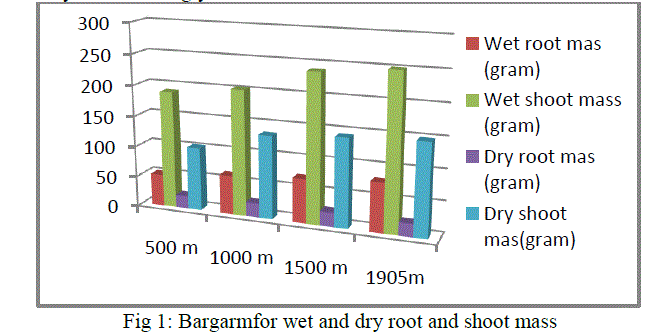
| Reed plant growing in an altitudinal range of 1905m has the highest measurements for each of the above parameters like wet and dry weight of root and shoot. Then, it is followed by 1500m, 1000m and 500m. |
 |
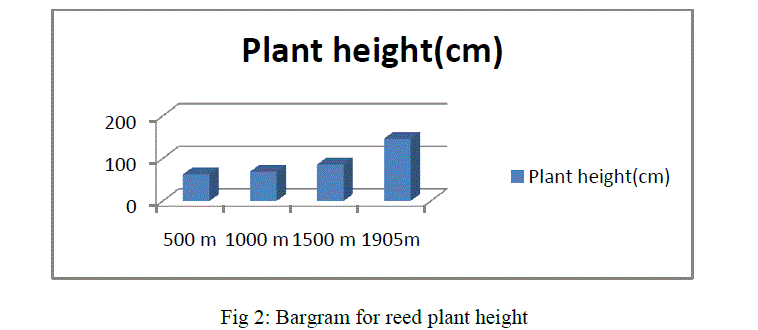
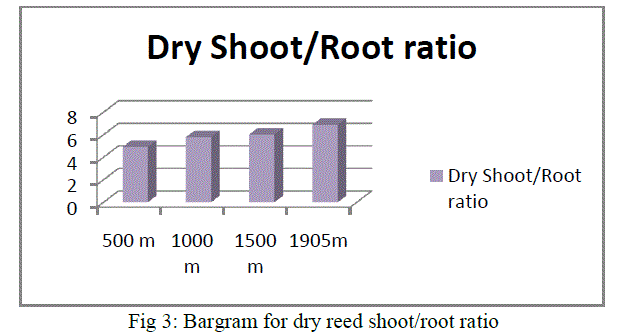
| As shown in the above bargram, reeds growing in an altitudinal range of 1905m have the highest dry shoot/ root ratio followed by 1500m, 1000m and 500m. In general all the above morphometric measurement results show that reed plant growth has the following descending value order:1905m>500m>1000m>500m.From the overall morphometric measurement results, it is clearly found that an increase in altitude has positive effect for growth and development of reeds. Therefore, plant growth is influenced by altitude. The air becomes colder and drier, affecting plant life accordingly. Air pressure decreases as altitude increases. Because the air is thinner, it holds less heat. Therefore, the overall temperature is colder than it is at lower elevations.Our observation has shown that the higher the altitude, the colder is the temperature. Though other factors are contributors, directly or indirectly, altitude plays a part in the development and survival of all plant life. |
Peroxidase Electrophoresis Result |
| The result of peroxidase electrophoresis is presented and in the following zymogram and dendogram followed by brief discussion. |
 |
| As shown in the above figures, the result from peroxidase isozyme electrophoresis has revealed that reeds that grow at altitude of 500m and 1500m, 1000m and 1905m, 1500m and 1905m each have 71.4% coefficient of similarity. We can infer form the dendogram that isozymes are independent of altitudinal differences. Isozymes, being proteins, are products of gene expression. They are mainly affected by change in gene sequence, mutation, gene interaction with environment. Environment such as altitudinal difference therefore, has only indirect effect on Isozymes. |
| For speciation to occur the influence of genetic and environmental factors interact with each other. Environmental factors such as altitude, temperature, annual rainfall pattern, soil type, ecology, habitat type and others together with genetic constituents determine the fate of plant speciation. |
CONCLUSION |
| Based on morphometric measurements it was found that reeds prefer higher altitudes for their development. Although Isozymes are powerful molecular tools for gene variability within and between populations of plants, they are independent of altitudinal differences. Generally, biological markers such as morphology, biochemical and molecular genetic markers are important biotechnology tools that can be used to study plant taxonomy and adaptation. |
References |
|