Keywords
|
| Glucose, insulin, System identification approach, regulation, LabVIEW |
INTRODUCTION
|
| Diabetes is associated with various abnormalities in insulin metabolism. The sugar, starch and other food items are converted in to energy with insulin. Scientists are developing insulin external dosage which is fed in a specified rate to regulate 60-120 mg/dl glucose level. The diabetes is classified as Type-1 and Type-2. In case of Type-1 insulin regulation is very difficult. For these patients blood glucose concentration is controlled by the insulin dosage with external insulin infusion device. An electro medical device acts as an insulin pump which pumps insulin through narrow and flexible plastic tube that ends with a needle inserted just under the skin near the abdomen. The pump releases doses insulin doses before the meals and during the several periods of the day based on the readings of glucose sensors. Concentration of glucose may fluctuate depending on the physical activities of the human. So, the insulin requirement may vary. |
| In 1961, Bolie developed the first diabetic model which consisted differential equation each for insulin and glucose [2]. Then Ackerman introduced a similar model for the dynamics of glucose and insulin [3].The Glucose and insulin interaction effects were obtained from the first two models. But the two models not satisfied the accountancy of distribution of glucose and insulin throughout the human body. Another glucose-Insulin regulation model is suggested in 1974 by stolwijk and hardy but the model lacked the dynamics of glucose transport and distribution in tissues and effects of glucagon, which raises the blood glucose concentration [4]. Cobelli et al. in 1982 focused on 5- compartment models for glucose, insulin and glucagon effects each lumped into its own whole body blood pool [5]. This also considered the use of threshold functions for saturation. The peripheral versus portal route comparison for insulin administration in glucose control in closed loop was done by Cobelli and Ruggeri (1983).But they were unable to explain the distribution of glucose in the body [5]. Lehmann and Deutsch in 1992 explained a model with nonlinear behaviour which considered a sub model of glucose was a single compartment extra cellular pool and a insulin 2- compartment model describing plasma and active concentrations [6]. This was generalized into meal model which approximated the absorption kinetics of glucose by the blood stream. Puckett in 1992 developed a model of study of diabetes mellitus in which a two blood pool system representing insulin and glucose concentrations which were directly affected by metabolic flux terms and exogenous signals [7]. With the help of Light foot in 1995, Puckett also explained intra and inter patient variability and steady state behaviour using his models [8]. Sorensen treated glucose and insulin separately with coupling through metabolic effects utilizing threshold functions. A whole body lumped representation was also included to complete the glucose-insulin system with counter regulation. A small inclusion into this model was made by Sorenson to include meal disturbances and parameters for uncertainty analysis. |
| In this paper, the system identification based glucose insulin regulation model was proposed as a good modelling approach to estimate the sensitivities of insulin and the corresponding glucose levels which are useful in the study of diabetes. In this model the glucose and insulin dynamics are represented by two components using system identification approach and the parameters are estimated separately within each component. Using the estimated parameters the model was simulated using LabVIEW and the effectiveness was analysed based on simulation results. |
II. IMPORTANCE OF SYSTEM IDENTIFICATION APPROACH
|
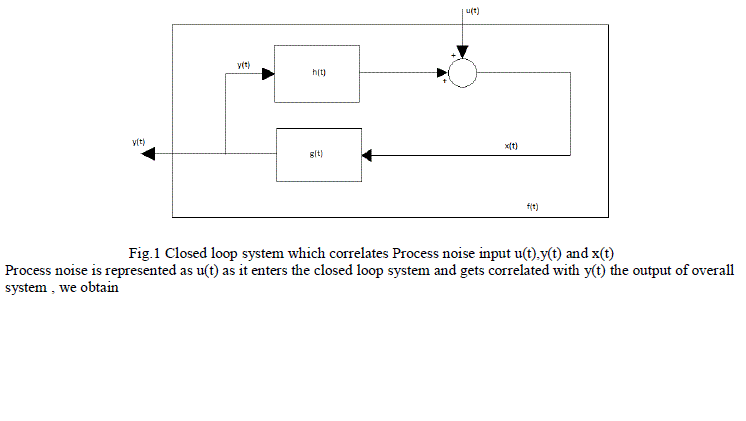
| There are a wide range of physiological examples where experimental interventions are employed to techniques such as “open the loop “, but these are always not applicable. Identify the physiological system under normal operating conditions when its feedback loops are functionally intact. Then consider a problem involved with identifying the impulse response h(t) shown in the fig 1. The unobservable disturbance u(t) that enters the closed loop represents both a “measurement” and “process” noise input. It is considered as measurement noise since it corrupts the measurements x(t) which otherwise would be related to y(t) which is the input to the system component. The mathematical expression relating x(t) to y(t) and u(t): |
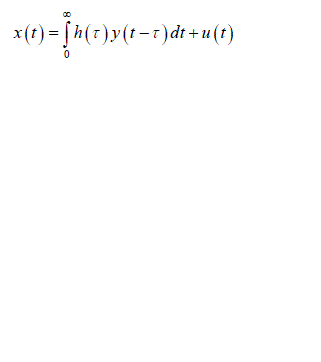 (1) (1) |
| Fig.1 Closed loop system which correlates Process noise input u(t),y(t) and x(t) Process noise is represented as u(t) as it enters the closed loop system and gets correlated with y(t) the output of overall system , we obtain |
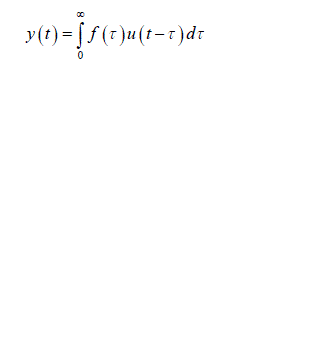 (2) (2) |
| To obtain an unbiased estimate of h(t) by the least squares approach using y(t) as input and x(t) as output, the final solution deviates from the equation i.e. u(t) becomes uncorrelated with y(t).Thus, the direct application of open loop system identification methods to solve this problem will not give accurate estimates of h(t). System identification approach for solving this problem is described below. |
II. GLUCOSE INSULIN REGULATION SYSTEM MODELING
|
| The effective method of partitioning the effects of feed forward and feedback components of a closed loop system from one another is to assume a model structure for atleast one of these components. The system identification model of blood glucose regulation was introduced in this paper. Considering the fig 1, suppose that x(t) and y(t) correspond to plasma glucose and insulin concentrations at time t. Then the impulse response function h(t) will represent the glucose regulation kinetics, while g(t) would reflect the dynamics of insulin production and utilization. The closed loop system is perturbed by an impulsive input u(t) consisting of an intravenous injection of glucose. Using this resulting timecourses in y(t) and x(t) as input and output respectively, the model of the glucose dynamics can be identified. Subsequently, by using x(t) as input and y(t) as output, the parameters of the model of insulin dynamics can be estimated. |
| Now consider only the estimation of system identification model of glucose regulation i.e. insulin effects glucose. The estimation of converse model in which glucose effects the insulin is not considered. Thus the input is the measured plasma insulin concentration y(t) following the intravenous glucose injection, while the output is corresponding measured glucose concentration x(t). The insulin concentration y(t) acts through a remote compartment so that effective insulin concentration, ïÃâ¬Ã¨ ïÃâ¬Ã© eff y t is given by |
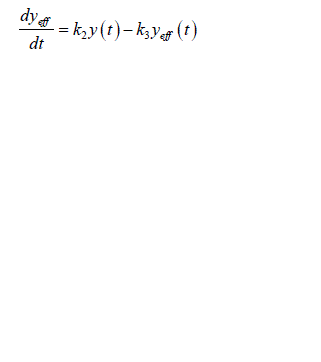 (3) (3) |
| Where k 2 and k 3 represents the fractional rate parameters for insulin transport into and elimination from remote compartment. This compartment is not directly measurable. The rate of change of glucose in blood plasma is given by |
| dx/dt= Net rate of glucose production by liver – Rate of glucose utilization by other tissues |
| Net rate of glucose production by the liver = B0 ïÃâ¬Ã k5x ïÃâ¬Ã¨t ïÃâ¬Ã© ïÃâ¬Ã k6 yeff ïÃâ¬Ã¨t ïÃâ¬Ã© x ïÃâ¬Ã¨tïÃâ¬Ã© |
| Rate of glucose utilization by other tissues = ïÃâ¬Ã¨ ïÃâ¬Ã© ïÃâ¬Ã¨ ïÃâ¬Ã© ïÃâ¬Ã¨ ïÃâ¬Ã© d 0 3 4 eff R ïÃâ¬Ã« k x t ïÃâ¬Ã« k y t x t |
| In the equation 0 B represents the rate of glucose production by the liver. It is assumed to be proportional to an insulin independent component (through rate constant 3 k ) and an insulin dependent component 6 k . Similarly the rate of glucose utilization by non-hepatic tissues is assumed to have a constant component which is proportional to glucose concentration and sensitive to both glucose and effective insulin concentration. Then |
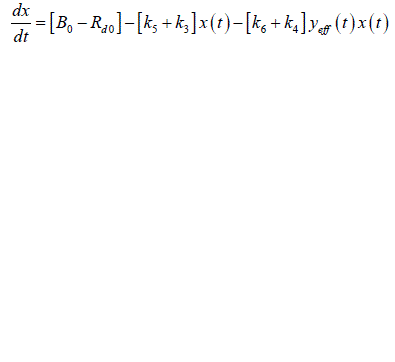 (4) (4) |
| As in equation the effective plasma glucose capacitance is factored into parameters on right hand side of the equation. In addition since ïÃâ¬Ã¨ ïÃâ¬Ã© eff y t is not measurable a further reduction in parameterization can be achieved by considering a new variable z(t) which is proportional to ïÃâ¬Ã¨ ïÃâ¬Ã© eff y t : |
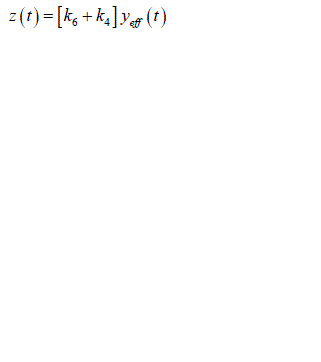 |
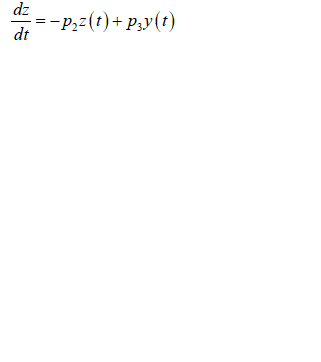
| Substituting equation into equations we obtain |
 |
| And |
 |
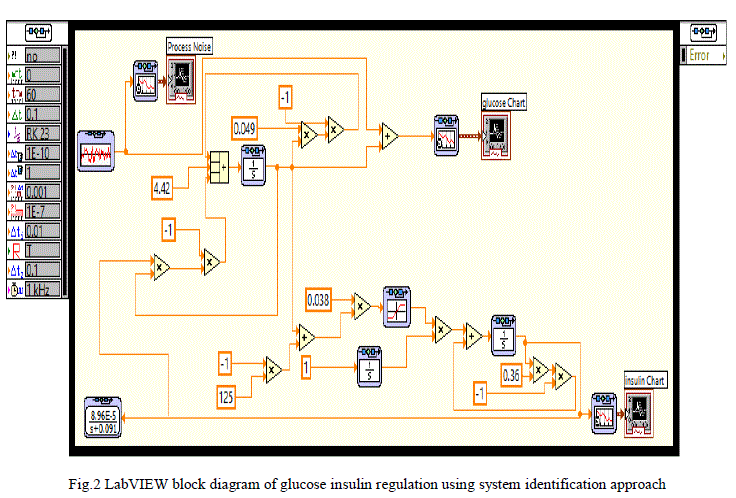
| The way in which the unknown parameters 1 2 3 p , p , p and 4 p are estimated is as follows. Initially we start with approximations for unknown parameters. Using the measured input time course y(t) and the initial parameter values. Equation is first solved to obtain the value of z at the present time step. Using this value and integrating the equation, the glucose concentration at the next time step can be completed. This process is repeated until the prediction has been made for the entire duration. These are compared to actual blood glucose measurements and the value of criteria function (sum of squares of the differences between measured and predicted glucose values) is computed. An optimization algorithm is used for calculating other four unknown parameters which will produce a lower value of criterion function [14][15][16]. The estimated values of unknown parameters using m-file are P1= 0.049, P2= 0.091, P3= 8.96x10⁻⁵ and P4= 4.42[17]. |
IV. SIMULATION RESULTS
|
| The Glucose-insulin regulation model using system identification approach is implemented in LABVIEW as shown in figure 2. In LabVIEW software simulation loop, integrator block and the functional blocks available in control design and simulation tool kit are used to simulate the model. In the front panel of LABVIEW, the process noise, glucose concentration and insulin concentration graphs are visualised and in the block diagram the modelling equations developed for diabetic persons are implemented. The modelling equations are simulated using LabVIEW. |
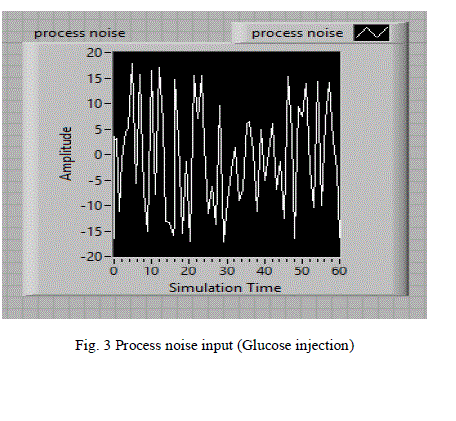
| A random signal acts as the process noise is considered as input and shown in fig 3.This random noise signal is represented as food intake or glucose injection at irregular intervals to the human body. |
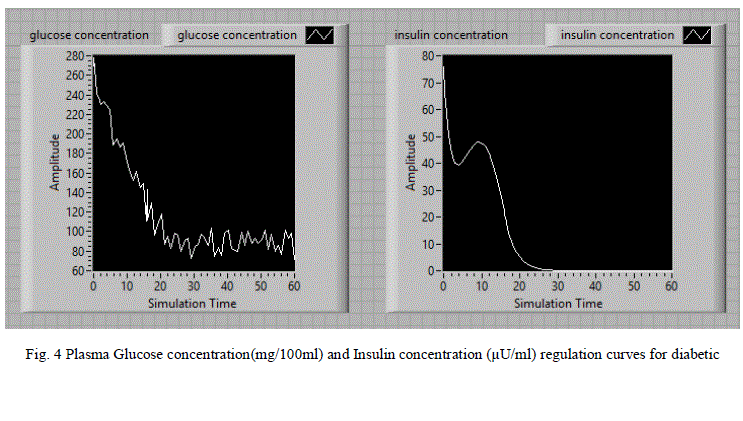
| For the random noise signal input, the LabVIEW model is simulated and the corresponding glucose and insulin concentration variations with simulation time are shown in fig 4.When the glucose concentration is increased, resulting in the release of insulin. After a period about 30 seconds glucose concentration reaches to its steady state value and there after the insulin concentration also reaches to its steady state. |
V. OBSERVATIONS
|
| The simulation results for diabetic persons are tabulated in table 1.Based on the simulation results we observed that diabetic person body produces very less amount of insulin after the injected glucose in the form of random signal. Consequently, excessive amounts of glucose accumulate in the blood. Even though the blood has plenty of insulin, the cells of a person with diabetes are not getting their crucial energy and growth requirements. After the application of insulin dosage, the glucose concentration is regulated to the normal level after 30 minutes. Generally insulin pumps and inhaled insulin techniques are used for the administration of insulin in the treatment of diabetic patients. These simulation results are useful for the design of insulin pumps and other related medical equipment. |
VI. CONCLUSION
|
| A system identification model for Glucose- Insulin regulation has been developed, implemented and analyzed by using related equations. LabVIEW software is used to simulate the modelling equations. The proposed model show significant management and regulation of glucose insulin kinetics and useful for design of diabetic test equipment in the laboratories. We are confident that our model in LABVIEW can contribute in the research and subject fields. |
Tables at a glance
|
 |
| Table 1 |
|
| |
Figures at a glance
|
 |
 |
 |
 |
| Figure 1 |
Figure 2 |
Figure 3 |
Figure 4 |
|
| |
References
|
- Pinky Dua, Francis J .Doyle, and Pistikopoulos, “Model-Based Blood Glucose Control for Type 1 Diabetes via ParametricProgramming”, IEEE Transactions on Biomedical Engineering, vol.53, pp.1478-1491, August 2006.
- Bolie, V.W., “Coefficients of Normal Blood Glucose Regulation”, Journal of Applied Physiology, 16,783, 1961.
- Ackerman, E., Gate wood, L.C., Rosevear, J. W. and Molnar, G.D., “Model studies of blood glucose regulation”, The Bulletin ofMathematical Bio Physics, 27(suttl.), 21,1965.
- P.Srinivas, P.Durga prasada Rao, “Closed loop model for Glucose Insulin regulation system using Labview”, International Journal ofInstrumentation and Control Systems (IJICS), Vol.2, No.4, pages 93-102, October 2012.
- Cobelli, C. and Ruggeri, A., “Evaluation of portal/peripheral route end of algorithms for insulin delivery in closed loop control of glucosein diabetes- A modelling study ”, IEEE transactions on Biomedical Engineering, BME-30: Pages90-103,1983.
- Lehmann, E.D. and Deutsch, T., “A Physiological Model of Glucose-Insulin Interaction in Type 1 Diabetes Mellitus”, Journal ofBiomedical Engineering, Vol. 14, May 1992.
- Puckett, W.R, “Dynamic Modeling of Diabetes Mellitus”, PhD. Dissertation, Department of Chemical Engineering, University of Wisconsin-Madison, 1992.
- Puckett, W.R and Lightfoot, E.N., “A Model for Multiple Subcutaneous Insulin Injections Developed from Individual Diabetic Patientdata”, American journal of Physiology, 269(Endocrinology metabolism 32), E115, 1995.
- Nicolas W. Chabat, Tuhin K. Roy “Glycemic Control in Critically Ill Patients - Effect of delay in Insulin Administration”, Proceedings ofthe 2005 IEEE Engineering in Medicine and Biology, 27th Annual Conference, Shanghai, China, September 1-4, 2005.
- 1 Zlatko Trajanoski, Paul Wach, “Neural Predictive Controller for Insulin Delivery using the Subcutaneous Route”, IEEE Transactions onBiomedical Engineering, vol.45, pp: 1122-1134, 1998.
- J.Geoffrey Chase, Z-H Lan, J-Y Lee, and K-S Hwang, “Active Insulin Infusion of the Blood Glucose Derivative”, Seventh InternationalConference on Control, Automation, pp.1162-1167, December 2002.
- Jiming Chen, Kejie Cao, 1 You Xian Sun, Yang Xiao, and Xu (Kevin)Su, “Continuous Drug Infusion for Diabetes Therapy: A Closed-Loop Control System Design”, Received 15 july 2007; Revised 25 November 2007; Accepted 5 December 2007.
- Dr. Jameel Ahmed, Dr. Bilal A. Alvi, Zeeshan Ali khan, “Blood Glucose Insulin Regulation and Management System usingMatlab/Simulink”, International Conference on Emerging Technologies, IEEE-ICET 2008, Rawalpindi, Pakistan, 18-19 October, 2008.
- Fernandez, M.Acosta, D.Villasana, M. Streja, D., “Enhancing Parameter Precision and the Minimal Modeling Approach in Type IDiabetes”, Proc. of 26th Annual Int. Conf. of IEEE Eng. in Biomedicine Soc., San Francisco, CA, USA, pp. 797–800, September 2004.
- Hovorka R, Canonico V, Chassin LJ, Haueter U, Massi-Benedetti M,. Orsini Federici M, Pieber TR, Schaller HC, Schaupp L, VeringT.Wilinska ME, “Nonlinear Model Predictive Control of Glucose Concentration in Subjects with Type 1 Diabetes”, PhysiologicalMeasurement, 25 (2004), pp. 905–920, 2004.
- Juhász, CS., “Medical Application of Adaptive Control Supporting Insulin Therapy in case of Diabetes mellitus,” Ph.D. dissertation,Electrical eng. program, Budapest University of Technology and Economics, Budapest, Hungary, 1993.
- 0Michael C. K. Khoo, “Physiological control systems:Analysis,simulation and estimation”, The Institute of Electrical and ElectronicsEngineers, Inc. 3 Park Avenue, 17th Floor, New York, NY 10016-5997.
|